. 2018 Jun 27;285(1881):20180694.
doi: 10.1098/rspb.2018.0694.

Cascading speciation among mutualists and antagonists in a tree-beetle-fungi interaction

Affiliations

Cascading speciation among mutualists and antagonists in a tree-beetle-fungi interaction

R R Bracewell et al. Proc Biol Sci. .

Abstract

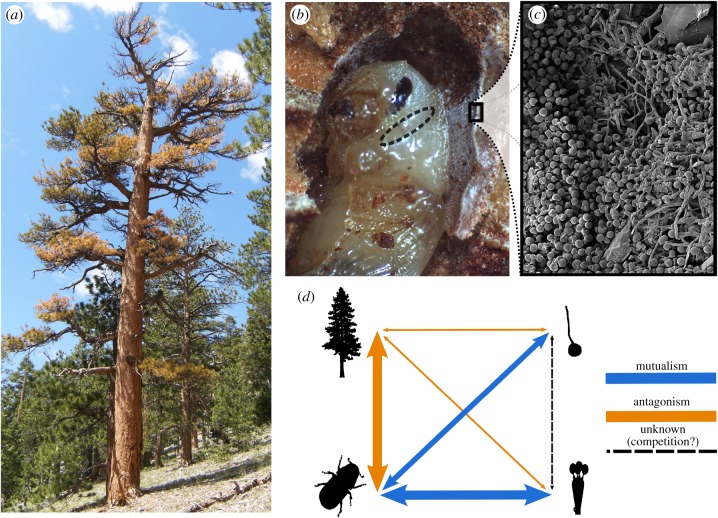
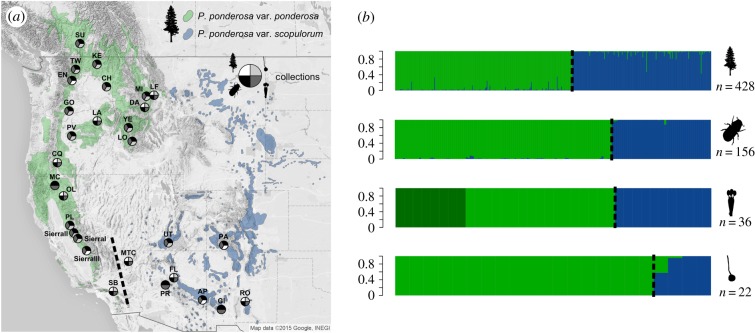
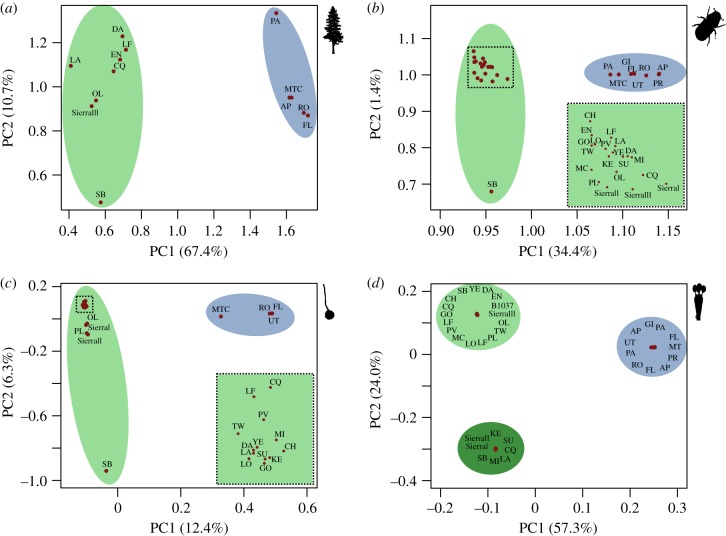
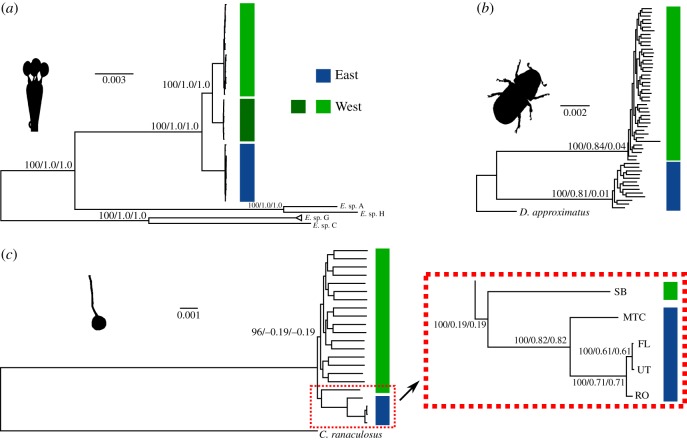
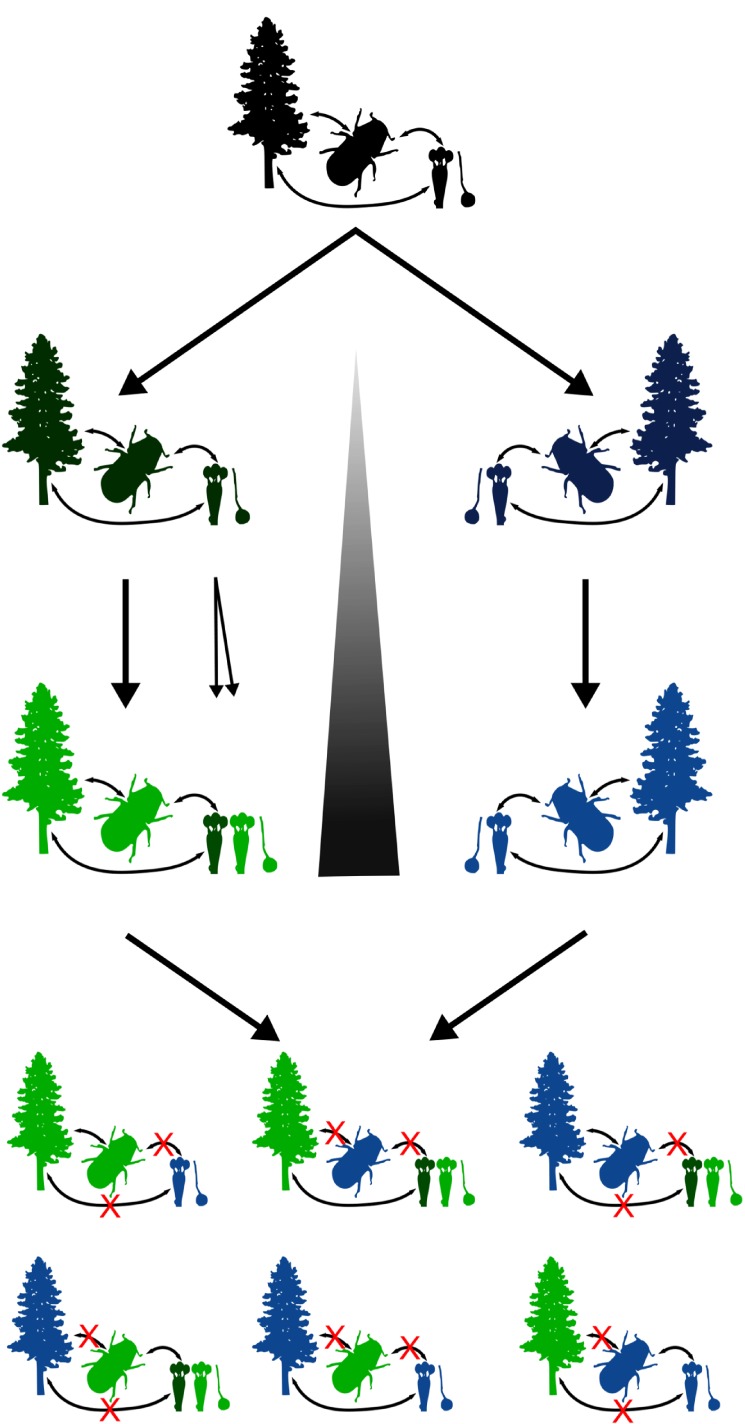
Cascading speciation is predicted to occur when multiple interacting species diverge in parallel as a result of divergence in one species promoting adaptive differentiation in other species. However, there are few examples where ecological interactions among taxa have been shown to result in speciation that cascades across multiple trophic levels. Here, we test for cascading speciation occurring among the western pine beetle (Dendroctonus brevicomis), its primary host tree (Pinus ponderosa), and the beetle's fungal mutualists (Ceratocystiopsis brevicomi and Entomocorticium sp. B). We assembled genomes for the beetle and a fungal symbiont and then generated reduced representation genomic data (RADseq) from range-wide samples of these three interacting species. Combined with published data for the host tree, we present clear evidence that the tree, the beetle, and the fungal symbionts are all genetically structured into at least two distinct groups that have strongly codiverged with geographical isolation. We then combine our genomic results with diverse population and laboratory-based data to show evidence for reproductive isolation at each level of the cascade and for coevolution of both antagonistic and mutualistic species interactions within this complex network.

Keywords: coevolution; diversification; ectosymbiosis; mutualism; symbiosis.


Conflict of interest statement

The authors declare no competing interests.

Figures

Figure 1.
Figure 1.
The ponderosa pine–western pine beetle–fungal symbiont interaction. (a) Ponderosa pine is an iconic tree widely distributed across the western USA. The western pine beetle kills ponderosa pine by constructing tunnels and reproducing in the phloem and bark. After successful tree colonization and inoculation of fungal symbionts, developing larvae leave the phloem and tunnel into the nutrient-poor outer bark where they feed heavily on symbiotic fungi that provide critical nutrients to the developing insect [16]. (b) The beetle–fungal symbiosis is maintained via an exoskeletal structure in the female (mycangium; its location highlighted with an ellipse) that harbours glands and excretes unknown substances thought to nurture and promote specificity [16]. After pupation, adult beetles incorporate spores into the mycangium for transport to the next host tree. (c) Shown is a scanning electron microscope image (see the electronic supplemental material, figure S1 for additional images) of symbiotic fungi and spores lining the pupal chamber. (d) Schematic of the complexity of the tree–beetle–fungi interaction. Arrow widths scaled to represent the strength of the interaction.
Figure 2.
Figure 2.
Geographical distribution and codifferentiation in the tree–beetle–fungi system. (a) Ponderosa pine comprised two subspecies (var. ponderosa and var. scopulorum) thought to have formed in isolation in southern refugia during the Pleistocene. The distribution of the beetle currently follows its primary host tree, except where absent in the central and northern portion of the P. ponderosa var. scopulorum range. The northern range limits of the beetle (and fungi) in the var. scopulorum range is broadly coincident with a shift in tree defensive monoterpenes [26]. Tree, beetle and fungal collection locations are shown, and when present at a location, are represented in the pie chart. (b) Structure and Admixture results for the tree, beetle and two symbiotic fungi and the posterior probability of assignment for each individual (vertical bar) to the optimal number of genetic clusters (K) for each species.
Figure 3.
Figure 3.
Fine-scale population structuring and relationships among sites. Results of PCA for the (a) tree, (b) beetle and symbiotic, (c) ascomycete and (d) basidiomycete. Highlighted in green are West sites, and in blue are East sites. Colours correspond to those used in figure 2b. Dense clusters of points are highlighted in boxes and expanded in the bottom right.
Figure 4.
Figure 4.
Phylogenetic relationships among individuals. Rooted maximum-likelihood trees (RAxML, GTR+ gamma) for the (a) basidiomycete, (b) beetle and (c) ascomycete. For the beetle, only the most closely related outgroup (D. approximatus) is shown (see the electronic supplementary material, figure S4). Bootstrap support and the associated internode certainty (BS/IC/ICA) are shown at important locations in each tree. A total of 315 655, 2 901 196 and 2 926 074 bp of genomic sequence (both variant and invariant positions) was used to infer the relationships among the basidiomycete, beetle and ascomycete individuals, respectively. An important location of the ascomycete tree (c) is expanded to the right.
Figure 5.
Figure 5.
Model for cascading speciation in the ponderosa pine–western pine beetle–fungal symbiont system. Ancestors (black) were subdivided over time into geographically isolated populations. In isolation, strong antagonistic and mutualistic interactions occurred among partners and pushed species along unique evolutionary trajectories resulting in differentiated and unique tree–beetle–fungi systems (blue and green). An additional speciation event occurred in West basidiomycetes (light green and dark green). Levels of divergence among partners ultimately leads to heightened reproductive isolation because mismatched interspecific interactions break down the interaction network.

References

    1. Coyne JA, Orr HA. 2004. Speciation. Sunderland, MA: Sinauer Associates.
    1. Forister ML, Feldman CR. 2011. Phylogenetic cascades and the origins of tropical diversity. Biotropica 43, 270–278. ( 10.1111/j.1744-7429.2010.00702.x) - DOI
    1. Brodersen J, Post DM, Seehausen O. 2018. Upward adaptive radiation cascades: predator diversification induced by prey diversification. Trends Ecol. Evol. 33, 59–70. ( 10.1016/j.tree.2017.09.016) - DOI - PubMed
    1. Abrahamson WG, Blair CP. 2008. Sequential radiation through host-race formation: herbivore diversity leads to diversity in natural enemies. In Specialization, speciation, and radiation: the evolutionary biology of herbivorous insects (ed. Tilmon KJ.), pp. 182–202. Berkeley, CA: University of California Press.
    1. Emerson BC, Kolm N. 2005. Species diversity can drive speciation. Nature 434, 1015–1017. ( 10.1038/nature03450) - DOI - PubMed

Publication types

LinkOut - more resources