. 2018 Aug;560(7719):499-503.
doi: 10.1038/s41586-018-0343-4. Epub 2018 Jul 4.

Suppression of insulin feedback enhances the efficacy of PI3K inhibitors

Affiliations

Suppression of insulin feedback enhances the efficacy of PI3K inhibitors

Benjamin D Hopkins et al. Nature. 2018 Aug.

Erratum in

Abstract

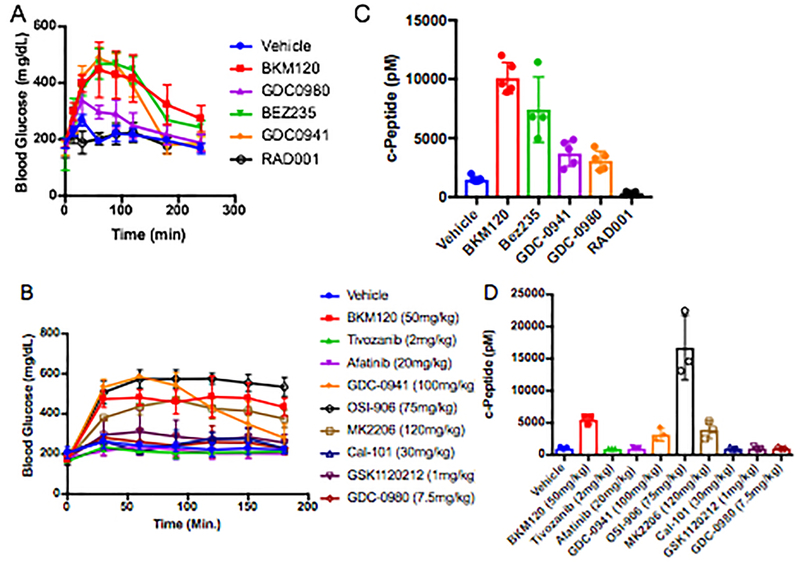
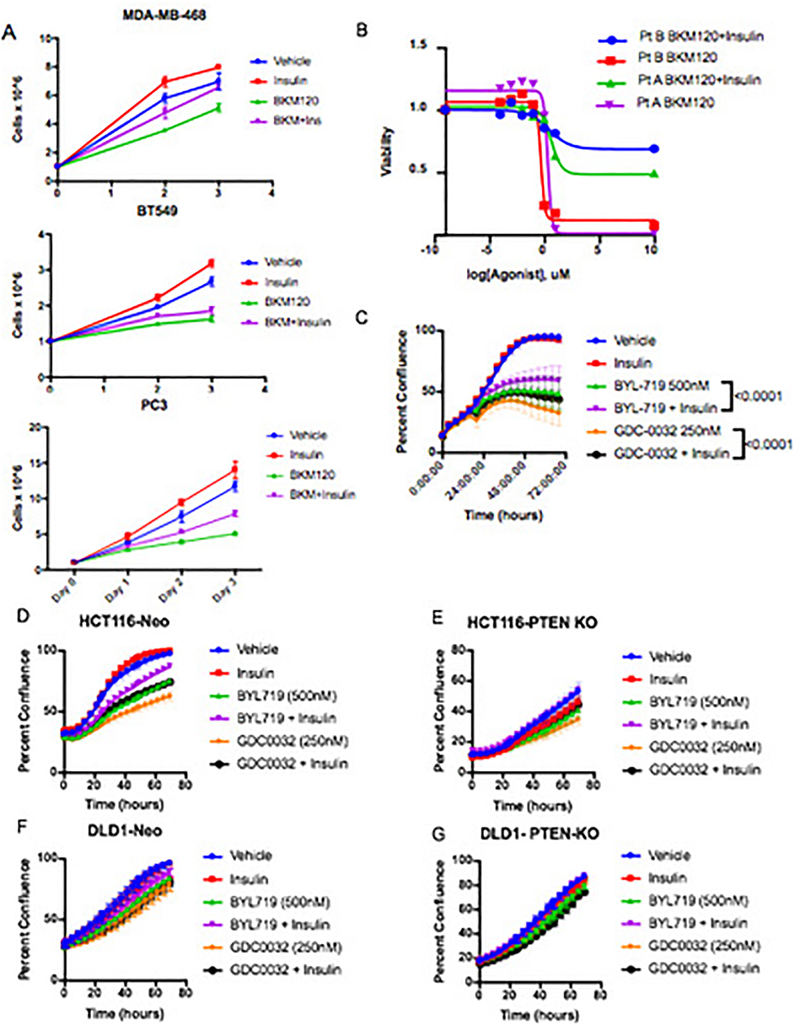
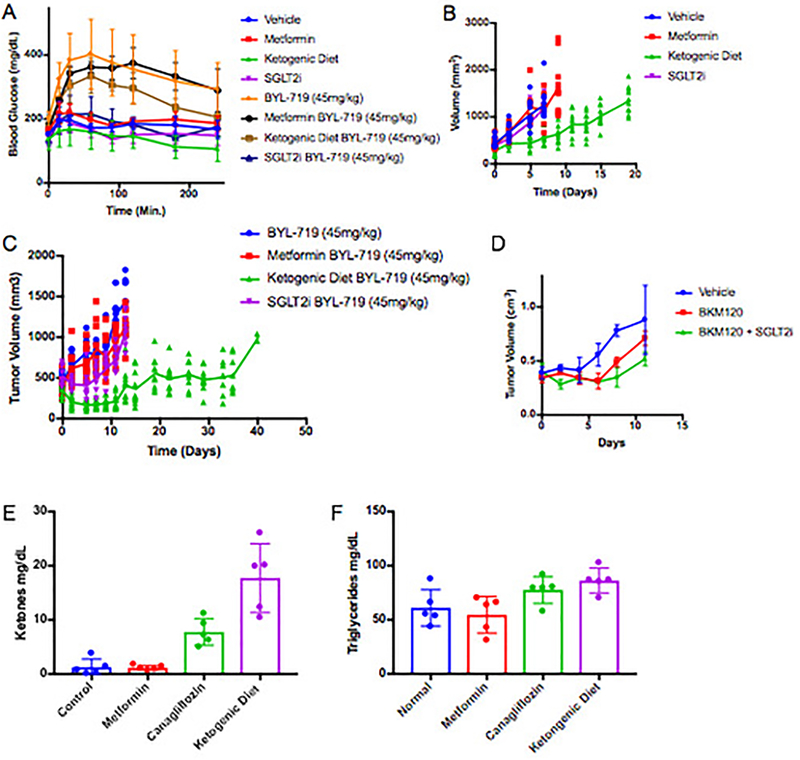
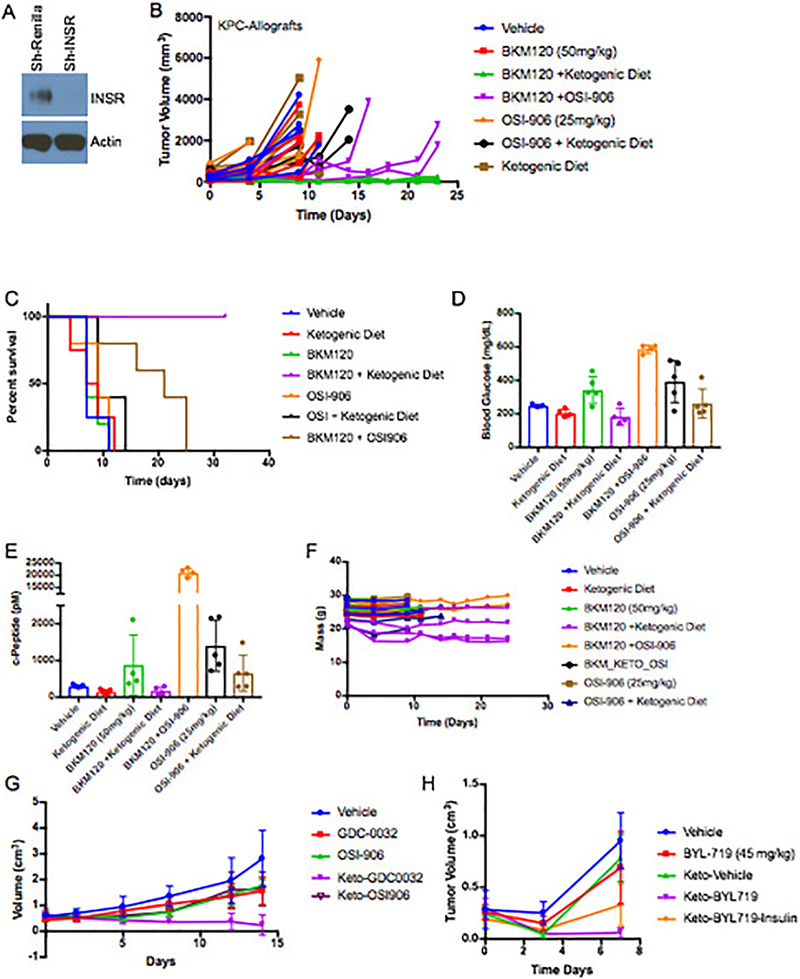
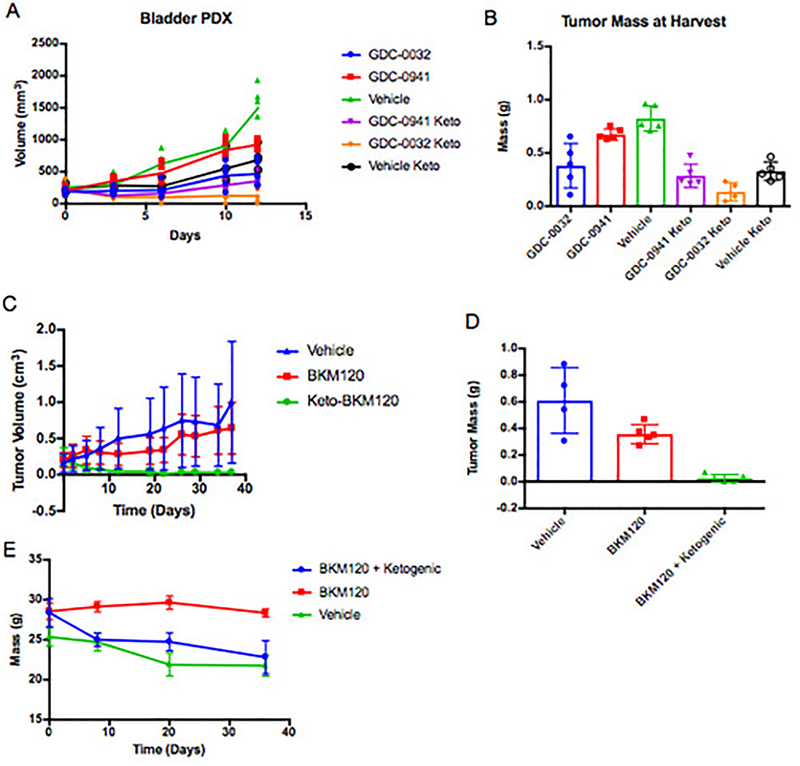
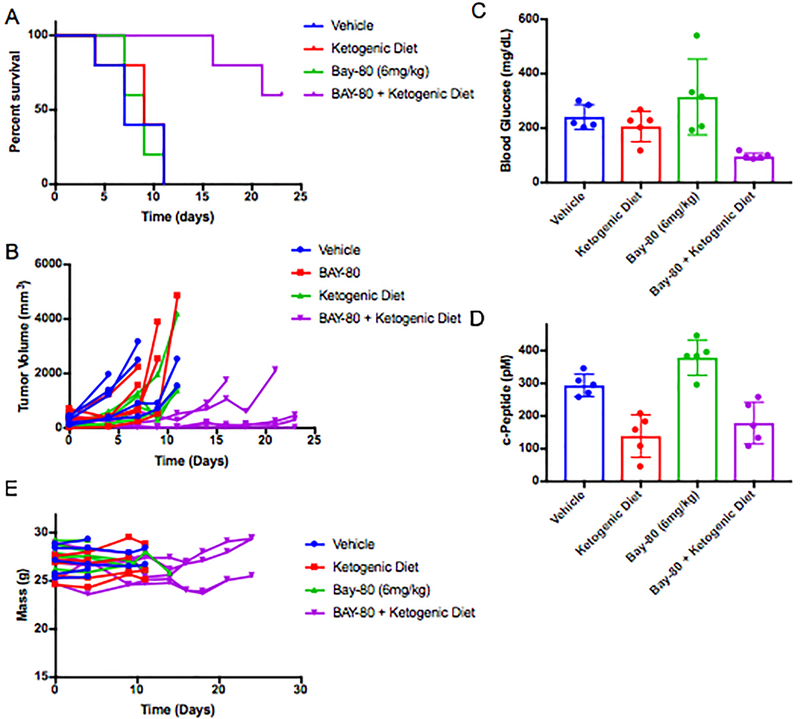
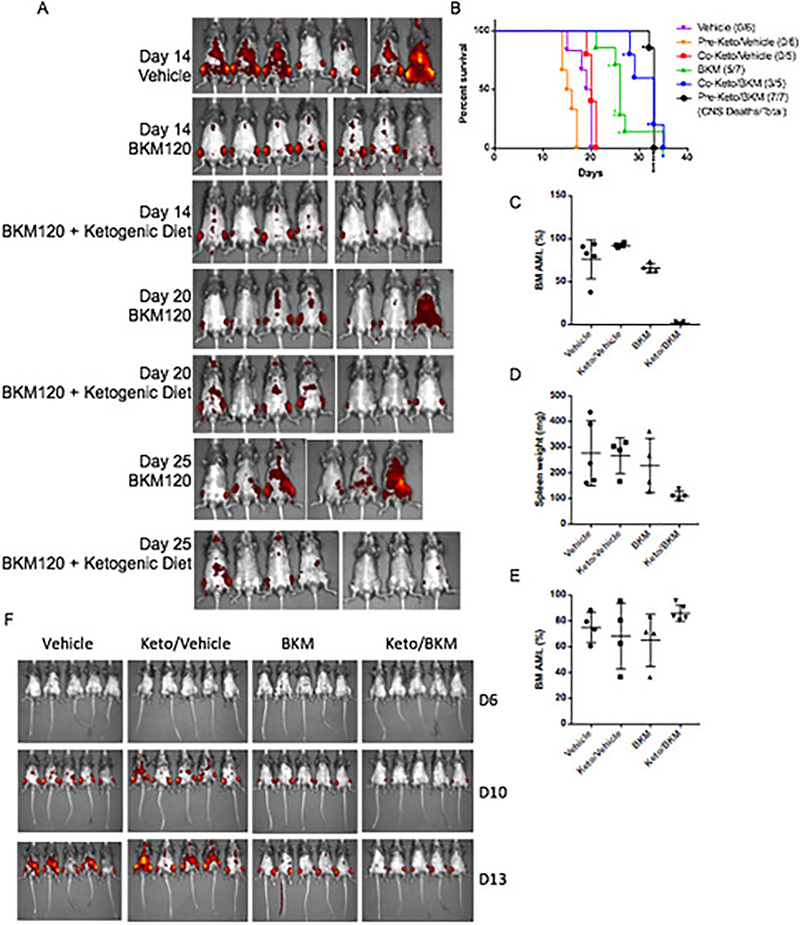
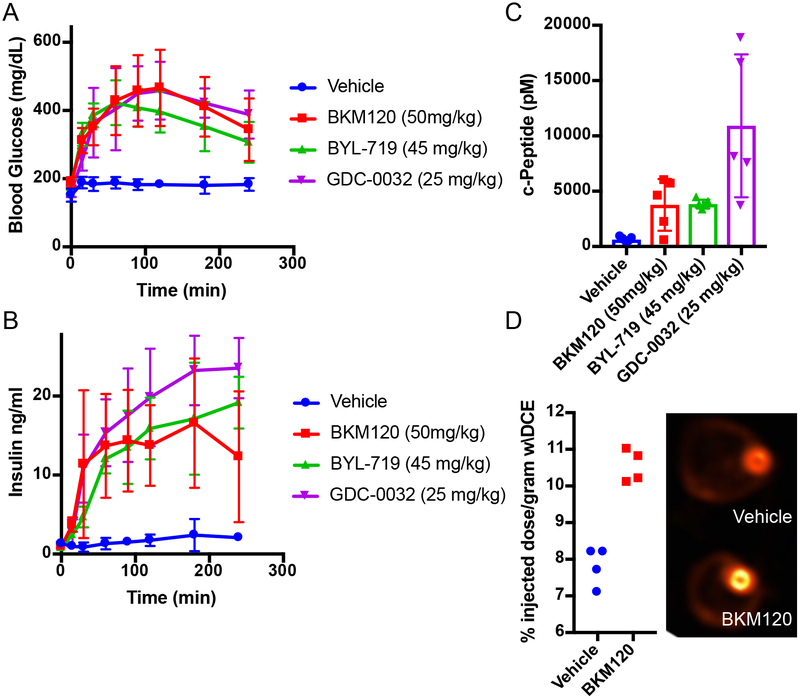
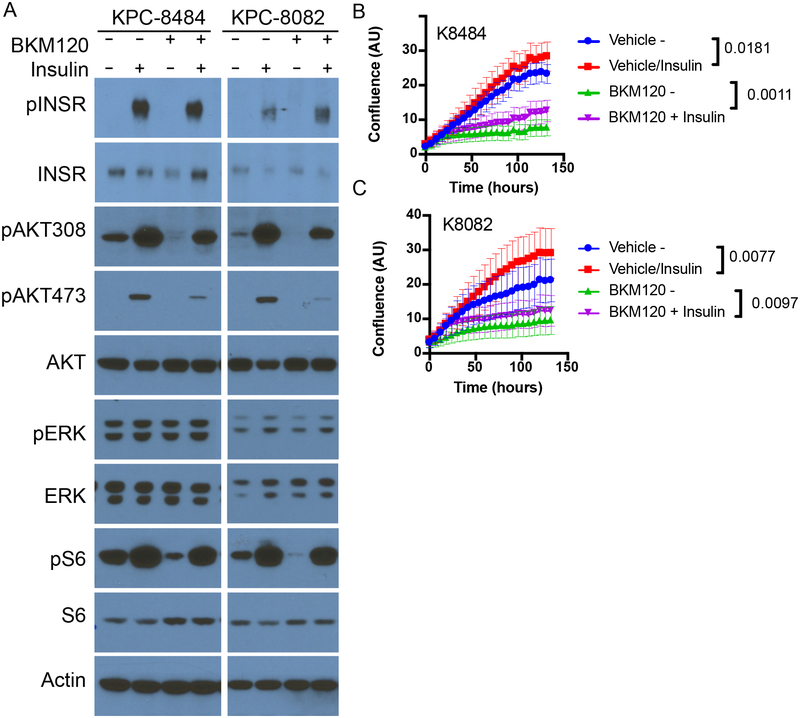
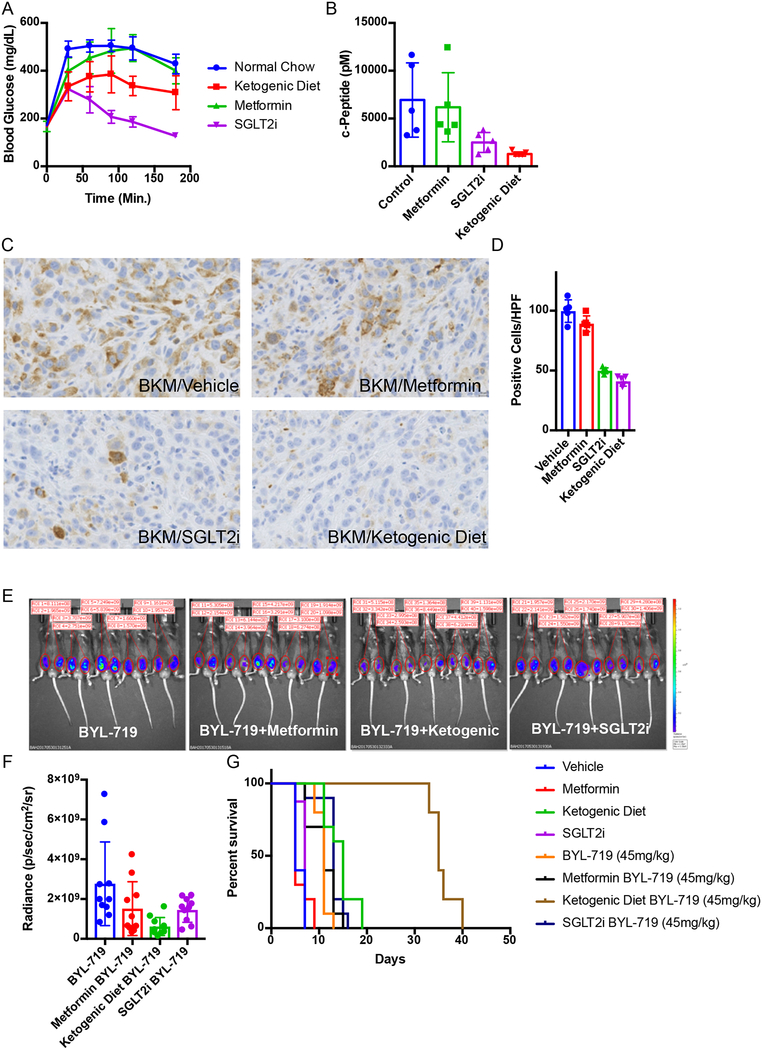
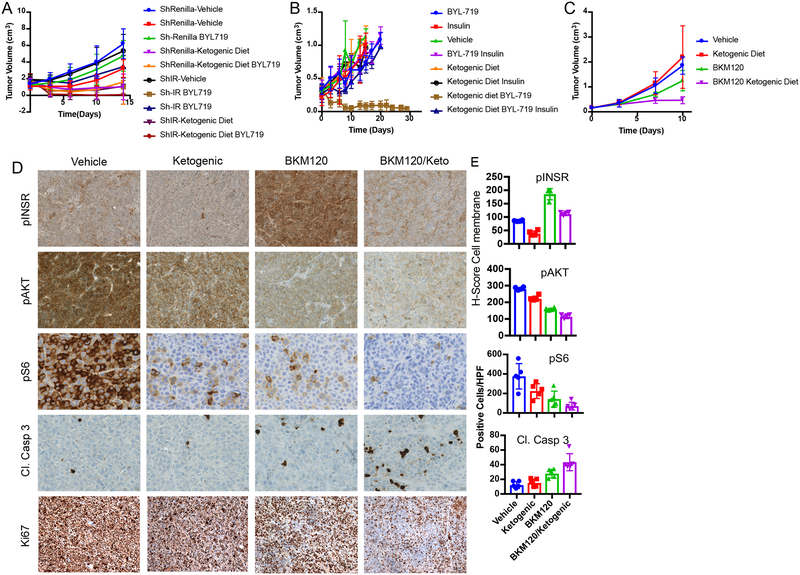
Mutations in PIK3CA, which encodes the p110α subunit of the insulin-activated phosphatidylinositol-3 kinase (PI3K), and loss of function mutations in PTEN, which encodes a phosphatase that degrades the phosphoinositide lipids generated by PI3K, are among the most frequent events in human cancers1,2. However, pharmacological inhibition of PI3K has resulted in variable clinical responses, raising the possibility of an inherent mechanism of resistance to treatment. As p110α mediates virtually all cellular responses to insulin, targeted inhibition of this enzyme disrupts glucose metabolism in multiple tissues. For example, blocking insulin signalling promotes glycogen breakdown in the liver and prevents glucose uptake in the skeletal muscle and adipose tissue, resulting in transient hyperglycaemia within a few hours of PI3K inhibition. The effect is usually transient because compensatory insulin release from the pancreas (insulin feedback) restores normal glucose homeostasis3. However, the hyperglycaemia may be exacerbated or prolonged in patients with any degree of insulin resistance and, in these cases, necessitates discontinuation of therapy3-6. We hypothesized that insulin feedback induced by PI3K inhibitors may reactivate the PI3K-mTOR signalling axis in tumours, thereby compromising treatment effectiveness7,8. Here we show, in several model tumours in mice, that systemic glucose-insulin feedback caused by targeted inhibition of this pathway is sufficient to activate PI3K signalling, even in the presence of PI3K inhibitors. This insulin feedback can be prevented using dietary or pharmaceutical approaches, which greatly enhance the efficacy/toxicity ratios of PI3K inhibitors. These findings have direct clinical implications for the multiple p110α inhibitors that are in clinical trials and provide a way to increase treatment efficacy for patients with many types of tumour.


Figures

EF1:
EF1:. Blood Glucose and C-Peptide levels after treatment with agents that target PI3K pathway.
(A-B) Mean values with standard deviation of blood glucose levels over time where time 0 is the time of treatment with the indicated inhibitor, N=5 and 3 per arm for A and B respectively. (C-D) Mean c-peptide levels with standard deviation from mice in A and B taken 240 and 180 minutes after treatment with indicated inhibitors. In C N =5 for the Vehicle, BKM120, GDC-0941, and GDC-0980 arms, N = 4 for the BEZ235 arm, and N = 3 for the RAD001. For D N=3 mice per arm. As a surrogate for total insulin release c-peptide levels in these animals, showing that the PI3K inhibitors and IGFR/INSR inhibitors dramatically increase insulin release in these animals. In all cases compounds that caused acute increases in blood glucose levels also increased serum insulin levels.
EF2:
EF2:. Impact of the feedback levels of insulin observed in figure 1 upon BKM120 efficacy in vitro.
(A) Proliferation in minimal growth media of cells whose growth is partially rescued by the addition of the observed feedback levels of insulin (10ng/ml) induced by BKM120 in mice. N=3 biologically independent samples per arm, graphed as mean number of cells with standard deviation. (B) Cell viability assay demonstrating the effects that these feedback levels of insulin have upon 2 patient (Pt)-derived organoid cultures (A and B) being treated in a dose response with BKM120 as measured by cell titer-glo at 96 hours. N = 3 biologically independent samples per treatment. (C) Proliferation in minimal growth media of murine TNBC cells treated with PI3K inhibitors partially rescued by the addition of the observed feedback levels of insulin induced by BKM120 in mice as observed in figure 1. N =6 biologically independent samples per treatment graphed as mean confluence with standard deviation. (D) Proliferation of HCT116-neo cells and (E) HCT116 PTEN knockout (KO) cells with and without treatment with the physiologically observed levels of insulin (10ng/ml) and treatment with clinically relevant PI3K inhibitors GDC-0032 and BYL-719. N = 4 biologically independent samples per treatment graphed as mean confluence with standard deviation. (F) Proliferation of DLD1-Neo and (G) DLD-1 PTEN Knockout cells under the same treatment conditions as in F and G. Of note, the loss of PTEN in these isogenic sets of colon cancer lines does not uniformly alter the response to insulin in the setting of PI3K inhibition. In the context of PTEN loss, physiologic levels of insulin can restore normal proliferation in HCT116s despite the presence of PI3K inhibitors. N = 4 biologically independent samples per treatment graphed as mean confluence with standard deviation.
EF3:
EF3:. KPC K8484 Allografts treated with PI3K inhibitors with or without supplemental approaches to target systemic insulin feedback.
(A) Mean Blood glucose levels with standard deviation of mice from figure 3E–G treated with control diet, ketogenic diet, metformin (250mg/kg), or canagliflozin (SGLT2i)(6mg/kg), after the first dose of BYL-719 (45mg/kg). N=5 animals per arm. (B)Tumor volumes of the metabolic modifying agents as shown in figure 3 without PI3K inhibitors. N = 10 tumors per arm in Vehicle, Metformin, and Ketogenic Diet Arms, N = 8 tumors per arm in the SGLT2i arm. (C) Mean tumor volume (lines) with scatter (points) for each of these treatment cohorts. N = 10 tumors per arm in BYL-719, BYL-719 + Metformin, and BYL-719 + Ketogenic Diet Arms, N = 9 tumors in the BYL-719 + SGLT2i arm. (D) Mean tumor volumes with standard deviation from an independent experiment of mice (N = 4 mice/arm) treated daily with BKM120 with or without 6mg/kg of Canagliflozin administered 60 minutes prior to the PI3K treatment so that peak SGLT2 inhibition is aligned with peak blood glucose levels post PI3K inhibitor treatment. (E) Blood ketone and (F) Mean triglyceride levels with standard deviation as determined by Calorimetric assay of mice shown in figure 3A–D after a single treatment with BKM120 with or without pretreatment with metformin, Canagliflozin, or the ketogenic diet as indicated, N = 5 mice per arm.
EF4:
EF4:. Role of inhibiting insulin receptor in the observed changes in tumor response.
(A) Western blot of cell lysates from K8484 cells used to generate xenografts in figure 4A after 36 treatment with doxycycline to induce the sh-Renilla and sh-IR hairpins as indicated. Similar results were observed in two independent experiments. (B) Tumor volumes of the individual mice allografted with KPC-K8484 tumors as measured by caliper over time. N = 4,5,4,4,5,5 and 5 for Vehicle, BKM120, BKM120 + Ketogenic Diet, ,BKM120 + OSI-906, OSI-906,OSI-906 + Ketogenic Diet, and Ketogenic diet arms respectively. (C) Survival curve of mice in B. (D)Mean blood glucose and (E) c-peptide levels shown with standard deviation from these mice 240 minutes after respective treatments. * two of the glucose measurements in the OSI-906 and BKM120 were beyond the range of the detector (e.g. >600). (F) The mass of the individual mice over the course of the treatments. As has been previously published mice lose 10–20% of their mass upon initiation of the ketogenic diet. (G) Similar to the data for the tumors in A treatment efficacy with both OSI-906, a INSR/IGFR inhibitor and GDC-0032 treatment efficacy was significantly improved in PIK3CA + MYC mutant murine breast tumor allografts, ES-278, grown in wild-type c57/bl6 when combined with ketogenic diet. N = 5 tumors per arm. Points depict mean tumor volume with standard deviation. (H) Mean tumor volumes with standard deviation of wildtype c57/bl6 mice baring KPC allografted tumors as measured by caliper over time. Mice were treated as indicated with combinations of BYL-719, the ketogenic diet, or insulin as in figure 4B. Mice in the ketogenic-BYL719-insulin cohort lost >20% of their body mass over the 1 week of treatment so the experiment was terminated at day 7. N = 6,4,4,6,6 for Vehicle, BYL-719, Ketogenic Diet, BYL-719 + Ketogenic Diet, and BYL-719 + Ketogenic Diet + Insulin respectively.
EF5:
EF5:. Impact of PI3K inhibitor treatments upon Patient derived xenograft model of bladder cancer and syngeneic allograft models PIK3CA mutant breast cancer.
(A) Graph of tumor growth over-time of a PDX derived from a patient with bladder cancer (Patient C) treated with the pan PI3K inhibitor GDC-0941 or the β sparing GDC-0032 alone or with a ketogenic diet. Lines indicate mean tumor volume of each treatment group, points indicate individual tumor volumes over time. N= 5 tumors per arm. (B) Graph of the mass of these tumors taken at the time harvest on day 12. (C) Mean tumor growth over time with standard deviation and (D) tumor mass at harvest from mice with orthotopic allografts of an PIK3CA (H1047R) mutant murine breast cancer, ES272, treated as indicated with BKM120 alone or in combination with a ketogenic diet. N = 4,5,5 tumors per arm for the Vehicle, BKM120 and BKM120 + Ketogenic Diet arms respectively. (E) Mean mass with standard deviation of these mice over time.
EF6:
EF6:. Impact of Copanilisib with or without ketogenic diet upon growth of KPC tumor model K8082 grown in the flank of wildtype c57/bl6 mice.
(A) Survival curves for mice with KPC K8082 allografts grown in the flank and treated as indicated with BAY 80–6946 alone and in combination with pretreatment with a ketogenic diet as indicated (p-value comparing BAY 80–6946 to the combination of BAY 80–6946 with ketogenic diet in this study is 0.0019 by Mantel-Cox Log-rank test). N= 5 mice/arm in the Vehicle, Bay 80–6946, and Bay 80–6946 + Ketogenic Diet arms, and N = 4 in the ketogenic diet alone arm. (B) Curves of the volume each tumor in this cohort graphed as individual lines. (C) Mean blood glucose and (D) c-peptide measurements with standard deviation taken from the animals in B-C 240 min after treatment. (F) Graph of the mass of these animals over time on treatment. Tumors were allowed to grow until their diameters were >0.6cm prior to the initiation of treatment.
EF7:
EF7:. Impact of BKM120/Ketogenic combination on a syngeneic model of AML
(A) IVIS images of AML burden (as reported by DS-red) in these mice from these studies over time. The group of BKM plus keto diet were pre-treated with keto diet. N = 7 mice per arm. (B) Survival curves of mice from A with additional mice to evaluate pre-treatment vs co-treatment with the ketogenic diet in the syngeneic model of AML treated with BKM120 alone or in combination with a ketogenic diet. Individual lines are shown for initiation of ketogenic diet before (pre) or at the same time as the initiation of BKM120 treatment (Co), both demonstrate that BKM120 efficacy is significantly enhanced by the addition of the ketogenic diet (p = 0.0142 and 0.0316 by Gehan-Breslow Wilcoxon test for pre and co compared to BKM alone respectively). * denote mice that were sacrificed due to paralysis resulting from AML infiltrating the CNS rather than deaths typically seen in these mice due to tumor burden. Of note the mice in the BKM + Ketogenic diet group were frequently sacrificed due to paralysis which was not frequently a cause of mortality in the other treatment groups. N = 6,6,5,7,5,7 mice per arm for Vehicle, Pre-Ketogenic diet, Co-Ketogenic Diet, BKM120, Co-ketogenic Diet + BKM120, and Pre-Ketogenic diet + BKM120 arms respectively. (C) Disease burden of AML as measured by percent DS-red positive AML cells in bone marrow and (D) spleen weight across the treatment groups (pre-treatment with keto diet). Data are mean ± s.d. N = 5,4,4,4 mice per arm for Vehicle, Pre-Ketogenic diet, BKM120, and Pre-Ketogenic diet + BKM120 arms respectively (E) Measurement of AML burden in mice that were pretreated with BKM120 and/or a ketogenic diet to demonstrate that the effects observed in the AML studies are not the result of implantation issues related to the pretreatment. Data are mean ± s.d. N = 4,4,4,5 mice per arm for Vehicle, Pre-Ketogenic diet, BKM120, and Pre-Ketogenic diet + BKM120 arms respectively. (F) Images of mice treated as indicated with BKM120 and ketogenic diet where the diet and BKM120 therapy were initiated on the same day (co-treatment). N = 5 mice per arm.
Figure 1:
Figure 1:. Treatment with PI3K inhibitors causes systemic feedback resulting in increases in blood glucose and insulin.
(A) Mean Blood glucose and (B) insulin levels with standard deviation in mice treated with the indicated PI3K inhibitor compounds (N=5/arm, p-value <0.0001 by Two-Way ANOVA for all curves as compared to vehicle). (C) Mean with standard deviation of c-Peptide levels assessed at 240 min (p-values comparing vehicle treatment to BKM120, BYL-719, and GDC-0032 by two sided t-test were 0.017, <0.0001, and 0.007 respectively). (D) Mean percent of FDG-PET signal with standard deviation of orthotopically implanted KPC tumors imaged 90 minutes after a single treatment with BKM120 (N=4/arm, p-value =0.0002, by two sided t-test).
Figure 2:
Figure 2:. Impact of feedback levels of insulin on cellular proliferation, signaling and survival.
(A) Western blot analysis of KPC cell lines K8484 and K8082 treated with or without PI3K inhibitor BKM120 (1uM) in the presence or absence of physiologic feedback levels of insulin (10ng/ml). Similar results were observed in three independent experiments. (B-C) Mean confluence with standard deviation of KPC cell lines K8484 and K8082 over time grown in the presence or absence of insulin (10ng/ml) and BKM120 (1uM). p-values determined by ANOVA comparing conditions +/− insulin are shown, N=16 biologically independent samples per group.
Figure 3:
Figure 3:. Targeting the PI3K inhibitor induced glucose/insulin feedback in vivo.
(A) Mean Blood glucose levels with standard deviation over time of wildtype c57/bl6 mice baring syngeneic K8484 KPC allografted tumors after treatment with a single dose of BKM120 in mice pretreated with metformin, SGLT2-inhibitor (SGLT2i), or a ketogenic diet (N = 5 mice). p-values calculated by Two-way repeated measures ANOVA for metformin, SGLT2i, and the ketogenic diet were 0.2136 (not significant), <0.0001, and 0.007 respectively. (B) Mean Blood levels of c-peptide with standard deviation of the same mice (N=5) taken 180 minutes after treatment with BKM120. p-values calculated by unpaired two sided t-test for metformin, SGLT2i, and ketogenic diet were 0.7566 (not significant), 0.0386, and 0.0117 respectively. (C) Immunohistochemical images for pS6 (ser-235) to observe the level of active PI3K signaling in these tumors. (D) Quantification of this staining is shown as mean number of positive cells per high power field with standard deviation (N = 5 mice/group). p-values comparing pS6 positive cells in BKM120 alone treated tumors as compared to those treated with BKM120 in combination with metformin, SGLT2i, or the ketogenic diet using two sided t-tests were 0.6186, <0.0001, and <0.0001 respectively. (E) IVIS images of luciferase reporter luminescence in mice with KPC K8484 tumors after 12 days of treatment with PI3Kα specific inhibitor BYL-719 alone or in combination with metformin, ketogenic diet, or SGLT2i (N=10 tumors/arm). (F) Mean values and standard deviation of quantification of luminescence from images in of these tumors. (G) Survival analysis of these animals, p-value = 0.0019 and 0.0001 respectively as determined by Log-rank (Mantel-Cox) test.
Figure 4:
Figure 4:. Impact of circumventing the on target glucose/insulin feedback of PI3K inhibitors upon tumor growth.
(A) Graph of mean tumor volumes with standard deviation of K8484 KPC with doxycycline inducible hairpins targeting Renilla (ShRenilla) or Insulin Receptor (ShIR), treated with doxycycline and as indicated with the PI3K inhibitor BYL-719 and/or co-administration of a ketogenic diet (N=8, 9, 8, 10, for shRenilla tumors treated with vehicle, BYL719, Ketogenic diet, and BYL + Ketogenic diet respectively, and N= 8,8,10,8 for shIR tumors treated with vehicle, BYL719, Ketogenic diet, and BYL + Ketogenic diet respectively. (B) Graph of mean ES272 Pik3ca mutant breast cancer allograft tumor volumes with standard deviation treated with BYL-719 and/or insulin along with the ketogenic (keto) as indicated. N=3,3,5,5,5,3,4,4 for Vehicle, Insuln, BYL, BYL+Insulin, Ketogeinic Diet, Ketogenic+Insulin, Ketogenic+BYL, and Ketogenic+BYL+Insulin respectively. (C) Graph of mean tumor volume with standard deviation of patient derived endometrial xenografts (PDX) treated with BKM120 and/or a ketogenic diet (N=5/arm, (p-value = 0.0028 by ANOVA comparison between the BKM120 alone and BKM120 plus ketogenic diet treated mice). (D-E) Histology and quantification of phospho-Insulin Receptor (pINSR), phospho-AKT (pAKT), phospho-S6 (pS6), cleaved caspase 3 (Cl. Casp 3), and ki67 of the tumors from D taken 4 hours after the last treatment with Vehicle, ketogenic diet, BKM120, or the combination of the ketogenic diet with BKM120 (BKM120/Keto). Quantification is depicted as score per high powered field, 4 images were taken for each of the five mice N=5. p-values from two sided t-tests comparing the blinded scoring in BKM120 treated tumors as compared to those treated with BKM120 with the ketogenic diet were 0.005, 0.005, 0.017 and 0.028 and for pINSR, pAKT, pS6 and Cl. Casp 3 respectively.

Comment in

References

    1. Kandoth C et al. Mutational landscape and significance across 12 major cancer types. Nature 502, 333–339, doi: 10.1038/nature12634 (2013). - DOI - PMC - PubMed
    1. Millis SZ, Ikeda S, Reddy S, Gatalica Z & Kurzrock R Landscape of Phosphatidylinositol-3-Kinase Pathway Alterations Across 19784 Diverse Solid Tumors. JAMA Oncol 2, 1565–1573, doi: 10.1001/jamaoncol.2016.0891 (2016). - DOI - PubMed
    1. Bendell JC et al. Phase I, dose-escalation study of BKM120, an oral pan-Class I PI3K inhibitor, in patients with advanced solid tumors. J Clin Oncol 30, 282–290, doi: 10.1200/JCO.2011.36.1360 (2012). - DOI - PubMed
    1. Juric D et al. Phase I Dose-Escalation Study of Taselisib, an Oral PI3K Inhibitor, in Patients with Advanced Solid Tumors. Cancer Discov 7, 704–715, doi: 10.1158/2159-8290.CD-16-1080 (2017). - DOI - PMC - PubMed
    1. Patnaik A et al. First-in-human phase I study of copanlisib (BAY 80–6946), an intravenous pan-class I phosphatidylinositol 3-kinase inhibitor, in patients with advanced solid tumors and non-Hodgkin’s lymphomas. Ann Oncol 27, 1928–1940, doi: 10.1093/annonc/mdw282 (2016). - DOI - PMC - PubMed

Publication types

MeSH terms