Review
. 2018 Aug 22;118(16):7409-7531.
doi: 10.1021/acs.chemrev.7b00678. Epub 2018 Jul 27.

Intracellular Delivery by Membrane Disruption: Mechanisms, Strategies, and Concepts

Affiliations
Review

Intracellular Delivery by Membrane Disruption: Mechanisms, Strategies, and Concepts

Martin P Stewart et al. Chem Rev. .

Abstract

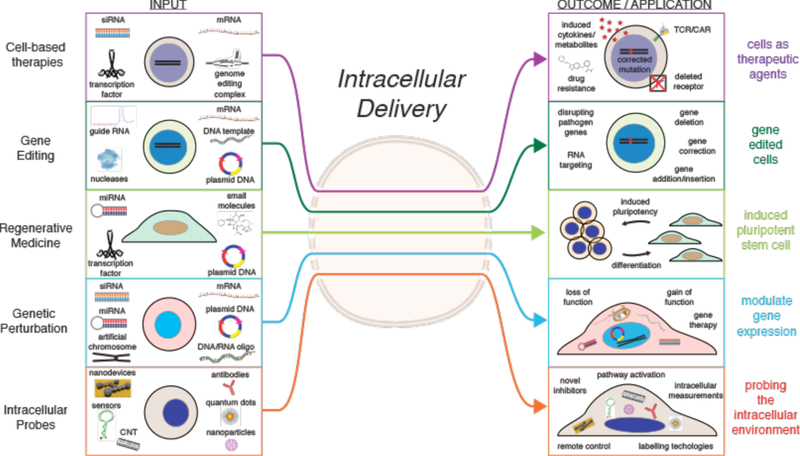
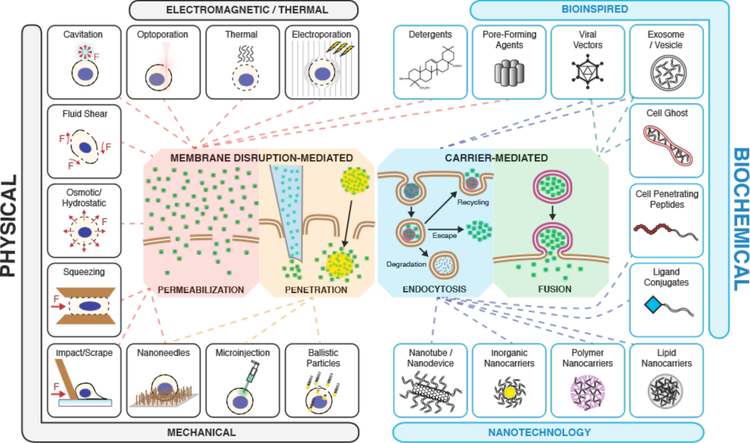
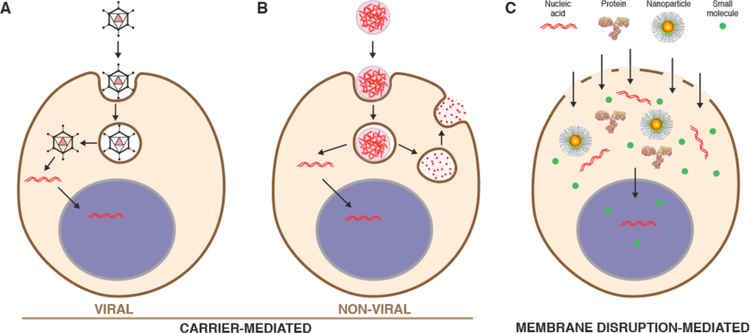
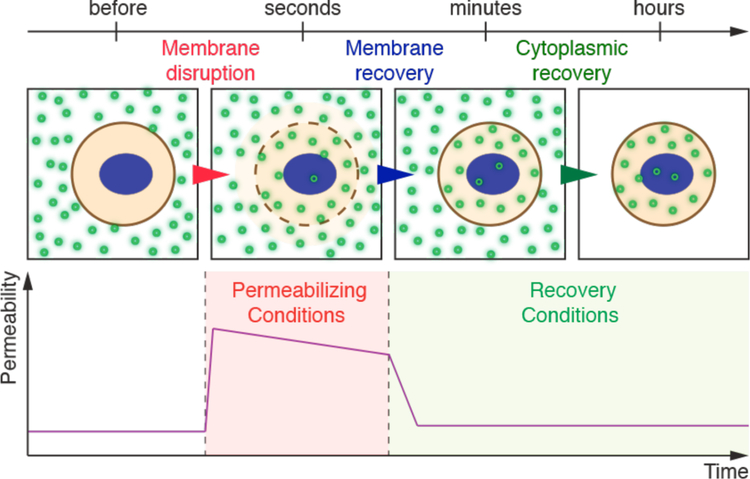
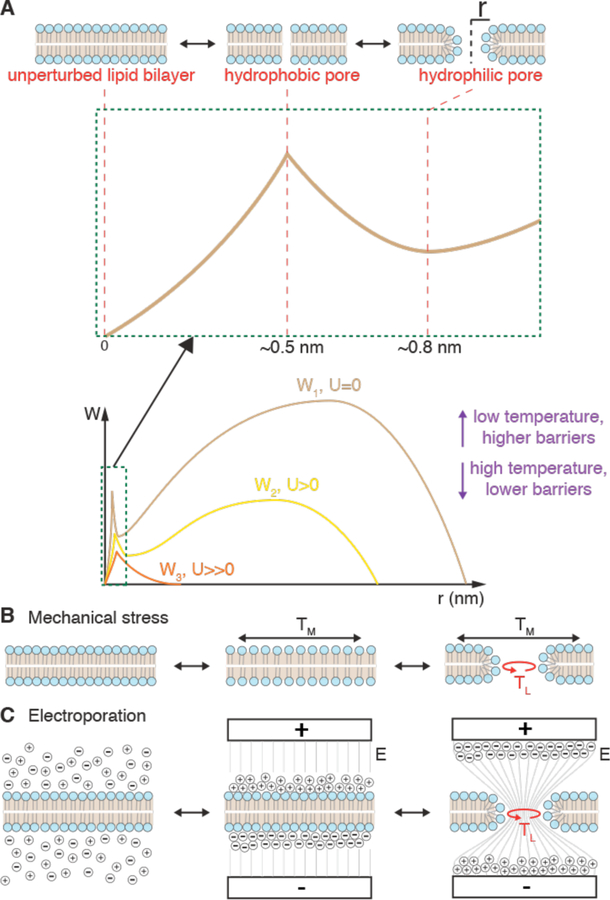
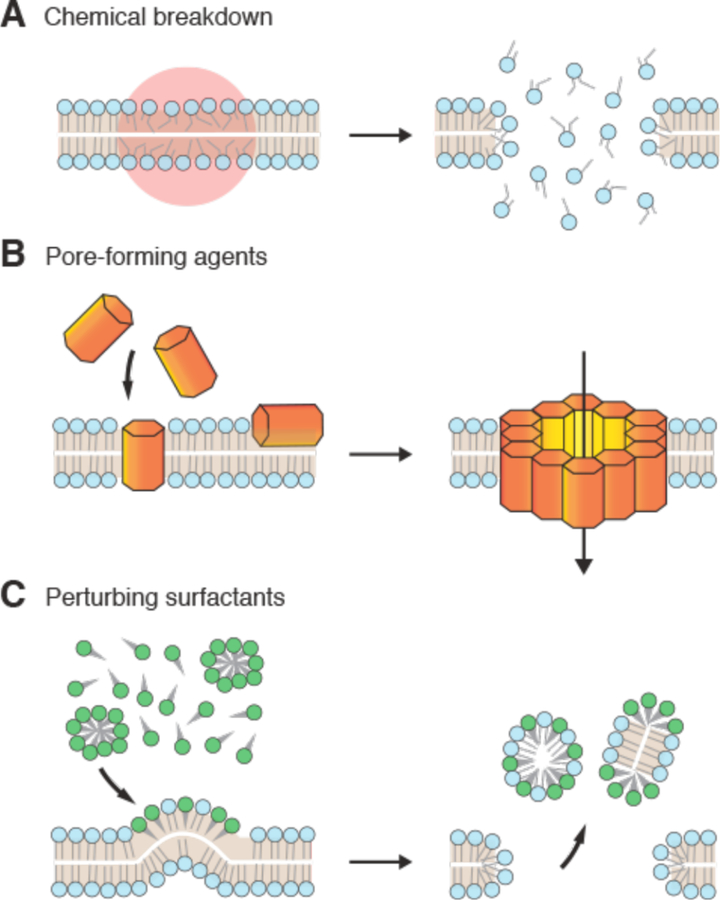
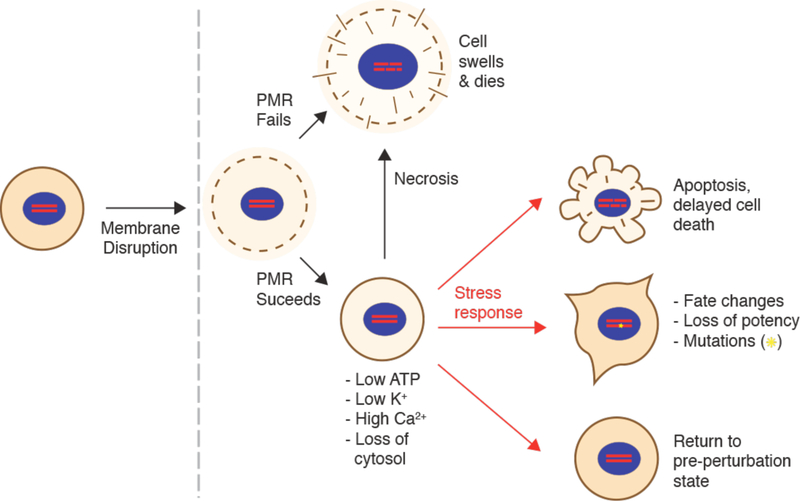
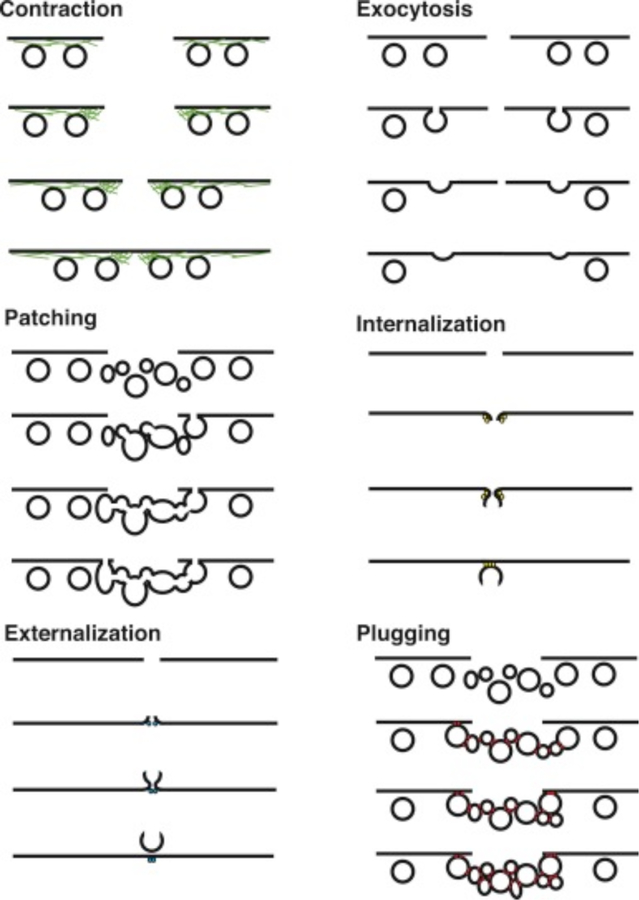
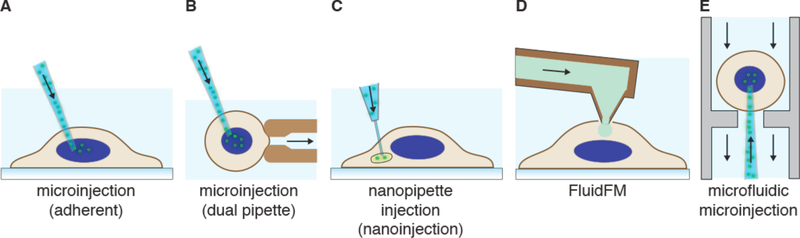
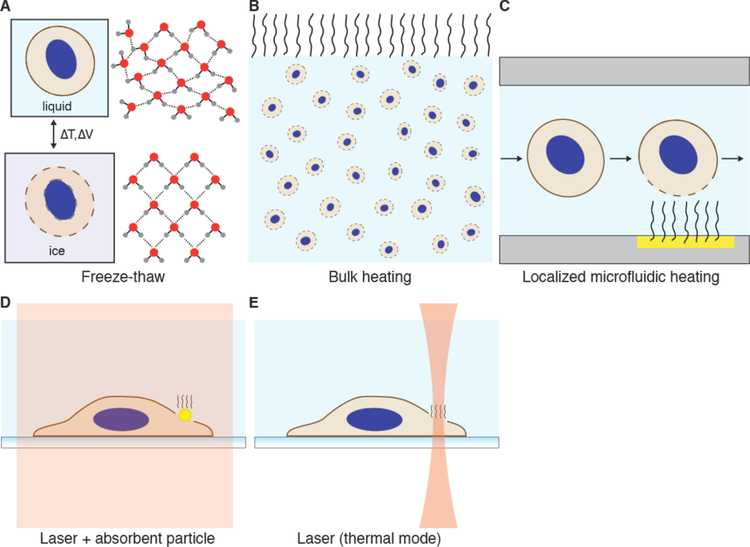
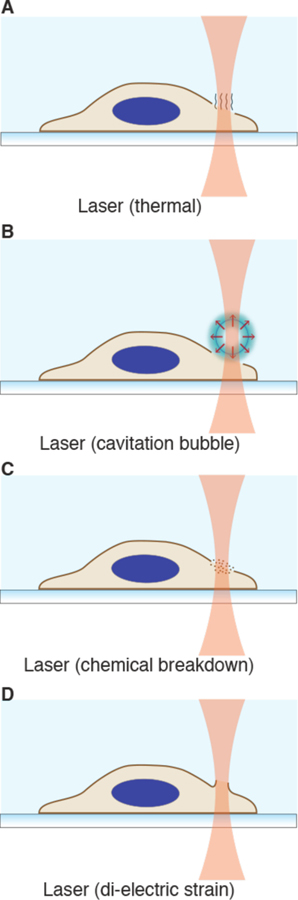
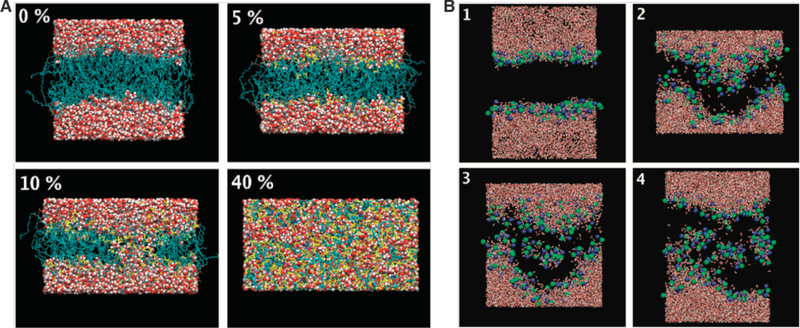
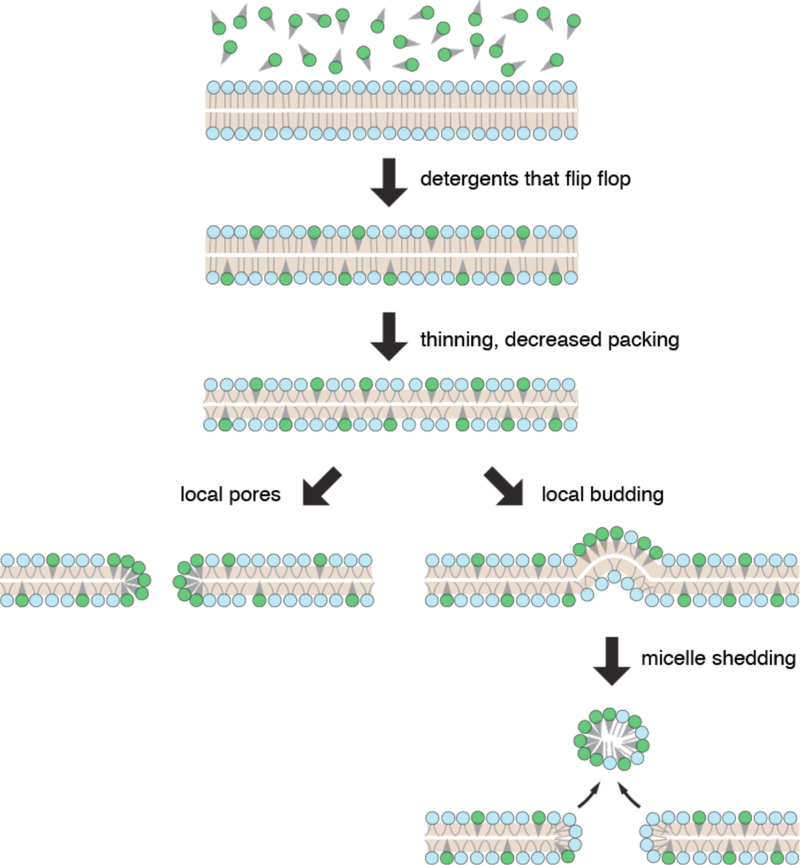
Intracellular delivery is a key step in biological research and has enabled decades of biomedical discoveries. It is also becoming increasingly important in industrial and medical applications ranging from biomanufacture to cell-based therapies. Here, we review techniques for membrane disruption-based intracellular delivery from 1911 until the present. These methods achieve rapid, direct, and universal delivery of almost any cargo molecule or material that can be dispersed in solution. We start by covering the motivations for intracellular delivery and the challenges associated with the different cargo types-small molecules, proteins/peptides, nucleic acids, synthetic nanomaterials, and large cargo. The review then presents a broad comparison of delivery strategies followed by an analysis of membrane disruption mechanisms and the biology of the cell response. We cover mechanical, electrical, thermal, optical, and chemical strategies of membrane disruption with a particular emphasis on their applications and challenges to implementation. Throughout, we highlight specific mechanisms of membrane disruption and suggest areas in need of further experimentation. We hope the concepts discussed in our review inspire scientists and engineers with further ideas to improve intracellular delivery.


Figures

Figure 1.
Figure 1.
Example motivations for intracellular delivery. Cells and example cargo are shown on the left. Through intracellular delivery these molecules and materials are able to confer the outcome or application depicted on the right. The horizontal tiers are not mutually exclusive and substantial overlap exists the different groups. Abbreviations: TCR = T cell receptor. CAR = chimeric antigen receptor. CNT = carbon nanotube.
Figure 2.
Figure 2.
Size scale of cargoes of interest for intracellular delivery. The top left quadrant represents 5 nm. The top right quadrant represents 50 nm, including a pink box showing the scale of the 5 nm quadrant. The bottom right quadrant represents 500 nm, including a green box showing the scale of the 50 nm quadrant. The bottom left quadrant represents 5 μm, including a blue box showing the scale of the 500 nm quadrant. The properties of each of the cargoes and their applications are discussed throughout chapter 2. PBFI is a potassium indicator. ASO: antisense oligonucleotide. siRNA: small interfering RNA. miRNA: micro RNA. GFP: green fluorescent protein. RNP: ribonucleoproteins. TALEN: Transcription activator-like effector nuclease. ZFN: zinc finger nuclease. The pressure sensor is actually 6 μm long but here scaled to half size for presentation purposes.
Figure 3.
Figure 3.
Concept map displaying the main applications areas of transfection. In terms of market share and research, medical, and industrial activity, transfection is the largest sub-component of intracellular delivery.
Figure 4.
Figure 4.
A map of intracellular delivery methods and their mechanisms. Current intracellular delivery methods are shown sorted within the four indicated mechanisms: permeabilization, penetration, endocytosis, and fusion. Methods that overlap on more than one mechanism may promote intracellular delivery via multiple mechanisms depending on the context. For example, most viral vectors are believed to go through endocytosis but some fuse directly with the plasma membrane.
Figure 5.
Figure 5.
Cargo delivery trajectories for the main intracellular delivery categories. (A) Viral vectors only deliver nucleic acids but do so very efficiently (endocytosis example). (B) Most non-viral carriers are optimized for nucleic acid delivery although some adaptations can carry other materials. Non-viral carriers are endocytosed into the cell with small amounts of nucleic acid breaking out into the cytoplasm while the majority are degraded in lysosomes or recycled back out to the extracellular space. (C) Membrane disruption is able to deliver any cargo that can be dispersed in solution provided it is small enough to fit through transient openings in the plasma membrane. Nucleus is depicted in purple.
Figure 6.
Figure 6.
Key events associated with permeabilized-based intracellular delivery. Acute membrane disruption triggers an increase in permeability to the cargo of interest (green). Cargo then begins to diffuse into the cell according to its concentration gradient while some cytoplasmic materials are lost (orange). Within seconds of membrane disruption, the cell responds with membrane active repair processes that can take tens of seconds up to minutes to complete. Once membrane integrity is restored, the cell engages metabolic and transport processes to restore cytoplasmic composition. It may take hours for the cell to fully return to the pre-perturbation state.
Figure 7.
Figure 7.
Structure and properties of the cell interior and surface. (A) Overview of typical animal cell structure with basic organelles, intra-and extracellular ion concentrations, and negative membrane potential (ΔV). ER: endoplasmic reticulum. (B) Features of the plasma membrane including lipid asymmetry across bilayer leaflets and lateral segregation into domains, such as raft phases. Abbreviations are phosphatidylcholine (PtdCho), phosphatvidylethanolamine (PtdEtn), phosphatidylserine (PtdSer), and phosphatidylinositol (PtdIns), sphingomyelin (SM), glycosphingolipids (GSL). Carbohydrate residues depicted in black, cholesterol in purple. Note the highly regulated heterogeneous distribution of molecules between different types of membranes and leaflets. As a result, the ER membrane is thinner and sparser than plasma membrane, with more unsaturated lipid tails. (C) Plasma membrane reservoirs and their relationship with the underlying actin cortex. Actin rods support filopodia and microvilli. Blebs are typically devoid of actin until they are pulled back in. The actin cytoskeleton accommodates formation and stabilization of endocytic pits.
Figure 8.
Figure 8.
Theory of mechanical and electrical disruption of lipid bilayers according to energy landscape of defect formation. (A) Energy landscape according to hydrophilic pore theory. Energy is required to open up hydrophobic defects with radius ~0.5 nm. Further growth to a hydrophilic, toroidal pore with lipid head groups facing inward is associated with a local energy minimum at pore radius ~0.8 nm. W1 represents the energy landscape at rest with no external mechanical or electrical input, W2 (yellow) represents an intermediate mechanical of electrical stress, while W3 (orange) indicates the effect of a large mechanical or electrical potential. Low temperature is synonymous with increased barrier heights while high temperature favors membrane destabilization. (B) Illustration of pore formation due to mechanical stress where the membrane is first stretched before pore formation. The applied in plane tension (TM) and the line tension (TL) within a lipid pore are diametrically opposed. (C) Illustration of pore formation due to application of electrical potential normal to membrane where E is the electric field strength and TL = line tension within a hydrophilic pore. Hydrophilic pores are conducting, thus leading to relaxation of charge buildup and a reduction of entropy in the system.
Figure 9.
Figure 9.
Chemical approaches for generating disruptions in lipid bilayers. (A) Chemical breakdown within a local region (red circle) can lead to disintegration of membrane integrity via breaking of bonds or distortion caused by unsaturation of lipid tails. (B) Pore-forming agents can interact with a membrane to assemble an oligomeric pore. (C) Perturbing surfactants (such as detergents) can embed into the bilayer and induce curvatures that distort the membrane and lead to loss of bilayer structure and pore formation.
Figure 10.
Figure 10.
Cell response to membrane disruption. First, plasma membrane repair (PMR) engages within seconds to minutes to rescue the cell. If PMR fails the cell depolarizes, swells, and dies. Shown are the altered cytoplasmic contents that eventuate if membrane disruption is conducted in a physiological buffer. If PMR is successful, the cell is left in a perturbed state with loss of cytosol. Stress response guides the cell to return to the pre-perturbation homeostatic state or into apoptosis. In some cases trauma or off-target damage involved with disruption recovery cycle may cause mutations, fate changes, or loss of cell potency.
Figure 11.
Figure 11.
Proposed mechanisms of membrane resealing. In each case, the black line with gap represents the plasma membrane with a wound-induced hole and healing progresses from top to bottom. Black circles represent vesicles in the cell. Green lines in “Contraction” represent cortical cytoskeleton; yellow dots in “Internalization” represent machinery powering endocytic invagination and pinching; blue dots in “Externalization” represent ESCRT machinery powering scission; red dots in “Plugging” represent proteins crosslinking membranous compartments. Figure taken from Moe et al..
Figure 12.
Figure 12.
Intracellular delivery via microinjection. (A) Depiction of an adherent cell being microinjected with a glass micropipette. (B) Microinjection of a suspended cell that is held in place by a secondary holding pipette. (C) Nanopipette injection (nanoinjection) where the penetrating aperture consists of a nanotube. In this illustration an intracellular organelle is being injected. (D) Use of a hollow AFM cantilever to inject cells (FluidFM) (E) Microfluidic microinjection where a cell is pushed onto a sharp micropipette via flow. Pressure is then generated in the micropipette to deliver into the cell. Reversing the flow of the main microfluidic channel can be used to eject the cell.
Figure 13.
Figure 13.
Intracellular delivery via penetrating projectiles. (A) Biolistic projectiles consisting of metal beads are propelled towards a cell with enough force to burst through the plasma membrane. The metal beads are coated with cargo, which then releases inside the cell. Inset shows an example of a single cargo-covered bead disrupting the plasma membrane. (B) A magnetic field is used to attract magnetically functionalized particles (such as CNTs) through the plasma membrane into the target cell for delivery of attached cargo.
Figure 14.
Figure 14.
Intracellular delivery via penetrating nanowires/nanoneedles and nanostraws. (A) Cell pushed onto an array of nanowires with active force (F), such as centrifugation. The number of penetrating nanowires increases given the same needles as in B. (B) Passive settling and adhesion of a cell onto an array of nanoneedles coated with cargo molecules at the tip (green). In this case some nanowires may penetrate through the plasma membrane into the cytosol to release their contents inside the cell (green cloud). (C) Hollow nanowires (nanostraws) used for intracellular delivery by pumping cargo from a reservoir connected to the nanostraws.
Figure 15.
Figure 15.
Mechanical membrane permeabilization by direct contact. (A) Scrape loading, where a rubber spatula or similar scraping object can be used to simultaneously dislodge cells and permeabilize them. (B) Bead loading, wherein micron-scale beads can be rolled across a cell monolayer for controlled cell injury via collisions. (C) Filtroporation, where a solution of cells is passed through holes in filter membranes, such as a track-etched polycarbonate filter. (D) Microfluidic cell squeezing, where cells membranes are disrupted by rapid deformation that occurs with passage through microfabricated constrictions. (E) Permeabilization with nanoneedle arrays. (i) The array is first centrifuged or otherwise pressed against cells adhered to a rigid substrate. (ii) The array is then removed to enable cargo influx through membrane disruptions in the target cells.
Figure 16.
Figure 16.
Different variations of cell squeezing for membrane permeabilization. (A) The original microfluidic platform for cell squeezing. (i) The deformation the cell experiences upon passage through the constriction transiently permeabilizes the plasma membrane, allowing influx of cargo molecules into the cytosol. (ii) microfluidic chip, consisting of a silicon parallel microchannels produced by deep reactive ion-etching and sealed from the top with glass. Inlets and outlets are also visible. (B) Similar to cell squeezing in panel A but with addition of a downstream electric field. The electric field enhances delivery of large nucleic acids, such as plasmid DNA, into the cell by electrophoretic forces. In this case the device was optimized for delivery of plasmids into the cell nucleus at high throughput. Panel (i) shows the delivery concept. Panel (ii) shows the architecture of the constriction and electrode zones. Panel (iii) shows a view of the whole chip. (C) Cell squeezing with different constriction geometries in PDMS device. (i) Comparison of 45° pyramidal pattern, 90° saw tooth pattern, and 135° reverse wishbone pattern of repeated constrictions. (ii) COMSOL modeling indicates the stress (N·m−2) that the cell membrane undergoes upon passage through the different types of constrictions. Experiments and modeling showed the reverse wishbone pattern as the most effective for membrane disruption in this platform.
Figure 17.
Figure 17.
Mechanical membrane permeabilization by fluid shear forces. (A) Syringe loading, where a cell solution is repeatedly aspirated and ejected through the terminal aperture of a syringe needle. Shear forces at the nozzle promote membrane disruption. The inset illustrates cell deformation associated with shear forces. (B) Microfluidic shear-based permeabilization. Similar to syringe loading but exploiting the increase of shear forces associated with flow through narrowing microfluidic channels. The inset illustrates cell deformation upon flow through a single constriction. (C) Cone-plate viscometer. Generation of permeabilizing shear forces via rotation of a viscometer plate above a monolayer of cells. (D) Generation of local shear forces via collapse of a cavitation bubble. (E) Generation of local shear forces via oscillation of cavitation bubble. (F) Induction of cavitation bubbles on the basal side of cells through arrayed seed structures that absorb laser energy. The cavitation bubble can produce a large hole in the plasma membrane that allows influx from a separate fluid reservoir underneath the cells.
Figure 18.
Figure 18.
Modes of laser-induced membrane disruption. (A) Laser optoporation occurs when incident energy is absorbed by the plasma membrane, directly disrupting it. Optoporation is covered in section 6.4. (B) Laser absorption by an absorbing agent in contact with the cell (such as a particle or interface), which then generates secondary effects (heat, fluid shear, chemical breakdown) to disrupt the plasma membrane. (C) Laser absorption by an absorbing agent distant from the plasma membrane. In these cases fluid shear from cavitation and/or shock waves is the most likely cause of membrane disruption.
Figure 19.
Figure 19.
Mechanical membrane disruption via osmotic pressure changes. (A) Cells in suspension subject to hypotonic shock will first swell, which unravels membrane reservoirs. If the membrane strain is sufficient in response to the swelling force, permeabilization will occur. The inset shows microscale conformation of the plasma membrane. (B) Cells in an adherent monolayer cultured on a porous substrate can be subject to a perturbing osmotic gradient via hypotonic shock at their apical surface. Swelling and subsequent permeabilization occur similarly as in panel A but the permeabilization is localized to the apical side of the cell. (C) In a scenario where endosomes are pre-loaded with osmolytes and cargo to be delivered, a hypotonic shock can be used to cause lysis of endosomes.
Figure 20.
Figure 20.
Theory of pore formation in membranes by electric fields. (A) Schematic of pore formation showing the transition from a hydrophobic pore to a hydrophilic (conducting) pore. (B) Graphs of relationship between free energy of pores ΔW and pore radius r for ΔΦ m = 0 (upper curve) and at ΔΦ m > 0 (lower curve). r* is the critical radius corresponding to the transition from hydrophobic to hydrophilic pore. ΔWf corresponds to the height of the energy barrier for pore formation while ΔWres relates to the energy barrier height for pore resealing. rire is the pore radius corresponding to state of irreversible electroporation. ΔΦ m is the electrical potential difference across the membrane. Panel A and B reproduced from reference 239. (C) Calculations of the effect of applied voltage on the energy landscape of pore formation with transmembrane potentials ranging from 0 to 0.5 V. Panel C reproduced from reference 389.
Figure 21.
Figure 21.
A conventional parallel plate cuvette configuration for electroporation of suspended cells (left). Zoom-in (right) shows the approximate distribution of pores over the cell surface as a function of orientation and polarization under applied electric field. The surface area of poration and number of pores is greater on the hyperpolarized side compared to the depolarized side. Further zoom-in (bottom) illustrates the capacitor-like function of the lipid bilayer before poration and the flow of positive charge once a conducting pore is formed (opposite movement of negatively charged objects not shown). Electric field lines are displayed in grey.
Figure 22.
Figure 22.
Relationship between the pulse strength-duration parameter space and subcellular targeting. High intensity short pulses are biased toward perturbing small membrane bound bodies like organelles while milder, longer pulses are more specific for the plasma membrane and larger cells. At large field strengths and longer durations thermal damage due to heating becomes an issue, being also dependent on buffer conductivity.
Figure 23.
Figure 23.
Relationship between size and charge of cargo molecule and mechanisms of entry through a given pore size for electroporation. (A) Depiction of approximate size and charge properties of molecules illustrated in scenarios from panels B to E. The depictions are based on knowledge from the literature and explained in the text.
Figure 24.
Figure 24.
Model for endocytosis of electroporation-induced DNA aggregates at the cell surface. During the electric field pulse, negatively charged plasmid DNA is propelled into the side of the cell facing the negative electrode. Due to conformational flexibility some parts of the DNA may be threaded through pores in the cell membrane. Aggregates are then endocytosed, from which they either escape and find their way to the nucleus for the purpose of expression or are degraded by lysosomes.
Figure 25.
Figure 25.
Schematic of the mechanisms of influx in relation to disruption size, molecule size, molecule charge, and conformational flexibility. For charged objects approaching the disruption size or larger, electrophoretic forces are crucial for delivery. (A) Shown is the case for a molecule much smaller the size of the membrane disruption. Regardless of charge, delivery is mostly via diffusion. (B) Shown is the case for a negatively charged molecule of similar size to the membrane disruption. Delivery requires an electrophoretic driving force. (C) Shown is the case for a flexible molecule (here a DNA plasmid) that is much larger than the membrane disruption. Electrophoretic force can thread part of the molecule into the cell.
Figure 26.
Figure 26.
Examples of dual-pulse electroporation protocols from the literature. (A) The first pulse has a field strength of 1 kV cm−1 and duration of 1 ms. The second pulse 0.3 kV cm−1 in strength and 10 ms in duration. Figure taken from reference 1078. (B) Schematic of a pulse sequence consisting of AC first followed by a pre-programmed delay then a second DC pulse. In this case, the first pulse is 1 ms and the second one is 30 ms. Figure taken from reference 1079.
Figure 27.
Figure 27.
Electroporation (EP) configurations. (A) Bulk (conventional) electroporation in parallel plate cuvette (i) and capillary (ii) geometries. (B) Microscale electroporation examples showing electroporation in droplets (i), the use of channel architecture to manipulate voltage pulses (ii), hydrodynamic focusing to generate liquid electrodes (iii), and hydrodynamic vortices to rotate cells through electric fields (iv). (C) Nanoscale electroporation with examples of nanochannel electroporation, where cells are pressed against nanoscale apertures (i); nanostraw electroporation, in which the electric field is concentrated onto the end of a nanostraw (ii); and nanofountain electroporation, which exploits a hollow AFM tip for addressing individual cells (iii).
Figure 28.
Figure 28.
In vitro and ex vivo applications of intracellular delivery achieved with electroporation. (A) Delivery of impermeable drugs to the intracellular space for drug testing and/or cell manipulation. (B) Transfection with plasmid DNA encoding proteins, antibodies, and viral components for biomanufacturing purposes. (C) Loading of protein antigens or mRNA encoding such into dendritic cells. Presentation of antigen fragments through MHC pathways is able to prime T cells against cells carrying the antigens and may be useful for cancer immunotherapy. (D) Transfection of cytotoxic immune cells with mRNA encoding TCRs and/or CARs can be used to direct immune cells against specific cell targets, such as cancer cells. TCR = T cell receptor. CAR = chimeric antigen receptor. (E) Genome-editing molecules can be delivered into stem cells for purposes of adding, deleting, or correcting genes. Modified stem cells can then be expanded for potential deployment in cell-and tissue-based gene therapy. Red signifies areas of the genome that have been edited. ZFN = zinc finger nuclease.
Figure 29.
Figure 29.
Thermal membrane disruption. (A) Membrane disruption by freeze-thaw cycles. Formation of ice crystals leads to volume expansion due to the changes in hydrogen bonding arrangement. Volume expansions are thought to be related to cracking of membranes during ice crystal formation. (B) Heating of cells above 42 °C increases the chances of spontaneous defect formation in membranes. (C) Microfluidic geometries may be used to confine the heating locally to a part of the cell, such as is possibly the case for thermal inkjet printing. (D) Absorbent nanoparticles may be used to locally convert laser power into local heating for membrane perturbation. (E) A focused laser can generate local heating at the membrane with selection of appropriate parameters.
Figure 30 |
Figure 30 |
Optoporation strategies for membrane disruption. Focused laser can inflict (A) thermal (B) cavitation (C) chemical breakdown, or (D) mechanical effects against lipid bilayers.
Figure 31.
Figure 31.
Simulations of membrane bilayer perturbation with DMSO and Ethanol. (A) Presented are side views of the final structures for the bilayer systems containing 0, 5, 10, and 40 mol% of DMSO. Lipids are shown in cyan, water in red, and DMSO in yellow. Taken from reference 1323. (B) Formation of non-bilayer structures within the membrane interior with 15 mol% of ethanol: (1) 3100 ps; (2) 13,180 ps; (3) 19,920 ps; (4) 30,000 ps. Shown are water molecules (red and white) and phosphorus (green) and nitrogen (blue) atoms of lipid head groups. The rest of the lipid atoms as well as ethanol molecules are not shown. Taken from reference 1325.
Figure 32.
Figure 32.
Proposed mechanisms of membrane permeabilization by detergents that flip flop. Integration of detergent monomers perturbs membrane integrity while stochastic local enrichment of detergents leads to formation of pores.
Figure 33.
Figure 33.
Proposed mechanisms of membrane permeabilization by detergents that do not flip flop. Once detergent monomers gain access to the interior side of the membrane, they can distribute to both leaflets and perturb the membrane by mechanisms similar to detergents that flip flop (see figure 32).
Figure 34.
Figure 34.
Proposed mechanisms of membrane permeabilization by detergent micelle collisions. Micelles colliding with the membrane can create defects by sequestering lipid molecules from the bilayer.
Figure 35.
Figure 35.
Interactions of digitonin with phospholipid membranes containing varying amounts of cholesterol. Taken from reference 1349.
Figure 36.
Figure 36.
Schematic of exposure to membrane-perturbing detergent and/or surfactants by (A) bulk mixing, (B) microfluidic hydrodynamic focusing, and (C) localization to a nanoscale particle.
Figure 37.
Figure 37.
Schematic overview of the possible interaction pathways of an antimicrobial peptide with a lipid bilayer. Possible thermodynamic states (either stable or metastable) are indicated by black labels, the major kinetic pathways connecting them by gray arrows and red labels. Short black arrows represent additional inter-conversion pathways. Outside the target membrane, peptide monomers and small aggregates exist in equilibrium. At the target membrane, the peptides bind to the interface (Adsorption). At the interface an equilibrium may exist between monomeric and polymeric aggregation states. For a symmetric bilayer, the asymmetric membrane bound state is not thermodynamically stable. Eventually the peptides will distribute equally between the two monolayer leaflets. This can occur via two alternative translocation pathways. In the non-leaky variant the peptides are able to cross the bilayer without the formation of a pore. In some cases, the intermediate transmembrane state is thermodynamically stable (e.g. hydrophobic peptides which adopt a transmembrane orientation). The key feature of many antimicrobial peptides is that they permeabilize the membrane following a leaky translocation pathway. Above a certain peptide– lipid ratio, the peptides insert into the bilayer to form a porated lamellar phase (Poration). A variety of different pore structures may be formed, including the barrel-stave, the toroidal and the disordered toroidal state. These separate states should be interpreted as extreme cases with mixed varieties of these models, and conversion between alternative states is likely to occur. The porated states can be stable themselves, but they can also be transient structures in the translocation pathway. In that case, once enough peptides are adsorbed at the opposing monolayer leaflet, the pores seal. On the other hand, increased accumulation of certain peptides may lead to a detergent-like disintegration of the membrane resulting in formation of non-lamellar, e.g. micellar, systems (solubilization pathway). Note that the secondary structure of the peptides could vary along the various pathways. The helical or random configurations drawn here are merely illustrative of these processes and should not be taken literally. Figure legend and image taken from reference 1389.
Figure 38.
Figure 38.
Schematic of the effect of peptide binding on lipid bilayer integrity. (i) The reference state for energy change is an intact phospholipid bilayer. (ii) Spontaneous fluctuations result in the sampling of membrane defects. These are energetically unfavorable and therefore sampled infrequently. (iii) Widening of the defect to permit leakage results in a further energetic penalty. (iv) In the presence of surface-bound protein (magenta), membrane tension is induced. (v) Protein binding increases the frequency of defect formation. (vi) Surface tension is released by pore formation and stabilized by peptide binding resulting in equilibrium poration (vii). Note, many forms of defect, such as chaotic pores, can be accommodated by this model, and defect characteristics may differ between alternate peptides or the same peptide under alternate conditions. Figure legend and image taken from reference 1396.
Figure 39.
Figure 39.
Schematic representation of the pore formation pathway of pore-forming toxins (PFTs). Soluble PFTs are recruited to the host membrane by protein receptors and/or specific interactions with lipids (for example, sphingomyelin for actinoporins or sterols for cholesterol-dependent cytolysins (CDCs)). Upon membrane binding, the toxins concentrate and start the oligomerization process, which usually follows one of two pathways. In the pathway followed by most β-PFTs, oligomerization occurs at the membrane surface, producing an intermediate structure known as a pre-pore (mechanism 1), which eventually undergoes conformational rearrangements that lead to concerted membrane insertion. In the pathway followed by most α-PFTs, PFT insertion into the membrane occurs concomitantly with a sequential oligomerization mechanism, which can lead to the formation of either a partially formed, but active, pore (mechanism 2), or the formation of complete pores. Although classified as β-PFTs, CDCs also share some of the features of this second pathway, as they can also form intermediate structures (known as ‘arcs’, named after their shape) during pore formation. In both α-PFT and β-PFT pathways, the final result is the formation of a transmembrane pore with different architecture, stoichiometry, size and conduction features, which promote the influx or efflux of ions, small molecules and proteins through the host membrane, and trigger various secondary responses involved in the repair of the host membrane. Note that, although the host membrane shown here is the eukaryotic plasma membrane, some PFTs are antibacterial and form pores in the inner membranes of Gram-negative bacteria or the cell membranes of gram-positive bacteria. Figure legend and image taken from reference 400.
Figure 40.
Figure 40.
The structure of pores created by CDC pore-forming toxins. (A) CDC family members, such as Perfringolysin O (PFO), oligomerize to form large pre-pores, which, after an extended conformational change, form a membrane-inserted β-barrel. Figure taken from reference 400. (B) AFM images of the PFO pore complexes in supported lipid bilayers that contain cholesterol. Scale bar 25 nm. Figure taken from reference 1403.
Figure 41.
Figure 41.
Chemical structures of oxidized phosphatidylcholines and their effects on bilayer packing. (A) Hydroxy- (HOSAPC and HOPLPC) and hydroperoxy-(HPSAPC, HPPLPC, and 9-tc) phospatidylcholines. Different cis/trans isomers are possible. 13-tc refers to trans-11, cis-9 isomer of HPPLPC. (B) Truncated (cleaved chain) phosphatidylcholines with aldehyde (12-al, PONPC, POVPC, ox1-DOPC, and ox2-DOPC) and carboxylic (PAzPC and PGPC), functional groups. For further details see reference 1467. (C) Example of conformation changes that lipid molecules undergo due to peroxidation. In this case singlet oxygen adds the more hydrophilic group-OOH at either 9 or 10 position, which migrates to the bilayer surface. This imposes a kink to the acyl chain, with an accompanying increase in area δA per lipid. Figure taken from reference 397.
Figure 42.
Figure 42.
Synthetic nanodevices for use as membrane-embedded valves or channels. (A) DNA origami nanostructures assembled to form a membrane channel. Figure taken from reference 1483. (B) Carbon nanotubes embedded within lipid bilayers for molecular transport. Figure taken from reference 1484.

References

    1. Peer D; Karp JM; Hong S; Farokhzad OC; Margalit R; Langer R Nanocarriers as an emerging platform for cancer therapy. Nature nanotechnology 2007, 2 (12), 751. - PubMed
    1. Ganta S; Devalapally H; Shahiwala A; Amiji M A review of stimuli-responsive nanocarriers for drug and gene delivery. Journal of Controlled Release 2008, 126 (3), 187. - PubMed
    1. Mura S; Nicolas J; Couvreur P Stimuli-responsive nanocarriers for drug delivery. Nat Mater 2013, 12 (11), 991. - PubMed
    1. Prokop A; Davidson JM Nanovehicular intracellular delivery systems. J Pharm Sci-Us 2008, 97 (9), 3518. - PMC - PubMed
    1. Blanco E; Shen H; Ferrari M Principles of nanoparticle design for overcoming biological barriers to drug delivery. Nat Biotechnol 2015, 33 (9), 941. - PMC - PubMed

Publication types