Clinical Trial
. 2019 Jan;59(1):20-34.
doi: 10.1002/jcph.1275. Epub 2018 Jul 27.

Pharmacometabolomics Reveals Irinotecan Mechanism of Action in Cancer Patients

Affiliations
Clinical Trial

Pharmacometabolomics Reveals Irinotecan Mechanism of Action in Cancer Patients

Xun Bao et al. J Clin Pharmacol. 2019 Jan.

Abstract

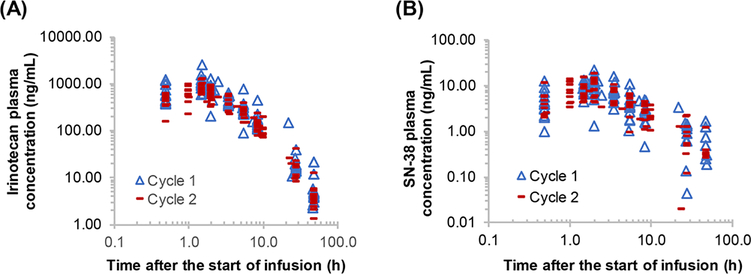
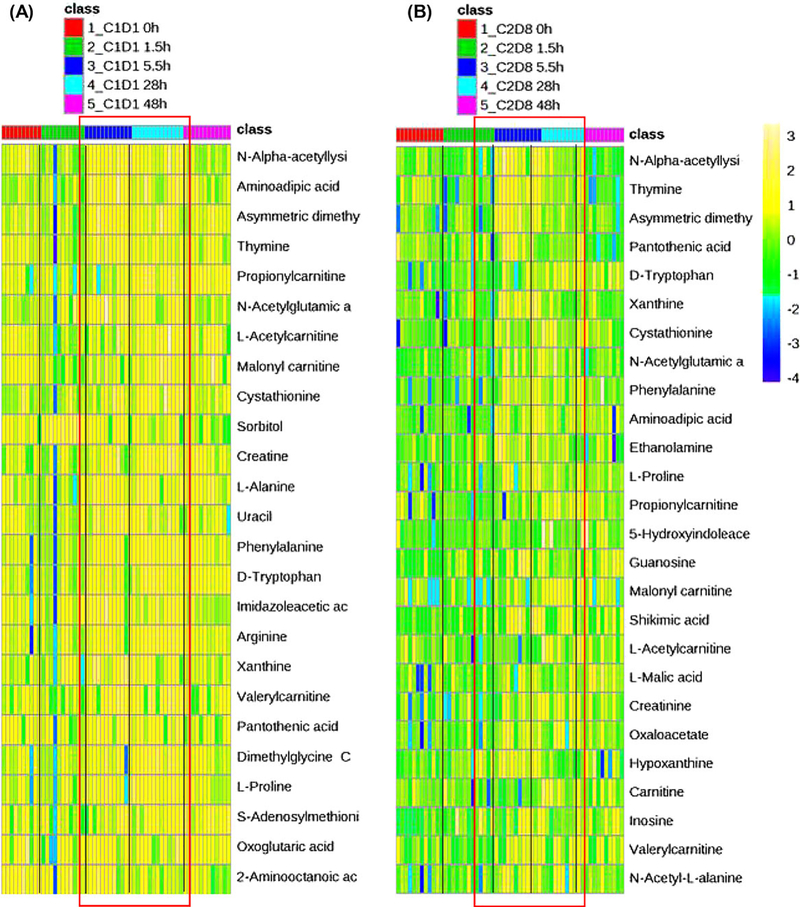
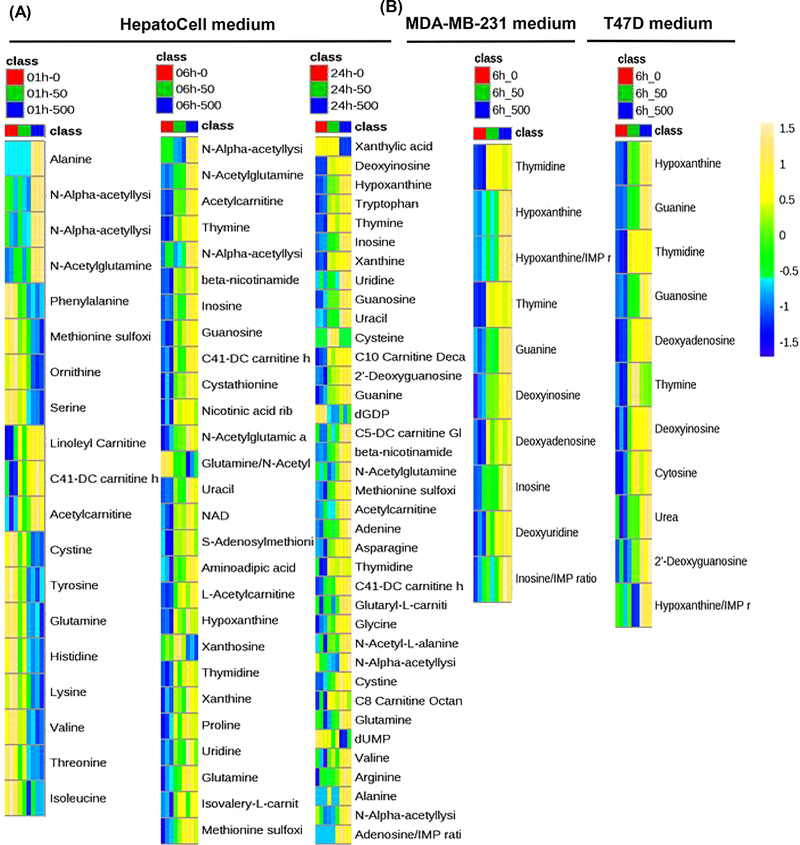
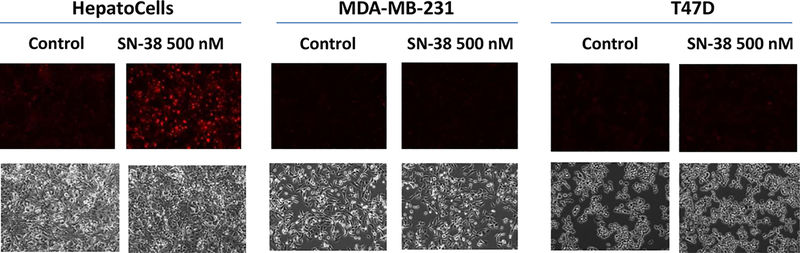
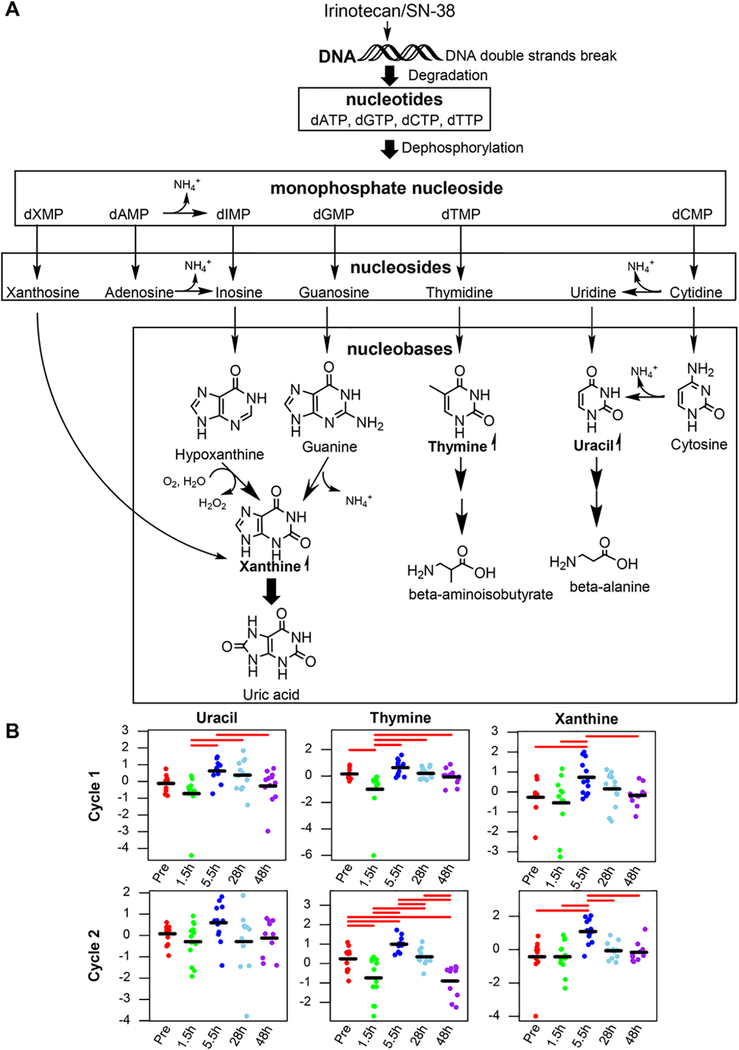
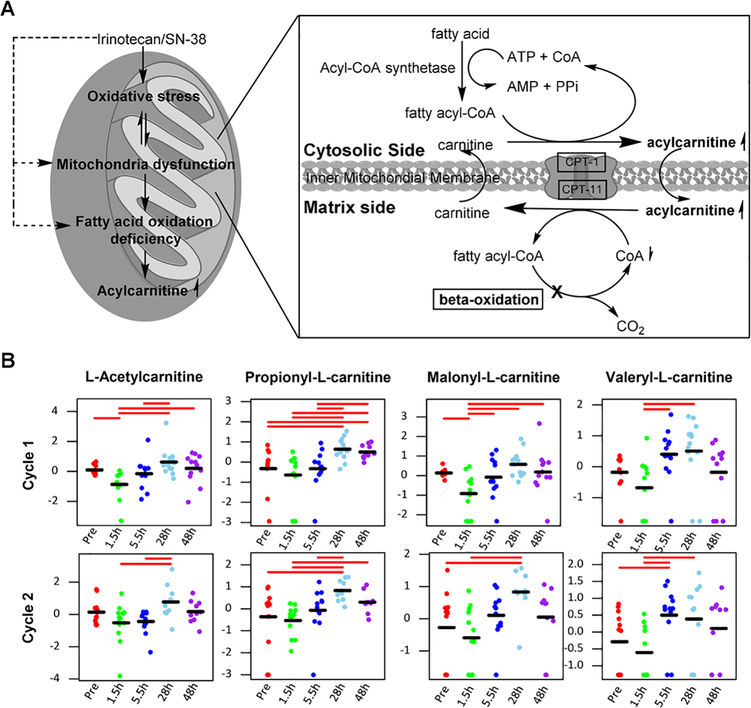
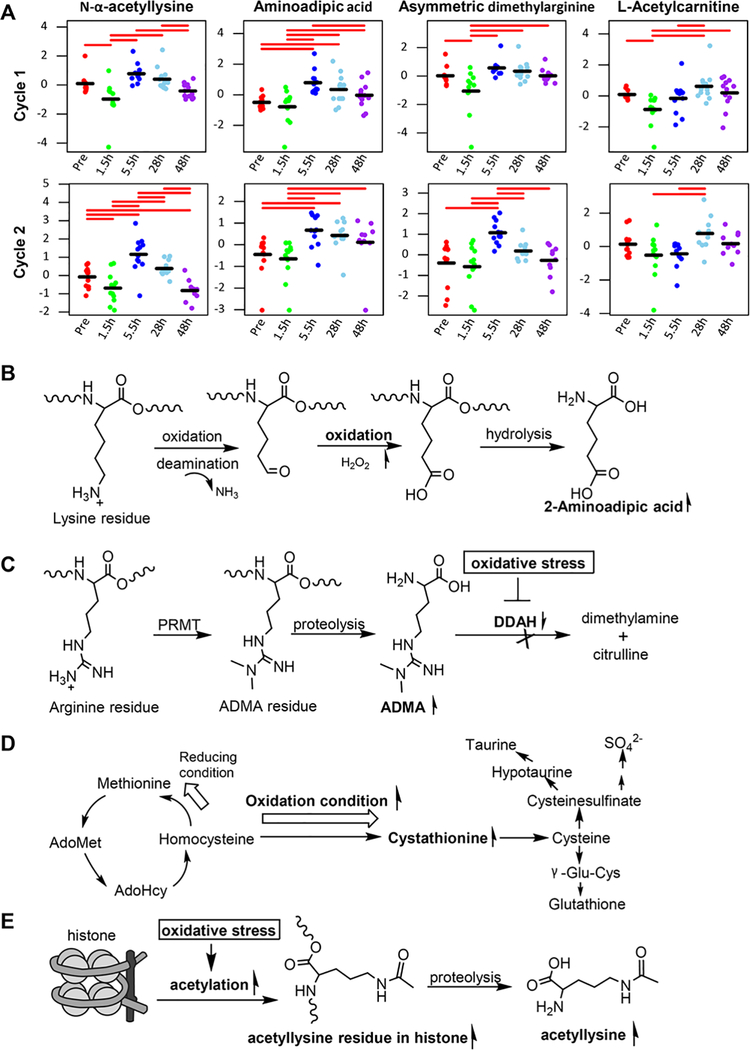
The purpose of this study was to identify early circulating metabolite changes implicated in the mechanism of action of irinotecan, a DNA topoisomerase I inhibitor, in cancer patients. A liquid chromatography-tandem mass spectrometry-based targeted metabolomic platform capable of measuring 254 endogenous metabolites was applied to profile circulating metabolites in plasma samples collected pre- and post-irinotecan treatment from 13 cancer patients. To gain further mechanistic insights, metabolic profiling was also performed for the culture medium of human primary hepatocytes (HepatoCells) and 2 cancer cell lines on exposure to SN-38 (an active metabolite of irinotecan). Intracellular reactive oxygen species (ROS) was detected by dihydroethidium assay. Irinotecan induced a global metabolic change in patient plasma, as represented by elevations of circulating purine/pyrimidine nucleobases, acylcarnitines, and specific amino acid metabolites. The plasma metabolic signature was well replicated in HepatoCells medium on SN-38 exposure, whereas in cancer cell medium SN-38 induced accumulation of pyrimidine/purine nucleosides and nucleobases while having no impact on acylcarnitines and amino acid metabolites. SN-38 induced ROS in HepatoCells, but not in cancer cells. Distinct metabolite signatures of SN-38 exposure in HepatoCells medium and cancer cell medium revealed different mechanisms of drug action on hepatocytes and cancer cells. Elevations in circulating purine/pyrimidine nucleobases may stem from nucleotide degradation following irinotecan-induced DNA double-strand breaks. Accumulations of circulating acylcarnitines and specific amino acid metabolites may reflect, at least in part, irinotecan-induced mitochondrial dysfunction and oxidative stress in the liver. The plasma metabolic signature of irinotecan exposure provides early insights into irinotecan mechanism of action in patients.

Keywords: DNA double-strand break; irinotecan; metabolomics; mitochondrial dysfunction; oxidative stress; steatohepatitis.


Conflict of interest statement

Declaration of Conflicting Interests

The authors declare that there are no conflicts of interest.

Figures

Figure 1.
Figure 1.
Plasma concentration-time profiles of irinotecan (A) and its active metabolite, SN-38 (B), in 13 individual patients following 1.5-hour intravenous infusion of irinotecan alone on cycle 1, day 1 and in combination with veliparib on cycle 2, day 8.
Figure 2.
Figure 2.
Plasma metabolic signature of irinotecan exposure in cancer patients. The most apparent elevations in plasma levels of metabolites, including amino acid metabolites (eg, N-α-acetyllysine, 2-aminoadipic acid, asymmetric dimethylarginine, and cystathionine), acylcarnitine derivatives (eg, propionylcarnitine, L-acetylcarnitine, malonylcarnitine, and valerylcarnitine), and pyrimidine/purine nucleobases (eg, thymine, uracil, and xanthine) occurred at 5.5 and/or 28 hours. (A) Heat map of the significantly changed circulating metabolites (ANOVA, FDR-adjusted P < .2) following 1.5-hour intravenous infusion of irinotecan (100 mg/m2) on cycle 1, day 1 in patients. (B) Heat map of the top 25 most significantly changed circulating metabolites (ANOVA, FDR-adjusted P < .2) following the coadministration of irinotecan (100 mg/m2) and veliparib on cycle 2, day 8 in patients. The order of metabolites is based on the FDR-adjusted P values (from the most significant). The scales from −4 to 3 (ie, from blue to yellow) represent the normalized metabolite levels from low to high. The 5.5- and 28-hour data are boxed in red for visualization of the most apparent metabolite changes, which generally occurred 5.5 and 28 hours following irinotecan administration.
Figure 3.
Figure 3.
Metabolite signatures of SN-38 exposure in the culture medium of human primary hepatocytes (HepatoCells) and cancer cells. SN-38 exposure induced concentration- and time-dependent accumulation of amino acid metabolites, acylcarnitines, and pyrimidine/purine nucleosides and nucleobases in HepatoCells, whereas, in the culture medium of 2 cancer cell lines, SN-38 exposure only led to significant accumulations of pyrimidine/purine nucleosides and nucleobases, while having no apparent impact on amino acid metabolites and acylcarnitines. (A) Heat maps of the significantly changed metabolites (ANOVA, FDR-adjusted P < .05) in the culture medium of human primary hepatocytes (HepatoCells) and (B) the culture medium of cancer cells (MDA-MB-231 and T47D) in response to exposure to SN-38 at 50 and 500 nM for 1, 6, or 24 hours. The order of metabolites is based on the FDR-adjusted P values (from the most significant). The scales from −4 to 3 (ie, from blue to yellow) represent the normalized metabolite levels from low to high.
Figure 4.
Figure 4.
Detection of intracellular reactive oxygen species (ROS) by dihydroethidium (DHE) assay in human primary hepatocytes (HepatoCells) and cancer cells (MDA-MB-231 and T47D) on exposure to SN-38 (500 nM) or drug-free medium (control) for 2 hours. The formation of ROS, as measured by the red fluorescence resulting from the oxidation of dihydroethidium by superoxide,was detected in HepatoCells but not in cancer cells. Live cell images in the upper panel were recorded at 10× magnification using Texas red filter (excitation, 540–580 nm; emission, 600–660 nm), and those in the lower panel were recorded at 10× magnification using white light.
Figure 5.
Figure 5.
Elevation of circulating purine/pyrimidine nucleobases (eg, uracil, thymine, and xanthine) in cancer patients following irinotecan administration indicates purine and pyrimidine nucleotide degradation following irinotecan/SN-38-induced DNA double-strand breaks. (A) Schematic illustration of purine and pyrimidine nucleotide degradation pathways following DNA double-strand breaks. (B) Observed time course of circulating purine nucleobases (xanthine) and pyrimidine nucleobases (uracil and thymine) following 1.5-hour intravenous infusion of irinotecan alone on cycle 1, day 1 (upper panel) and in combination with veliparib in cycle 2, day 8 (lower panel) in 13 cancer patients. Data points represent log-transformed and autoscaled (mean-centered and divided by the standard deviation) metabolite concentrations in individual patients, and the black bar represents the mean of normalized data at each point. The significantly different pairs are indicated with red bars using pairwise Fisher’s LSD post hoc analyses at a 5% level.
Figure 6.
Figure 6.
Elevation of circulating acylcarnitines (eg, L-acetylcarnitine, propionylcarnitine, malonylcarnitine, and valerylcarnitine) in cancer patients following irinotecan administration is likely a result of fatty acid β-oxidation deficiency because of irinotecan-induced hepatic mitochondrial dysfunction. (A) Schematic illustration of the transport of fatty acids across the mitochondrial inner membrane and fatty acid β-oxidation process in the mitochondrial matrix. CPTI, carnitine palmitoyltransferase-1; CPTII, carnitine palmitoyltransferase-2. (B) Observed time course of circulating acylcarnitines following 1.5-hour intravenous infusion of irinotecan alone on cycle 1, day 1 (upper panel) and in combination with veliparib on cycle 2, day 8 (lower panel). Data points represent log-transformed and autoscaled (mean-centered and divided by the standard deviation) metabolite concentrations in individual patients, and the black bar represents the mean of normalized data at each point. The significantly different pairs are indicated with red bars using pairwise Fisher’s LSD post hoc analyses at a 5% level.
Figure 7.
Figure 7.
Elevation of circulating specific amino acid metabolites (eg, N-α-acetyllysine, 2-aminoadipic acid, asymmetric dimethylarginine, and cystathionine) in cancer patients following irinotecan administration is implicated in irinotecan-induced oxidative stress. (A) Observed time course of circulating levels of specific amino acid metabolites following 1.5-hour intravenous infusion of irinotecan alone in cycle 1, day 1 (upper panel) and in combination with veliparib in cycle 2, day 8 (lower panel) in cancer patients. Data points represent log-transformed and autoscaled (mean-centered and divided by the standard deviation) metabolite concentrations in individual patients, and the black bar represents the mean of normalized data at each point. The significantly different pairs are indicated with red bars using pairwise Fisher’s LSD post hoc analyses at a 5% level. (B) Schematic illustration of oxidation of lysyl residues to 2-aminoadipic acid under oxidized conditions. (C) Schematic illustration of accumulation of asymmetric dimethylarginine (ADMA) because of inactivation of dimethylargine dimethylaminohydrolases (DDAH), a major enzyme responsible for the metabolism of ADMA, under oxidative stress. PRMT, protein-arginine methyltransferases. (D) Schematic illustration of increased cystathionine circulating levels as an autocorrective response to oxidative stress. (E) Schematic illustration of elevated circulating N-α-acetyllysine as a consequence of enhanced histone acetylation in response to oxidative stress.

References

    1. Saltz LB, Cox JV, Blanke C, et al. Irinotecan plus fluorouracil and leucovorin for metastatic colorectal cancer. Irinotecan Study Group. N Engl J Med. 2000;343(13):905–914. - PubMed
    1. Punt CJ, Koopman M. Capecitabine and irinotecan as first-line treatment of advanced colorectal cancer. J Clin Oncol. 2008;26(11):1907–1908; author reply 1908–1909. - PubMed
    1. Mathijssen RH, Loos WJ, Verweij J, Sparreboom A. Pharmacology of topoisomerase I inhibitors irinotecan (CPT-11) and topotecan. Curr Cancer Drug Targets. 2002;2(2):103–123. - PubMed
    1. Liu LF, Desai SD, Li TK, Mao Y, Sun M, Sim SP. Mechanism of action of camptothecin. Ann N Y Acad Sci. 2000;922:1–10. - PubMed
    1. Vauthey JN, Pawlik TM, Ribero D, et al. Chemotherapy regimen predicts steatohepatitis and an increase in 90-day mortality after surgery for hepatic colorectal metastases. J Clin Oncol. 2006;24(13):2065–2072. - PubMed

Publication types

MeSH terms

LinkOut - more resources