

Comparison of heritability estimates on resting state fMRI connectivity phenotypes using the ENIGMA analysis pipeline
- PMID: 30052318
- PMCID: PMC6218292
- DOI: 10.1002/hbm.24331
Comparison of heritability estimates on resting state fMRI connectivity phenotypes using the ENIGMA analysis pipeline
Abstract
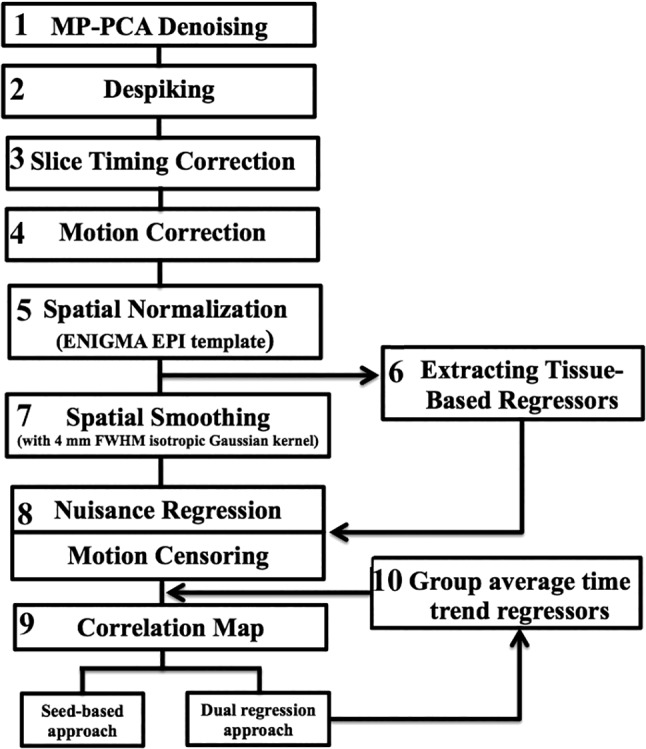
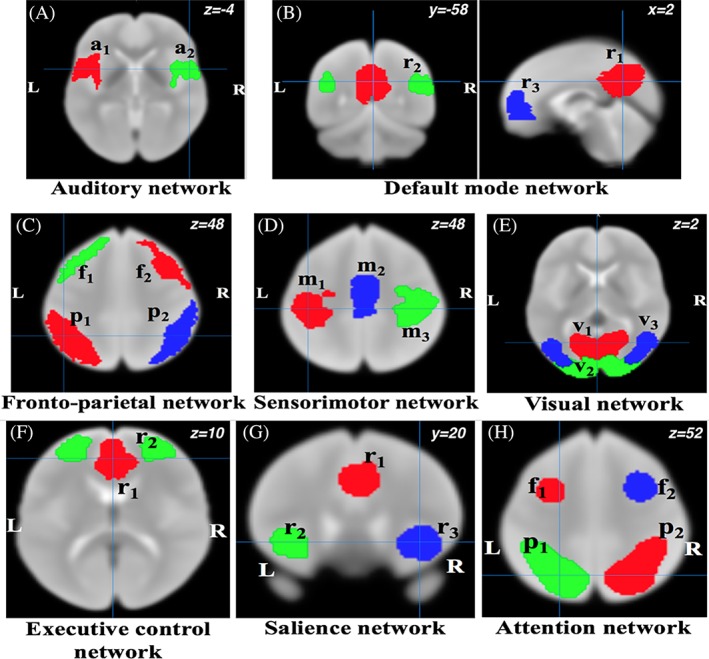
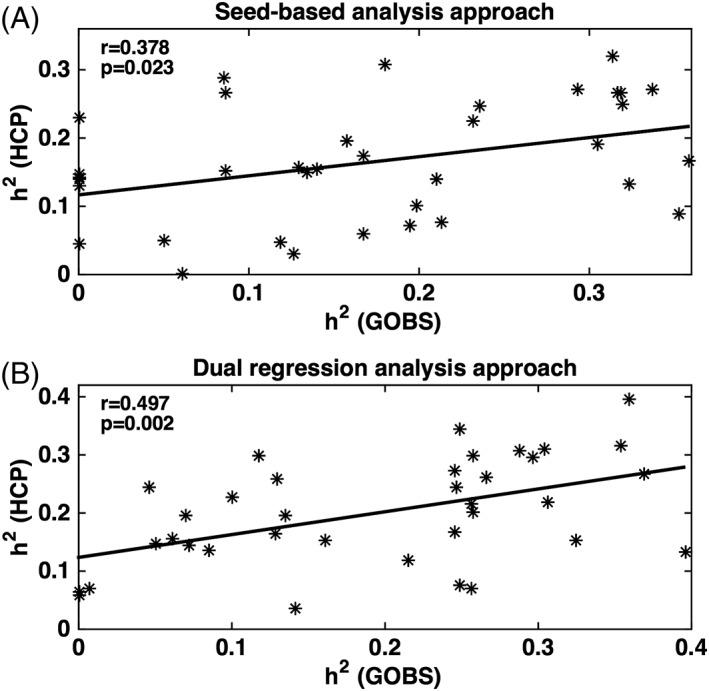
We measured and compared heritability estimates for measures of functional brain connectivity extracted using the Enhancing Neuroimaging Genetics through Meta-Analysis (ENIGMA) rsfMRI analysis pipeline in two cohorts: the genetics of brain structure (GOBS) cohort and the HCP (the Human Connectome Project) cohort. These two cohorts were assessed using conventional (GOBS) and advanced (HCP) rsfMRI protocols, offering a test case for harmonization of rsfMRI phenotypes, and to determine measures that show consistent heritability for in-depth genome-wide analysis. The GOBS cohort consisted of 334 Mexican-American individuals (124M/210F, average age = 47.9 ± 13.2 years) from 29 extended pedigrees (average family size = 9 people; range 5-32). The GOBS rsfMRI data was collected using a 7.5-min acquisition sequence (spatial resolution = 1.72 × 1.72 × 3 mm3 ). The HCP cohort consisted of 518 twins and family members (240M/278F; average age = 28.7 ± 3.7 years). rsfMRI data was collected using 28.8-min sequence (spatial resolution = 2 × 2 × 2 mm3 ). We used the single-modality ENIGMA rsfMRI preprocessing pipeline to estimate heritability values for measures from eight major functional networks, using (1) seed-based connectivity and (2) dual regression approaches. We observed significant heritability (h2 = 0.2-0.4, p < .05) for functional connections from seven networks across both cohorts, with a significant positive correlation between heritability estimates across two cohorts. The similarity in heritability estimates for resting state connectivity measurements suggests that the additive genetic contribution to functional connectivity is robustly detectable across populations and imaging acquisition parameters. The overarching genetic influence, and means to consistently detect it, provides an opportunity to define a common genetic search space for future gene discovery studies.
Keywords: functional connectivity; heritable; seed-based connectivity.
© 2018 Wiley Periodicals, Inc.
Figures
References
-
- Batouli, S. A. , Sachdev, P. S. , Wen, W. , Wright, M. J. , Ames, D. , & Trollor, J. N. (2013). Heritability of brain volumes in older adults: The older Australian twins study. Neurobiology of Aging, 35(937), e5–e18. - PubMed
Publication types
MeSH terms
Grants and funding
- R01 MH116948/MH/NIMH NIH HHS/United States
- R01 EB015611/EB/NIBIB NIH HHS/United States
- P30 AG008051/AG/NIA NIH HHS/United States
- R01 MH078111/MH/NIMH NIH HHS/United States
- R01 DA027680/DA/NIDA NIH HHS/United States
- T32 MH067533/MH/NIMH NIH HHS/United States
- R01 MH085646/MH/NIMH NIH HHS/United States
- R01 MH117601/MH/NIMH NIH HHS/United States
- U01 MH108148/MH/NIMH NIH HHS/United States
- U54 EB020403/EB/NIBIB NIH HHS/United States
- R01 MH112180/MH/NIMH NIH HHS/United States
- S10 OD023696/OD/NIH HHS/United States
- R01 MH083824/MH/NIMH NIH HHS/United States
LinkOut - more resources
Full Text Sources
Other Literature Sources
Medical
Miscellaneous
