

Overview of three influenza seasons in Georgia, 2014-2017
- PMID: 30052663
- PMCID: PMC6063423
- DOI: 10.1371/journal.pone.0201207
Overview of three influenza seasons in Georgia, 2014-2017
Abstract
Background: Influenza epidemiological and virologic data from Georgia are limited. We aimed to present Influenza Like Illness (ILI) and Severe Acute Respiratory Infection (SARI) surveillance data and characterize influenza viruses circulating in the country over three influenza seasons.
Methods: We analyzed sentinel site ILI and SARI data for the 2014-2017 seasons in Georgia. Patients' samples were screened by real-time RT-PCR and influenza viruses isolated were characterized antigenically by haemagglutination inhibition assay and genetically by sequencing of HA and NA genes.
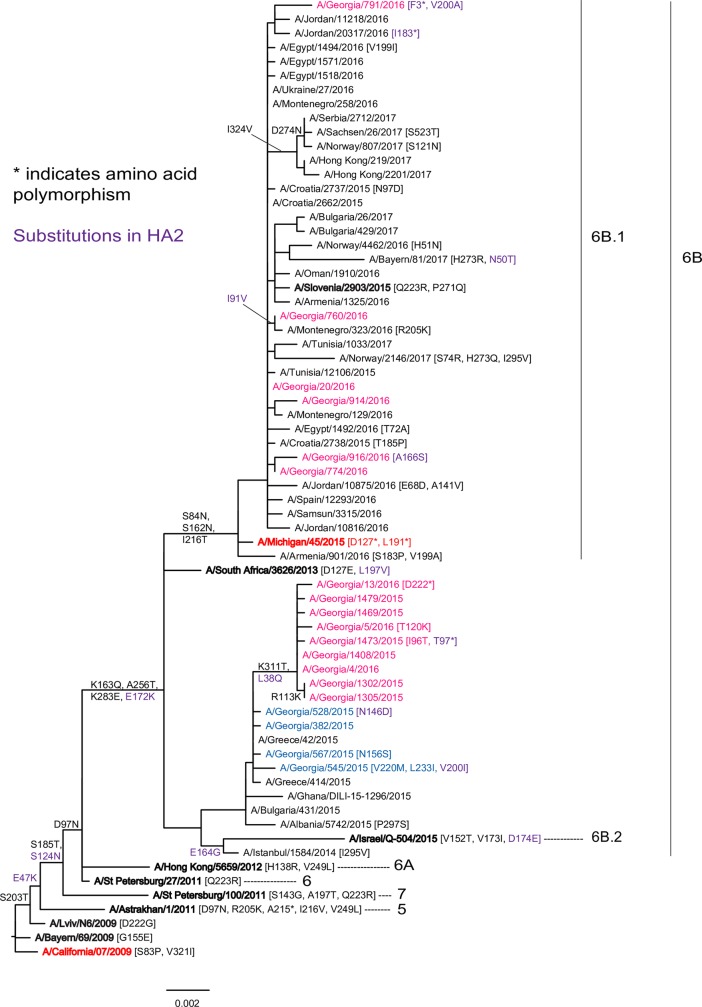
Results: 32% (397/1248) of ILI and 29% (581/1997) of SARI patients tested were positive for influenza viruses. In 2014-2015 the median week of influenza detection was week 7/2015 with B/Yamagata lineage viruses dominating (79%); in 2015-2016-week 5/2016 was the median with A/H1N1pdm09 viruses prevailing (83%); and in 2016-2017 a bimodal distribution of influenza activity was observed-the first wave was caused by A/H3N2 (55%) with median week 51/2016 and the second by B/Victoria lineage viruses (45%) with median week 9/2017. For ILI, influenza virus detection was highest in children aged 5-14 years while for SARI patients most were aged >15 years and 27 (4.6%) of 581 SARI cases died during the three seasons. Persons aged 30-64 years had the highest risk of fatal outcome, notably those infected with A/H1N1pdm09 (OR 11.41, CI 3.94-33.04, p<0.001). A/H1N1pdm09 viruses analyzed by gene sequencing fell into genetic groups 6B and 6B.1; A/H3N2 viruses belonged to genetic subclades 3C.3b, 3C.3a, 3C.2a and 3C.2a1; B/Yamagata lineage viruses were of clade 3 and B/Victoria lineage viruses fell in clade1A.
Conclusion: In Georgia influenza virus activity occurred mainly from December through March in all seasons, with varying peak weeks and predominating viruses. Around one third of ILI/ SARI cases were associated with influenza caused by antigenically and genetically distinct influenza viruses over the course of the three seasons.
Conflict of interest statement
The authors have declared that no competing interests exist.
Figures


References
-
- World Health Organization. Influenza fact sheet. November 2016. Available from: http://www.who.int/mediacentre/factsheets/fs211/en/.
-
- Emukule GO, Spreeuwenberg P, Chaves SS, Mott JA, Tempia S, Bigogo G, et al. Estimating influenza and respiratory syncytial virus-associated mortality in Western Kenya using health and demographic surveillance system data, 2007–2013. PLOS ONE 12(7): e0180890 10.1371/journal.pone.0180890 - DOI - PMC - PubMed
-
- World Health Organization. Global Epidemiological Surveillance Standards for Influenza. Available from:http://www.who.int/influenza/resources/documents/WHO_Epidemiological_Inf....
Publication types
MeSH terms
Grants and funding
LinkOut - more resources
Full Text Sources
Other Literature Sources
Medical
