. 2019 Feb 1;35(3):523-525.
doi: 10.1093/bioinformatics/bty654.

MinIONQC: fast and simple quality control for MinION sequencing data

Affiliations

MinIONQC: fast and simple quality control for MinION sequencing data

R Lanfear et al. Bioinformatics. .

Abstract

Summary: MinIONQC provides rapid diagnostic plots and quality control data from one or more flowcells of sequencing data from Oxford Nanopore Technologies' MinION instrument. It can be used to assist with the optimisation of extraction, library preparation, and sequencing protocols, to quickly and directly compare the data from many flowcells, and to provide publication-ready figures summarising sequencing data.

Availability and implementation: MinIONQC is implemented in R and released under an MIT license. It is available for all platforms from https://github.com/roblanf/minion_qc.


Figures
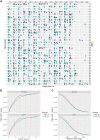
Fig. 1.
Fig. 1.
Three example plots from MinionQC. (A) A physical map of the flowcell with each of the 512 pores shown in their physical location. The sub-plot for each pore shows a single point for each read, with the length on the y axis (log scale), the number of hours into the run on the x-axis, and the quality score of the read as the colour. This plot clearly shows the presence of a bubble causing many of the pores on the right-hand-side of the plot to produce little or no data, as well as the presence of contaminants blocking the pores, leading to the production of a large number of small, low-quality signals as the run progresses; (B) Yield in bases (y-axis) against run time (x-axis) for two flowcells (each in a different colour), with the yield of all reads shown in the upper panel, and the yield of reads with a mean Q score above the user-specified threshold of 7 in the lower panel, vertical red dashed lines indicate the timing of group changes (also known as muxes); (C) Yield in bases (y-axis) for a given minimum read length (x-axis), for two flowcells (each in a different colour), panels are as in B (Color version of this figure is available at Bioinformatics online.)

References

    1. Austin C.M. et al. (2017) De novo genome assembly and annotation of Australia's largest freshwater fish, the Murray cod (Maccullochella peelii), from Illumina and Nanopore sequencing read. Gigascience, 6, 1. 6. - PMC - PubMed
    1. Davis T.L. (2018) Optparse: Command Line Option Parser. R Package Version 1.6.0. CRAN: the Comprehensive R Archive Network.
    1. De Coster W. et al. (2018) NanoPack: visualizing and processing long read sequencing data. Bioinformatics, 25, 1422. - PMC - PubMed
    1. Dowle M., Srinivasan A. (2018) Data.table: extension of ‘Data.frame’ R Package Data.table Version 1.11.4 CRAN: The Comprehensive R Archive Network.
    1. Garnier S. (2018) Viridis: default Color Maps from ‘matplotlib’ R Package Version 0.5.1. CRAN: the Comprehensive R Archive Network.

Publication types