. 2018 Nov 2;46(19):10007-10018.
doi: 10.1093/nar/gky661.

Cancer-associated mutations of histones H2B, H3.1 and H2A.Z.1 affect the structure and stability of the nucleosome

Affiliations

Cancer-associated mutations of histones H2B, H3.1 and H2A.Z.1 affect the structure and stability of the nucleosome

Yasuhiro Arimura et al. Nucleic Acids Res. .

Abstract

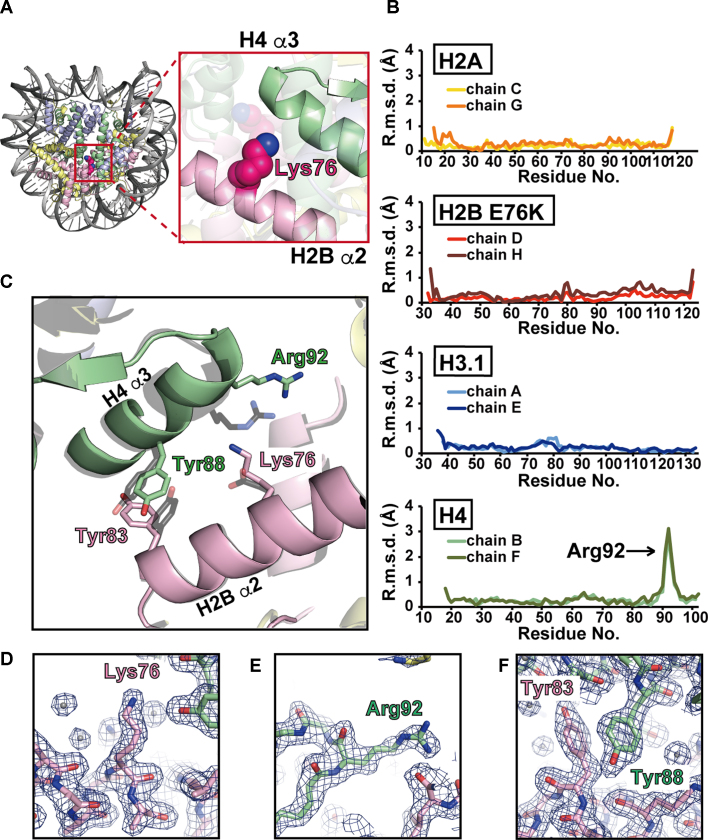
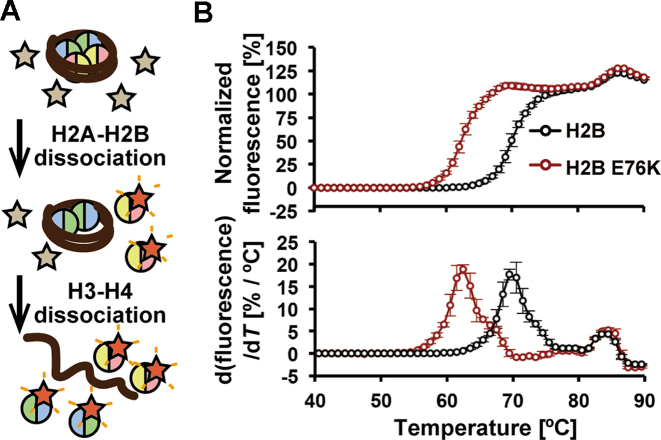
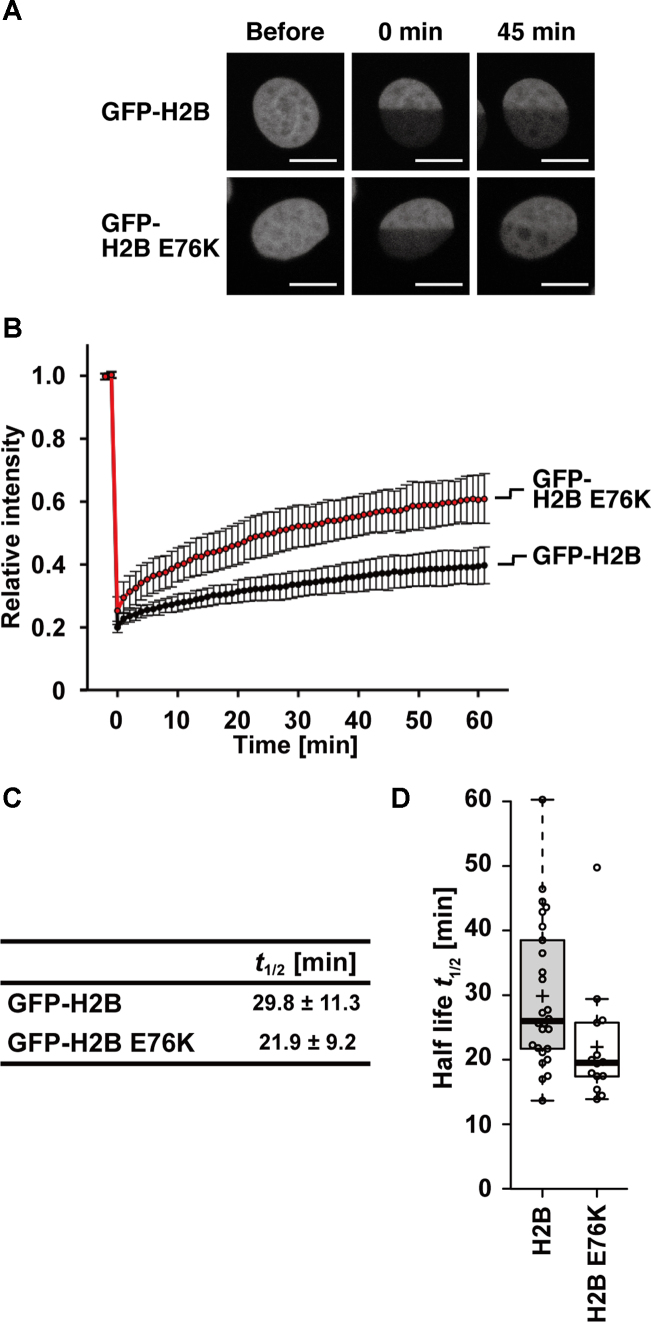
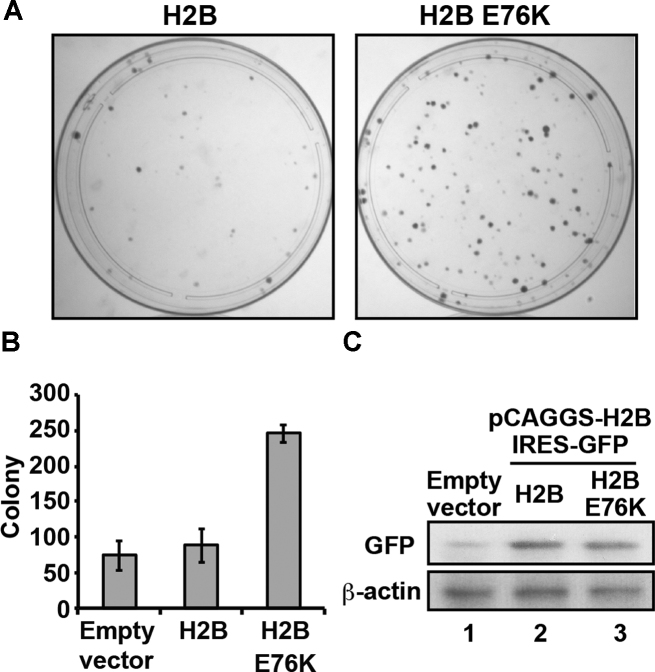
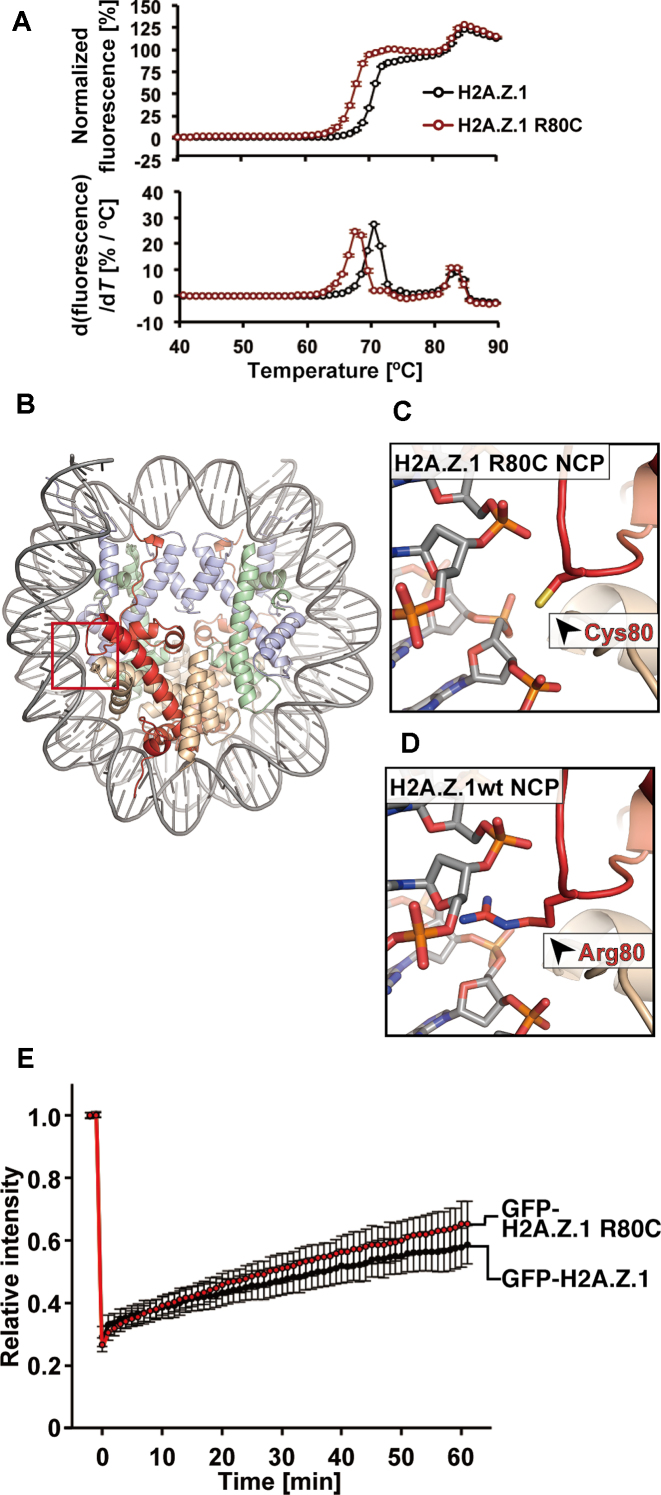
Mutations of the Glu76 residue of canonical histone H2B are frequently found in cancer cells. However, it is quite mysterious how a single amino acid substitution in one of the multiple H2B genes affects cell fate. Here we found that the H2B E76K mutation, in which Glu76 is replaced by Lys (E76K), distorted the interface between H2B and H4 in the nucleosome, as revealed by the crystal structure and induced nucleosome instability in vivo and in vitro. Exogenous production of the H2B E76K mutant robustly enhanced the colony formation ability of the expressing cells, indicating that the H2B E76K mutant has the potential to promote oncogenic transformation in the presence of wild-type H2B. We found that other cancer-associated mutations of histones, H3.1 E97K and H2A.Z.1 R80C, also induced nucleosome instability. Interestingly, like the H2B E76K mutant, the H3.1 E97K mutant was minimally incorporated into chromatin in cells, but it enhanced the colony formation ability. In contrast, the H2A.Z.1 R80C mutant was incorporated into chromatin in cells, and had minor effects on the colony formation ability of the cells. These characteristics of histones with cancer-associated mutations may provide important information toward understanding how the mutations promote cancer progression.


Figures

Figure 1.
Figure 1.
Crystal structure of the H2B E76K nucleosome. (A) Left panel: overall structure of the H2B E76K nucleosome. The H2A, H2B E76K, H3.1 and H4 molecules are colored yellow, pink, blue and green, respectively. Right panel: close-up view around the Lys76 residue of H2B E76K. (B) The H2B E76K substitution significantly changed the backbone geometry around Arg92 of H4. The root mean square deviation (r.m.s.d.) values between the corresponding Cα atoms of the H2B E76K and wild-type H2B molecules in the nucleosomes are plotted against the amino acid residues. Two H2A molecules (chains C and G), two H2B molecules (chains D and H), two H3.1 molecules (chains A and E) and two H4 molecules (chains B and F) in the nucleosomes were independently compared. (C) The structures around the H2B Lys76 residue of the nucleosomes. The H4 and H2B molecules in the H2B E76K nucleosome are colored green and pink, respectively. The H4 and H2B molecules in the wild-type H2B nucleosome are colored gray. The structures of the H2B E76K and wild-type H2B nucleosomes are superimposed. (DF) Close-up views of the Lys76 residue of H2B E76K (D), the Arg92 residue of H4 (E) and the Tyr83 residue of H2B E76K (F) in the H2B E76K nucleosome. Electron density maps are presented at the 1.0σ level.
Figure 2.
Figure 2.
The H2B E76K nucleosome is extremely unstable. (A) Schematic representation of the nucleosome thermal stability assay. In this assay, the histones that thermally dissociate from the nucleosome are detected with SYPRO Orange, as a fluorescent probe. In the first step, H2A-H2B dissociates from the nucleosome and is detected by the fluorescence of SYPRO Orange. In the second step, H3-H4 dissociates from the nucleosome and is detected in a similar manner. (B) Thermal stability assay with the H2B wild-type and H2B E76K nucleosomes. The upper panel shows the thermal stability curves of the H2B wild-type (black) and H2B E76K (red) nucleosomes. The bottom panel shows the differential values of the thermal stability curves presented in the upper panel. Means ± s.d. (n = 3) are shown.
Figure 3.
Figure 3.
The H2A-H2B E76K dimer is defective in H3-H4 binding. (A) Superdex 200 gel filtration chromatography. The red line indicates the elution profile of the H2A-H2B E76K dimer and the H3-H4 tetramer. The black line indicates the elution profile of the H2A-H2B dimer and the H2A-H2B-H3-H4 complexes. (B and C) SDS-PAGE analyses of the elution fractions from the gel filtration chromatography shown in panel A. The experiments with wild-type H2B and H2B E76K are presented in panels B and C, respectively. The gels were stained with CBB. The full gel images of Figure 3B and C are shown in Supplementary Figures S13A and B, respectively.
Figure 4.
Figure 4.
Mobility of GFP-H2B E76K in living cells. (A) Representative fluorescence images of HeLa cell nuclei producing GFP-H2B or GFP-H2B E76K, before and after photobleaching. One-half of the nuclei were bleached using a 488-nm laser. Bars, 10 μm. (B) Relative fluorescence intensity of the bleached area, normalized by the unbleached areas. Intensities were obtained from 2 min before photobleaching to 60 min after photobleaching. Averages with standard deviations are plotted (n = 28 and 22 for GFP-H2B and GFP-H2B E76K respectively). (C) The half-lives of GFP-H2B and GFP-H2B E76K were estimated from the averages of FRAP curves of 26 and 14 cells for GFP-H2B and GFP-H2B E76K, respectively. (D) Box plots of the half-lives of GFP-H2B and GFP-H2B E76K FRAP curves.
Figure 5.
Figure 5.
Exogenous H2B E76K production enhances malignant transformation of cells. (A) Colony formation assay with NIH3T3 cells expressing H2B or H2B E76K. Representative images are shown. Three independent experiments were performed, and similar results were obtained. (B) Graphic representation of the experiments shown in panel A. The colony numbers of cells expressing H2B or H2B E76K are plotted. Means ± s.d. (n = 3) are shown. (C) Western blotting analyses. The production of exogenous H2B and H2B E76K was detected by western blotting, using the α-GFP polyclonal antibody (upper panel). In this system, GFP was simultaneously produced with H2B or H2B E76K, from a polycistronic gene. For loading controls, endogenous β-actin was detected by western blotting using the anti-β-actin antibody (lower panel). The full images of the western blots are shown in Supplementary Figures S13C and D.
Figure 6.
Figure 6.
The H3.1 E97K mutation destabilizes the nucleosome and the histone complex. (A) Thermal stability assays of the H3.1 wild-type and H3.1 E97K nucleosomes. The upper panel shows the thermal stability curves of the H3.1 wild-type (black) and H3.1 E97K (red) nucleosomes. The bottom panel shows the differential values of the thermal stability curves presented in the upper panel. Means ± s.d. (n = 3) are shown. (B) Superdex 200 gel filtration chromatography. The red line indicates the elution profile of the H2A-H2B dimer and the H3.1 E97K-H4 tetramer. The black line indicates the elution profile of the H2A-H2B dimer and the H2A-H2B-H3-H4 complexes. (C and D) SDS-PAGE analyses of the elution fractions from the gel filtration chromatography shown in panel B. The experiments with wild-type H3.1 and H3.1 E97K are presented in panels C and D, respectively. The gels were stained with CBB. The full gel images of Figure 6C and D are shown in Supplementary Figure S13E and F, respectively. (E) Localization of GFP-H3.1 and GFP-H3.1 E97K in interphase and mitotic HeLa cells. Fluorescent (GFP) and bright-field (BF) images are shown with the merged images (merge). GFP-H3.1 E97K does not localize to the mitotic chromosomes. Bars, 10 μm. (F) Photobleaching assay. Bleaching a half of nucleus as in Figure 4 resulted in loss of fluorescence in GFP-H3.1 E97K because of a long bleaching period, during which free molecules are in and out of the bleached area. Therefore, a rapid imaging and bleaching assay was employed to evaluate the incorporation of GFP-H3.1 proteins. The relative intensity of bleached area was measured at ∼−2.0, −1.0, −0.0, 0.1, 0.3, 0.6, 1.0, 2.0, 3.0 and 4.0 s after bleaching. Averages with standard deviations are plotted (n = 17 and 15 for GFP-H3.1 and GFP-H3.1 E97K, respectively). The intensity of GFP-H3.1 E97K recovered to almost the original level within a few seconds, indicating that this H3.1 mutant is not stably incorporated into nucleosomes. A substantial recovery of wild-type H3.1 with a huge deviation was also observed. This high cell-to-cell variation of the rapidly recovered fraction likely reflects the amount of free GFP-H3.1 in cells at different cell cycle stages, as reported previously (32).
Figure 7.
Figure 7.
The H2A.Z.1 R80C mutation destabilizes the nucleosome. (A) Thermal stability assay with the H2A.Z.1 wild-type and H2A.Z.1 R80C nucleosomes. The upper panel shows the thermal stability curves of the H2A.Z.1 wild-type (black) and H2A.Z.1 R80C (red) nucleosomes. The bottom panel shows the differential values of the thermal stability curves presented in the upper panel. Means ± s.d. (n = 3) are shown. (B) Overall crystal structure of the H2A.Z.1 R80C nucleosome. The H2A.Z.1 R80C, H2B, H3.1 and H4 molecules are colored red, orange, light blue and light green, respectively. (C) A close-up view around the Cys80 residue of H2A.Z.1 R80C in the H2A.Z.1 R80C nucleosome. (D) A close-up view around the Arg80 residue of H2A.Z.1 in the H2A.Z.1 wild-type nucleosome (PDB ID: 3WA9) (26). (E) Relative fluorescence intensity of the bleached area, normalized by the unbleached areas. Intensities were obtained from 2 min before photobleaching to 60 min after photobleaching. Averages with standard deviations are plotted (n = 24 and 20 for GFP-H2A.Z.1 and GFP-H2A.Z.1 R80C, respectively).

References

    1. Luger K., Mäder A.W., Richmond R.K., Sargent D.F., Richmond T.J.. Crystal structure of the nucleosome core particle at 2.8 Å resolution. Nature. 1997; 389:251–260. - PubMed
    1. Tan S., Davey C.A.. Nucleosome structural studies. Curr. Opin. Struct. Biol. 2011; 21:128–136. - PMC - PubMed
    1. Tagami H., Ray-Gallet D., Almouzni G., Nakatani Y.. Histone H3.1 and H3.3 complexes mediate nucleosome assembly pathways dependent or independent of DNA synthesis. Cell. 2004; 116:51–61. - PubMed
    1. Marzluff W.F., Gongidi P., Woods K.R., Jin J., Maltais L.J.. The human and mouse replication-dependent histone genes. Genomics. 2002; 80:487–498. - PubMed
    1. Talbert P.B., Ahmad K., Almouzni G., Ausió J., Berger F., Bhalla P.L., Bonner W.M., Cande W.Z., Chadwick BP, Chan S.W. et al. . A unified phylogeny-based nomenclature for histone variants. Epigenet. Chromatin. 2012; 5:7. - PMC - PubMed

Publication types