. 2018 Sep 14;69(20):4881-4895.
doi: 10.1093/jxb/ery276.

Response of Arabidopsis primary metabolism and circadian clock to low night temperature in a natural light environment

Affiliations

Response of Arabidopsis primary metabolism and circadian clock to low night temperature in a natural light environment

Maria Grazia Annunziata et al. J Exp Bot. .

Abstract

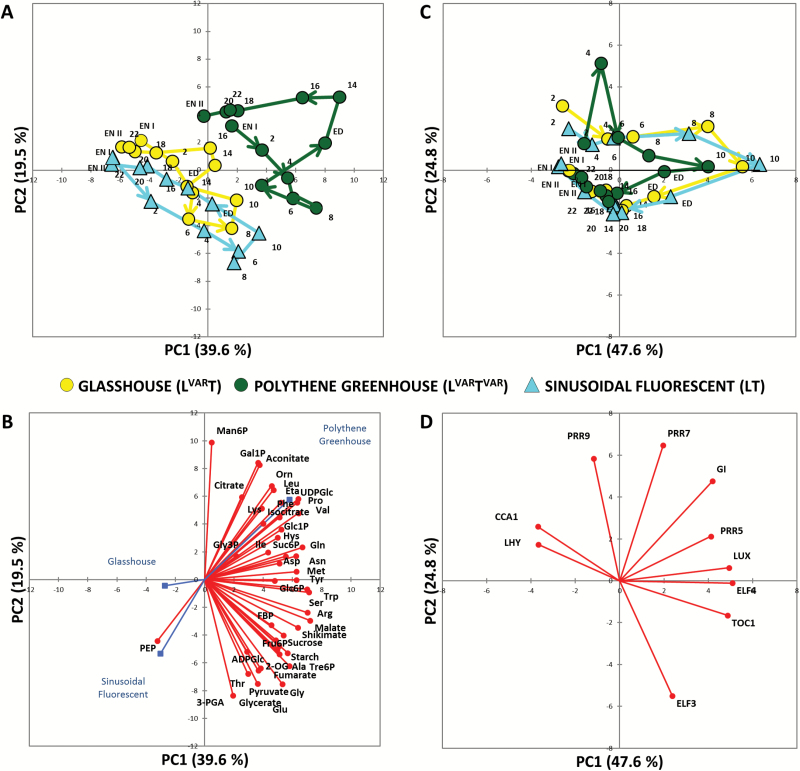
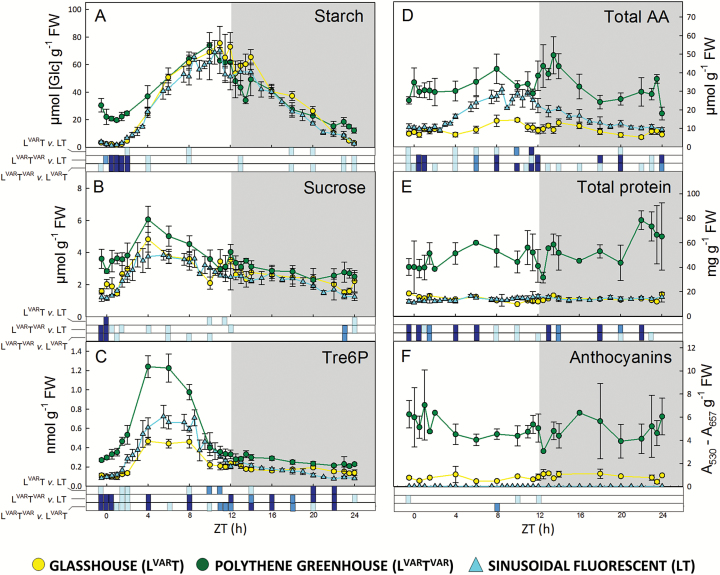
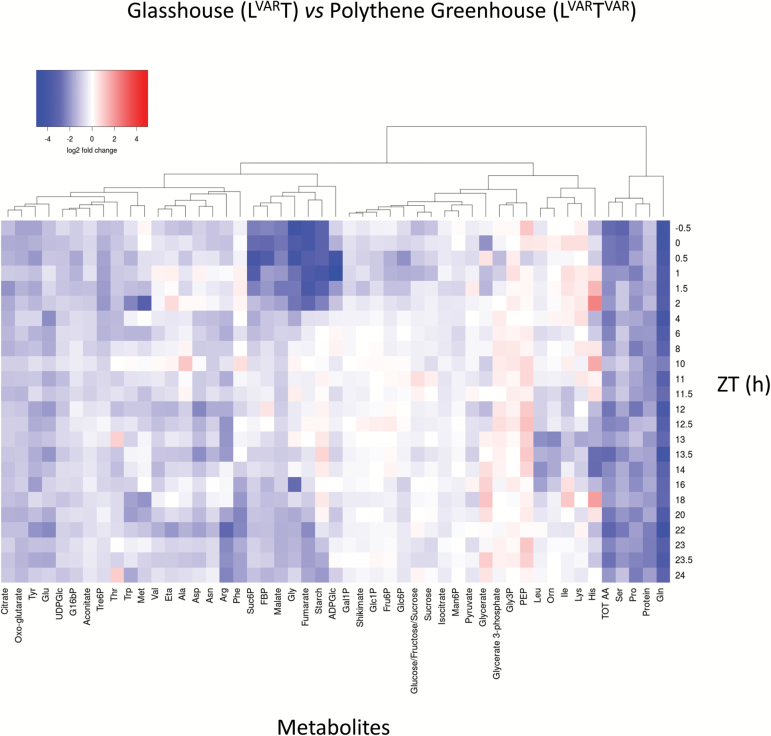
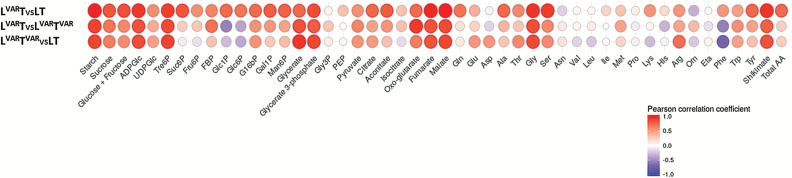
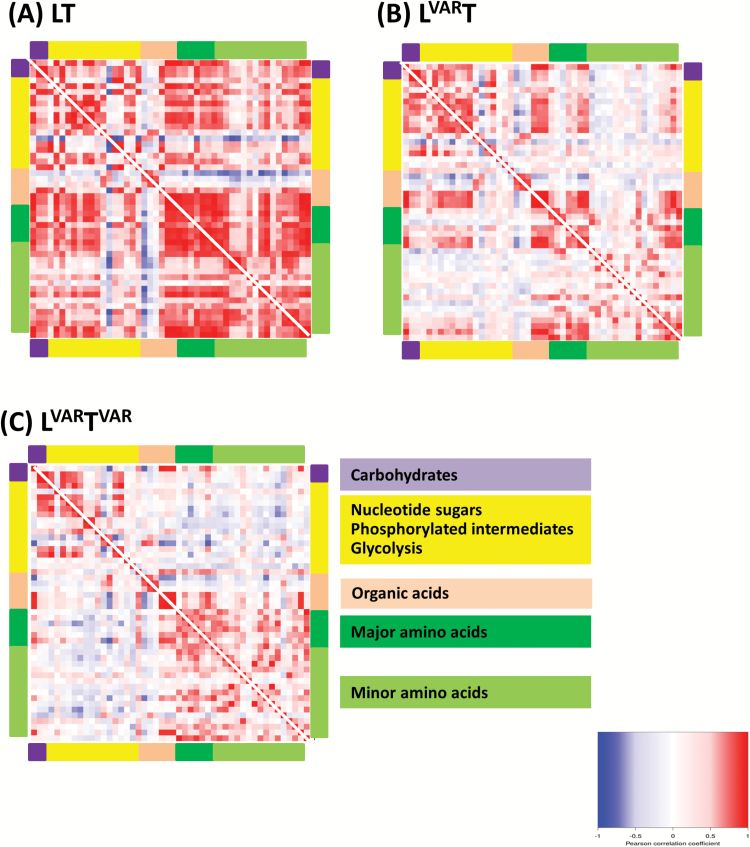
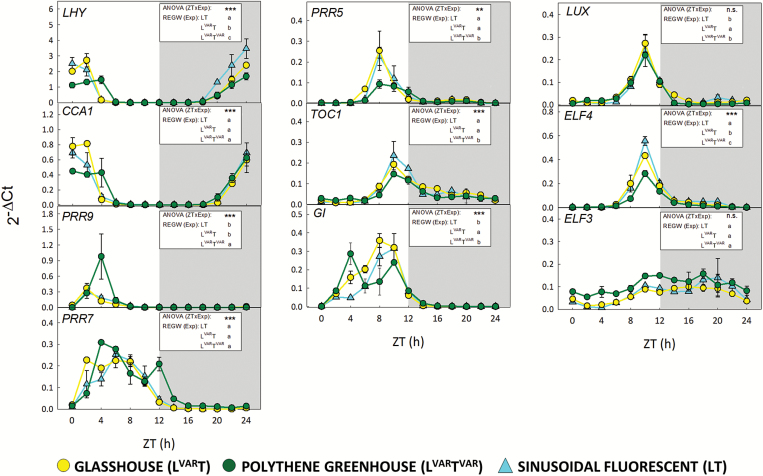
Plants are exposed to varying irradiance and temperature within a day and from day to day. We previously investigated metabolism in a temperature-controlled greenhouse at the spring equinox on both a cloudy and a sunny day [daily light integral (DLI) of 7 mol m-2 d-1 and 12 mol m-2 d-1]. Diel metabolite profiles were largely captured in sinusoidal simulations at similar DLIs in controlled-environment chambers, except that amino acids were lower in natural light regimes. We now extend the DLI12 study by investigating metabolism in a natural light regime with variable temperature including cool nights. Starch was not completely turned over, anthocyanins and proline accumulated, and protein content rose. Instead of decreasing, amino acid content rose. Connectivity in central metabolism, which decreased in variable light, was not further weakened by variable temperature. We propose that diel metabolism operates better when light and temperature are co-varying. We also compared transcript abundance of 10 circadian clock genes in this temperature-variable regime with the temperature-controlled natural and sinusoidal light regimes. Despite temperature compensation, peak timing and abundance for dawn- and day-phased genes and GIGANTEA were slightly modified in the variable temperature treatment. This may delay dawn clock activity until the temperature rises enough to support rapid metabolism and photosynthesis.


Figures

Fig. 1.
Fig. 1.
Principal component analysis (PCA) of metabolite and core circadian clock gene data from Arabidopsis plants. PCA of metabolite data (A) and of core clock genes (C) from plants grown around the vernal equinox in 2015 in a naturally illuminated and temperature-controlled glasshouse (LVART, yellow circles) or a naturally illuminated polythene greenhouse with a less controlled temperature (LVARTVAR, green circles). Plants were also grown in a controlled-environment chamber with a 12 h photoperiod and daily light integral (DLI) of 12 mol m−2 d−1. The artificial illumination was provided by white fluorescent tubes with a sinusoidal (LT, cyan triangles) light profile during the day. Numbers indicate the time of harvest in hours after dawn (Zeitgeber time, ZT); ED, end of day (ZT12); EN I, end of preceding night (ZT0); EN II, end of night (ZT24); and the diurnal trajectories are indicated by arrows. The percentages of total variance represented by principal component 1 (PC1) and principal component 2 (PC2) are shown in parentheses. (B and D) The loadings of individual metabolites or genes in PC1 and PC2. FBP, fructose 1,6-bisphosphate; Eta, ethanolamine; Orn, ornithine.
Fig. 2.
Fig. 2.
Diurnal profiles of metabolites in Arabidopsis plants growing in natural or fluorescent light with a 12 h photoperiod at DLI 12. Arabidopsis thaliana Col-0 plants were grown in a naturally illuminated and temperature-controlled glasshouse (LVART, yellow circles) or a naturally illuminated polythene greenhouse with a less controlled temperature (LVARTVAR, green circles) around the vernal equinox in 2015. Plants were also grown in a controlled-environment chamber with a 12 h photoperiod and DLI of 12 mol m−2 d−1. Artificial illumination was provided by white fluorescent tubes with a sinusoidal light profile (LT, cyan triangles). Rosettes were harvested from 4-week-old plants throughout a 24 h diurnal cycle for analysis of: (A) starch, (B) sucrose, (C) Tre6P, (D) total amino acids, (E) total protein, and (F) anthocyanins. Data are the mean ±SD (n=4). At each time point, significant differences between each pair of growth regimes are indicated by different colours: P<0.05=light blue, P<0.01=blue, P<0.001=dark blue. ZT, Zeitgeber time (hours after dawn).
Fig. 3.
Fig. 3.
Log2 fold changes of the relative metabolic content are presented as a heat map of glasshouse (LVART) versus polythene greenhouse (LVARTVAR). Data are clustered based on hierarchical agglomerative clustering with complete linkage. Colour key: low values, blue; high values, red. FBP, fructose 1,6-bisphosphate; Eta, ethanolamine; Orn, ornithine.
Fig. 4.
Fig. 4.
Correlation analysis of pair-wise comparison of metabolite time series. A Pearson correlation coefficient was calculated for each pair of conditions based on the positive or negative correlation between the metabolite profiles over the entire light–dark cycle. The Pearson correlation coefficient ranges from –1 (blue) to 1 (red), with –1 indicating higher negative correlation and 1 indicating higher positive correlation between the two compared data sets. FBP, fructose 1,6-bisphosphate; Eta, ethanolamine; Orn, ornithine.
Fig. 5.
Fig. 5.
Connectivity in metabolism in different growth regimes. In a given growth regime, each metabolite diel time series was regressed against every other metabolite diel time series. The results are presented as a heat map with Pearson correlation coefficients (R) indicated by the shading: red, positive correlation; blue, negative correlation. The colour scale is logarithmic and was chosen such that the majority of non-significant correlations (P<0.05) were not assigned any colour. Metabolites are grouped by pathway indicated by the coloured bars at the side of the heat maps. Expanded displays with information on individual metabolites are provided in Supplementary Fig. S6.
Fig. 6.
Fig. 6.
Diurnal gene expression of core circadian clock genes in Arabidopsis plants growing in natural or fluorescent light with a 12 h photoperiod at DLI 12. Arabidopsis thaliana Col-0 plants were grown in a naturally illuminated and temperature-controlled glasshouse (LVART, yellow circles) or a naturally illuminated polythene greenhouse with a less controlled temperature (LVARTVAR, green circles) around the vernal equinox in 2015. Plants were also grown in a controlled-environment chamber with a 12 h photoperiod and DLI of 12 mol m−2 d−1. Artificial illumination was provided by white fluorescent tubes with a sinusoidal light profile (LT, cyan triangles). Rosettes were harvested from 4-week-old plants throughout a 24 h diurnal cycle for expression analysis of core clock genes. The relative expression values were calculated as 2−ΔCt for each sample where ΔCt indicates the difference from the Ct values of the different tested genes and the geometric mean of the Ct values of all reference genes. Data are the mean ±SD (n=2) and are shown on a linear scale. Two-way ANOVA (proc GLM, SAS 9.4) was performed on each gene for the factors sampling time (ZT), experimental condition (Exp), and their interaction effect (ZT×Exp). Significances of the interaction effect [ANOVA (ZTxExp)] are shown in each panel indicated by asterisks: **P<0.001, ***P=0.0001, n.s.=not significant. Pairwise comparison for each gene for the means of the factor Exp [REGW (Exp)] is also shown in each panel. Significant differences are indicated by different letters. See Supplementary Table S7 for detailed description of the statistical procedures, and Supplementary Figs S9 and S10 for a display and tests on peak times. ZT, Zeitgeber time (hours after dawn), Exp, experimental treatment. LHY, LATE ELONGATED HYPOCOTYL; CCA1, CIRCADIAN CLOCK ASSOCIATED1; PRR9, PRR7, PRR5, PSEUDO-RESPONSE REGULATOR9, 7, and 5; TOC1, TIMING OF CAB EXPRESSION1; GI, GIGANTEA; LUX, LUX ARRHYTHMO; ELF4, ELF3, EARLY FLOWERING4 and 3.

Comment in

References

    1. Annunziata MG, Apelt F, Carillo P, et al. . 2017. a Getting back to nature: a reality check for experiments in controlled environments. Journal of Experimental Botany 68, 4463–4477. - PMC - PubMed
    1. Annunziata MG, Ciarmiello LF, Woodrow P, Maximova E, Fuggi A, Carillo P. 2017b Durum wheat roots adapt to salinity remodeling the cellular content of nitrogen metabolites and sucrose. Frontiers in Plant Science 7, 2035. - PMC - PubMed
    1. Apelt F, Breuer D, Nikoloski Z, Stitt M, Kragler F. 2015. Phytotyping4D: a light-field imaging system for non-invasive and accurate monitoring of spatio-temporal plant growth. The Plant Journal 82, 693–706. - PubMed
    1. Apelt F, Breuer D, Olas JJ, Annunziata MG, Flis A, Nikoloski Z, Kragler F, Stitt M. 2017. Circadian, carbon, and light control of expansion growth and leaf movement. Plant Physiology 174, 1949–1968. - PMC - PubMed
    1. Atkin OK, Tjoelker MG. 2003. Thermal acclimation and the dynamic response of plant respiration to temperature. Trends in Plant Science 8, 343–351. - PubMed

Publication types