. 2018 Jul 26;174(3):672-687.e27.
doi: 10.1016/j.cell.2018.06.017.

Isolation of a Structural Mechanism for Uncoupling T Cell Receptor Signaling from Peptide-MHC Binding

Affiliations

Isolation of a Structural Mechanism for Uncoupling T Cell Receptor Signaling from Peptide-MHC Binding

Leah V Sibener et al. Cell. .

Abstract

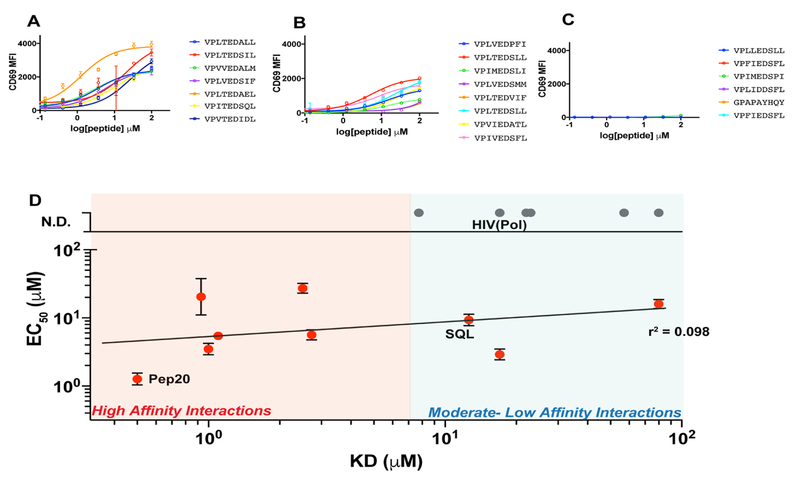
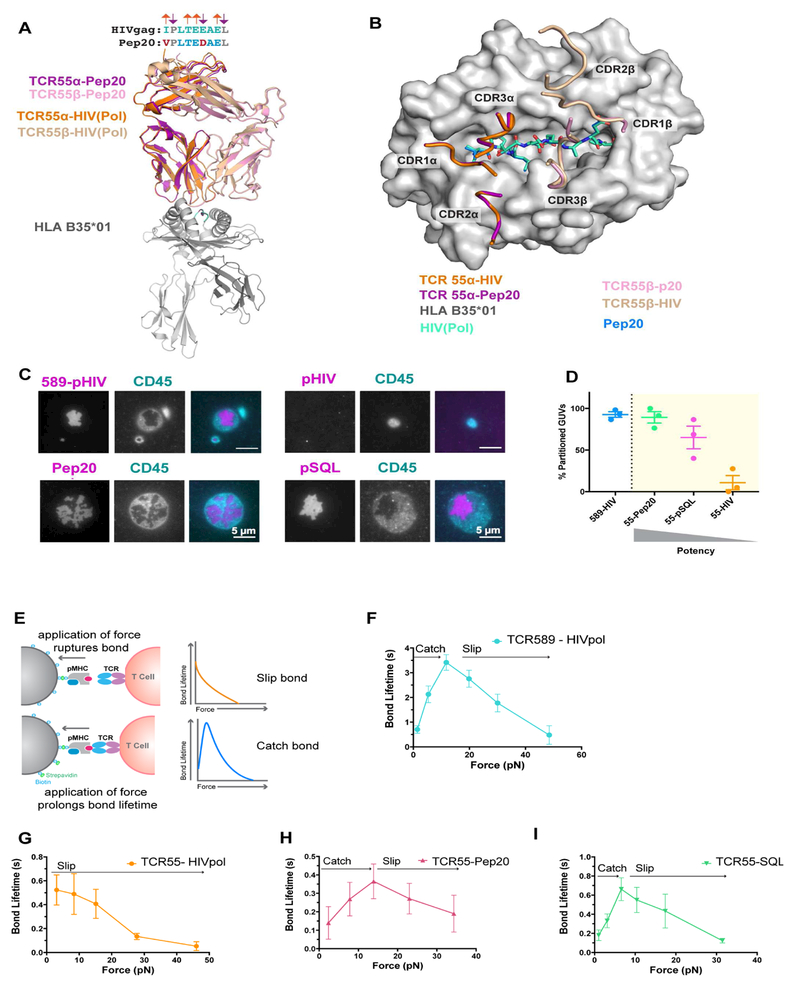
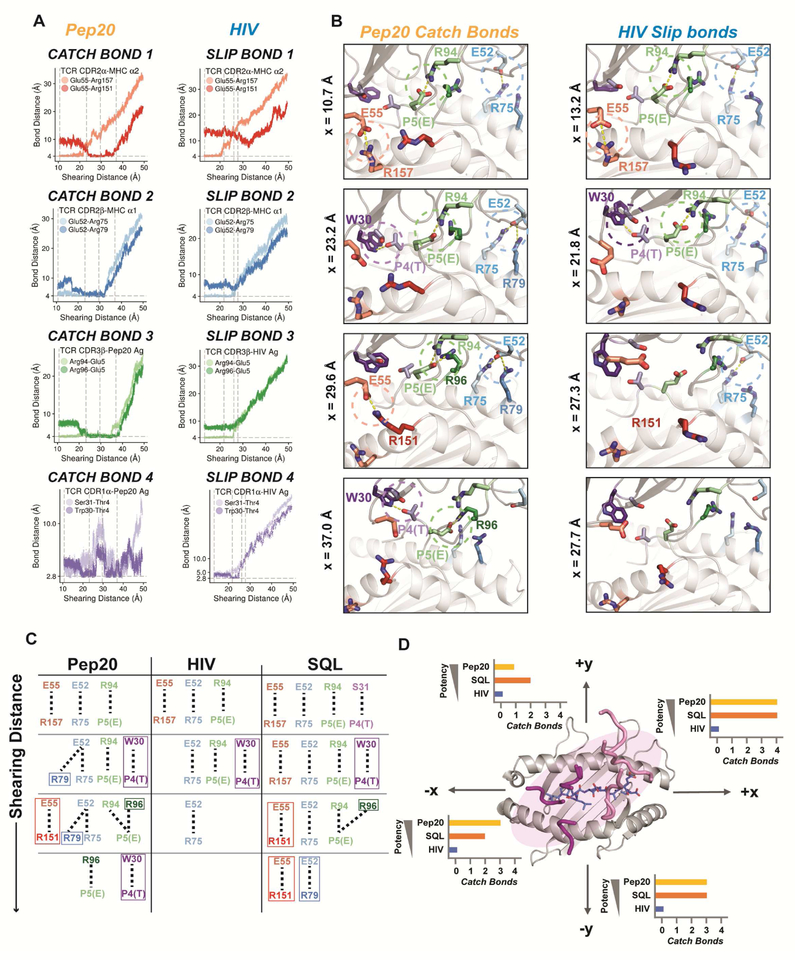
TCR-signaling strength generally correlates with peptide-MHC binding affinity; however, exceptions exist. We find high-affinity, yet non-stimulatory, interactions occur with high frequency in the human T cell repertoire. Here, we studied human TCRs that are refractory to activation by pMHC ligands despite robust binding. Analysis of 3D affinity, 2D dwell time, and crystal structures of stimulatory versus non-stimulatory TCR-pMHC interactions failed to account for their different signaling outcomes. Using yeast pMHC display, we identified peptide agonists of a formerly non-responsive TCR. Single-molecule force measurements demonstrated the emergence of catch bonds in the activating TCR-pMHC interactions, correlating with exclusion of CD45 from the TCR-APC contact site. Molecular dynamics simulations of TCR-pMHC disengagement distinguished agonist from non-agonist ligands based on the acquisition of catch bonds within the TCR-pMHC interface. The isolation of catch bonds as a parameter mediating the coupling of TCR binding and signaling has important implications for TCR and antigen engineering for immunotherapy.

Keywords: CD45; MHC; TCR; catch bond; ligand discrimination; molecular dynamics; signaling; structure.


Conflict of interest statement

Declaration of Interests:

LVS, MHG, and KCG are co-founders of 3T Biosciences.

Figures

Figure 1.
Figure 1.. Observation of non-agonist interactions in vivo.
(A) Schematic depiction of the experimental approach used to identify non-agonist interactions. (B) Tetramer staining of T cell clones with DR4-HIV(Gag164–183) and DR4-HA (background control) (C) CFSE dilution of T cell clones stimulated with cognate antigen HIV (blue) and an irrelevant HA peptide (gray) (D) IL-2 and IFN production in response to HIV(Gag164–183). (E) TCR downregulation in response to HIV stimulation (red), CD3-CD28 beads (blue), PHA (gray). (B-E) TCR6 (Top), TCR11 (Bottom). (F) Representative HLA-A2-HCV(NS3) tetramer staining and (G) functional response by CD107a in T cell clones. (H) HLA A2-HY tetramer staining, and (I) functional response by CD107a. (F-I) Staining or stimulation with irrelevant pre-proinsulin (PPI) peptide represented in gray. (J) Summary of frequency of non-stimulatory clones from (Yu et al., 2015). (K) B35-HIV(Pol448–456) tetramer staining (100 nM) of transduced cell lines expressing TCR55 (orange), TCR589 (blue), or untransduced (gray). (L) IL-2 secretion by TCR55 (orange) or TCR589 (blue) transduced T cells. Representative data (n=3) is shown as mean±SD of technical triplicates. See also Figure S1.
Figure 2.
Figure 2.. Interrogating the biophysical parameters of non-agonist interactions.
(A) Schematic depiction of TCR-pMHC interaction. (B) SPR traces of TCR589 (blue; left) TCR55 (orange; middle) and equilibrium analysis (right) bound to B35-HIV(Pol448–456). (C) Representative images of B35-HIV(Pol448–456) (cyan) accumulation under cells expressing TCR55 (top), TCR589 (middle) or a null ligand (bottom). (D) The measured dwell time distributions for B35-HIV(Pol448–456) binding to TCR55 (orange) and TCR589 (blue); data shown as mean ± SEM of hundreds of measurements; See Movie S1. (E) Table of 3D and 2D measurements. (F) Structural overview and (G) footprint of the CDRs of TCR55 (orange, and tan), TCR589 (aqua, and cyan), bound to B35-HIV(Pol448–456) (gray and mint). (H) CDR interactions with HIV(Pol448–456) peptide; Van der Waals interactions shown in black, salt bridges in blue and hydrogen bonds in red. See also Figure S3, Tables S1, S2, Movie S1.
Figure 3.
Figure 3.. Characterization of impaired TCR55 signaling.
(A) CD69 upregulation of SKW3 cells expressing TCR55 (orange) or TCR589 (blue); representative experiment (n=3); data shown as mean ± SD of technical triplicates. (B) pERK signaling of T cell lines expressing TCR55 or TCR589 stimulated with 100 M B35-HIV(Pol448-456). (C) Representative dose response (n=3) of pERK signaling; data shown as mean ± SD of technical triplicates (D) Representative wide-field pseudo-colored images of two types of intracellular Ca2+ signaling for TCR55 (top) and TCR589 (bottom); scale bar represents 5 μm. (E) Representative single cell Fluo-4 fluorescence traces (left; top and bottom), temporal dynamics and quantification (right); data shown as mean ± SEM for n=3. (F) Maximum projection TIRF images of T cells expressing either TCR55 (top), or 589 (bottom) of Zap70 clustering when stimulated with B35-HIV(Pol448–456) functionalized SLBs and quantification; Total: TCR55 0/141 cells, TCR589 (215/239); data shown as mean ± SD for n=2 independent experiments (right). Related to Figure S3, Movie S2.
Figure 4.
Figure 4.. Design and selection of HLA-B35 yeast display library
(A) Design of HLA B35–9mer peptide library and selection scheme (B) cMyc tag enrichment for each round of selection (left) and post-4th round tetramer staining of cMyc+ population. (C) Comparison of total number of peptides and prevalence of 10 most abundant peptides for each round of selection. (D) Heatmap of amino acid frequency for TCR55. The sequence of HIV(Pol448–456) is represented by outlined boxes. TCR facing residues positions are shown in aqua, anchor positions in orange. Related to Figure S4.
Figure 5.
Figure 5.. Tuning TCR signaling potency with engineered ligands.
(A-C) CD69 upregulation on SKW3 T cells expressing TCR55 when stimulated with (A) agonists partial agonists (B) or non agonists (C); Representative data (n=3) is shown as mean ± SD (n=3). (D) 3D equilibrium KD vs EC50 of CD69 upregulation. r2 shown includes only peptides for which the EC50 could be determined. Related to Figure S5, see also Mendeley Data.
Figure 6.
Figure 6.. Agonist interactions form catch bonds and exclude CD45.
(A) Superimposition of TCR55 binding to B35-HIV(Pol448–456) (orange and tan) and B35-Pep20 (magenta and pink). (B) Overlay of TCR55 CDR footprint binding to Pep20 (marine) and HIV(Pol448–456) (teal). (C) Representative TIRF images of GUVs functionalized with TCR589 (upper left) or TCR55 (upper right, lower left and right) interacting with SLBs functionalized with B35-HIV(Pol448–456) (upper left and right), B35-Pep20 (lower left) or B35-pSQL (lower right; CD45 shown in cyan, pMHC magenta). (D) Percent of GUVs partitioning CD45 from pMHC (n=3 independent experiments); data shown as mean ± SEM (n= from 15 to 50 GUVs per condition). (E) Schematic of BFP assay and diagram of slip and catch bond curves. (F) Bond lifetime vs force curves for B35-HIV(Pol448–456) binding to TCR589 (aqua) or (G) TCR55 (orange). (H) Bond lifetime vs force curves for TCR55 binding to B35-Pep20 (pink) or (I) B35-pSQL (green). (F-I) Data shown as mean ± SEM of hundreds of individual bond lifetime measurements. Related to Figure S6, Table S1 and S2; see also Mendeley data.
Figure 7.
Figure 7.. Dynamic model of TCR-pMHC catch bond formation.
(A) Bond distance vs. shearing distance plots for the four catch bonds of TCR55-B35(Pep20) (left) or slip bonds of TCR55-B35(HIV) (right) under force in the +x direction. Horizontal gray dashed lines show the equilibrium distance for the bond. Vertical gray dashed lines correspond to the snapshots shown in (B). (B) Snapshots throughout the simulation of TCR55-B35(Pep20) (left) or TCR55-B35(HIV) (right) where, under force, new interactions are formed or initial interactions are ruptured. (C) Schematic of the evolution of TCR55 and Pep20 (left), HIV (middle) SQL (right) interactions under force. Newly formed interactions are highlighted in a box. (D) Summary of the number catch bonds formed by TCR55 dissociating from Pep20, HIV, or SQL in the ±x and ±y directions. Related to Figure S7 and Movies S3–S5; see also Mendeley Data.

References

    1. Adams JJ, Narayanan S, Liu B, Birnbaum ME, Kruse AC, Bowerman NA, Chen W, Levin AM, Connolly JM, Zhu C, et al. (2011). T cell receptor signaling is limited by docking geometry to peptide-major histocompatibility complex. Immunity 35, 681–693. - PMC - PubMed
    1. Adams PD, Afonine PV, Bunkoczi G, Chen VB, Davis IW, Echols N, Headd JJ, Hung LW, Kapral GJ, Grosse-Kunstleve RW, et al. (2010). PHENIX: a comprehensive Python-based system for macromolecular structure solution. Acta Crystallogr D Biol Crystallogr 66, 213–221. - PMC - PubMed
    1. Aleksic M, Dushek O, Zhang H, Shenderov E, Chen J-L, Cerundolo V, Coombs D, and van der Merwe PA (2010). Dependence of T cell antigen recognition on T cell receptor-peptide MHC confinement time. Immunity 32, 163–174. - PMC - PubMed
    1. Allison KA, Sajti E, Collier JG, Gosselin D, Troutman TD, Stone EL, Hedrick SM, and Glass CK (2016). Affinity and dose of TCR engagement yield proportional enhancer and gene activity in CD4+ T cells. eLife 5. - PMC - PubMed
    1. Beddoe T, Chen Z, Clements CS, Ely LK, Bushell SR, Vivian JP, Kjer-Nielsen L, Pang SS, Dunstone M.a., Liu YC, et al. (2009). Antigen ligation triggers a conformational change within the constant domain of the alphabeta T cell receptor. Immunity 30, 777–788. - PubMed

Publication types