. 2018 Aug 21;49(2):247-263.e7.
doi: 10.1016/j.immuni.2018.05.006. Epub 2018 Jul 24.

PD-1 Inhibitory Receptor Downregulates Asparaginyl Endopeptidase and Maintains Foxp3 Transcription Factor Stability in Induced Regulatory T Cells

Affiliations

PD-1 Inhibitory Receptor Downregulates Asparaginyl Endopeptidase and Maintains Foxp3 Transcription Factor Stability in Induced Regulatory T Cells

Chaido Stathopoulou et al. Immunity. .

Abstract

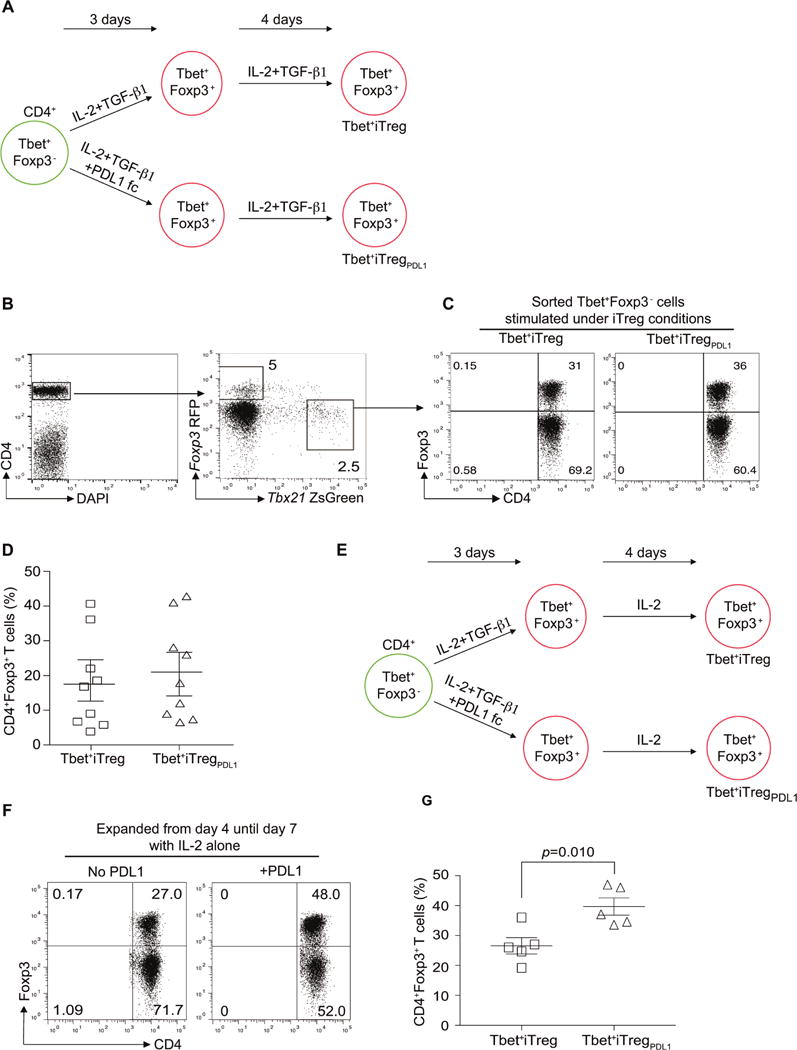
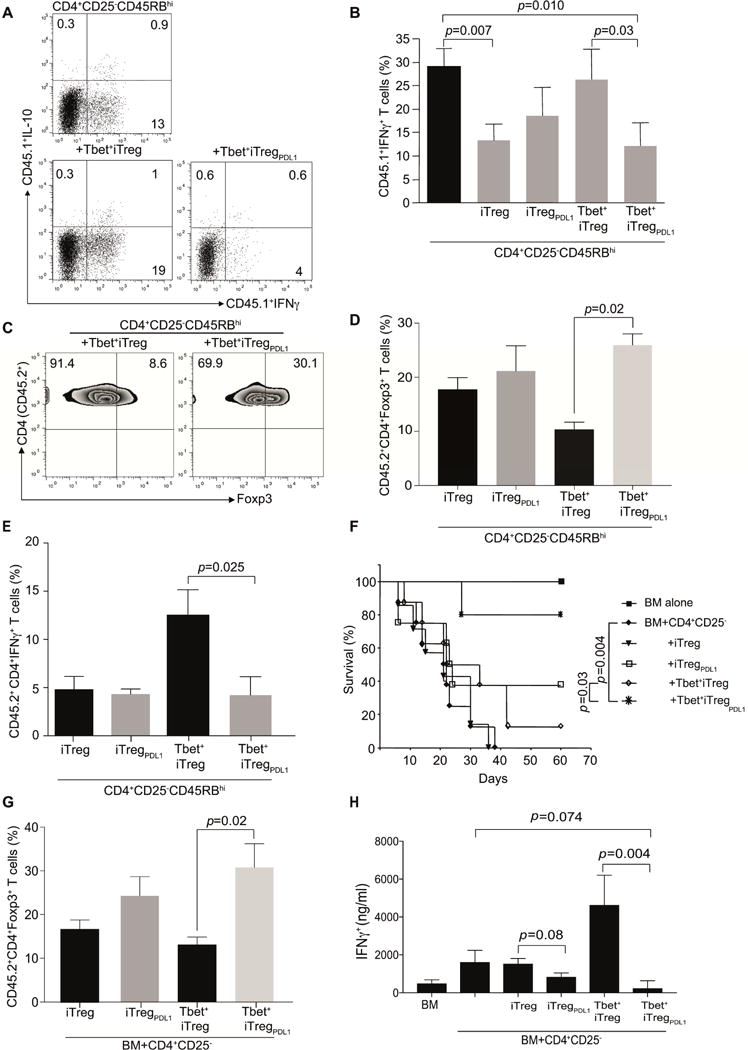
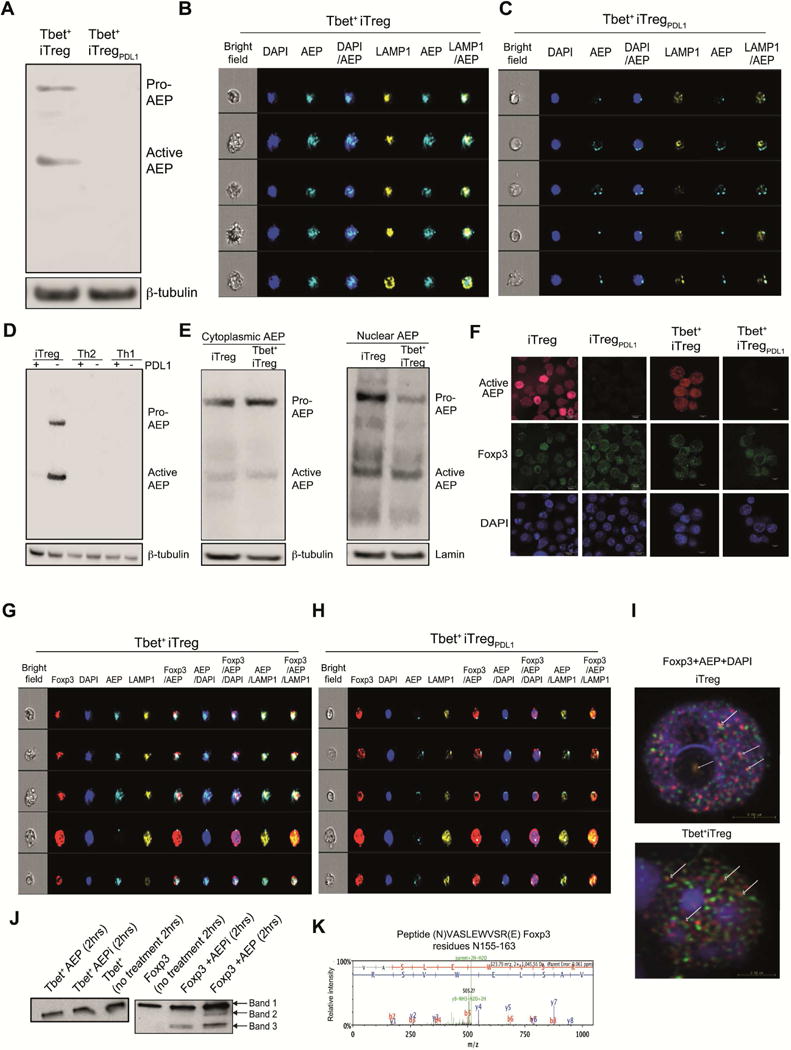
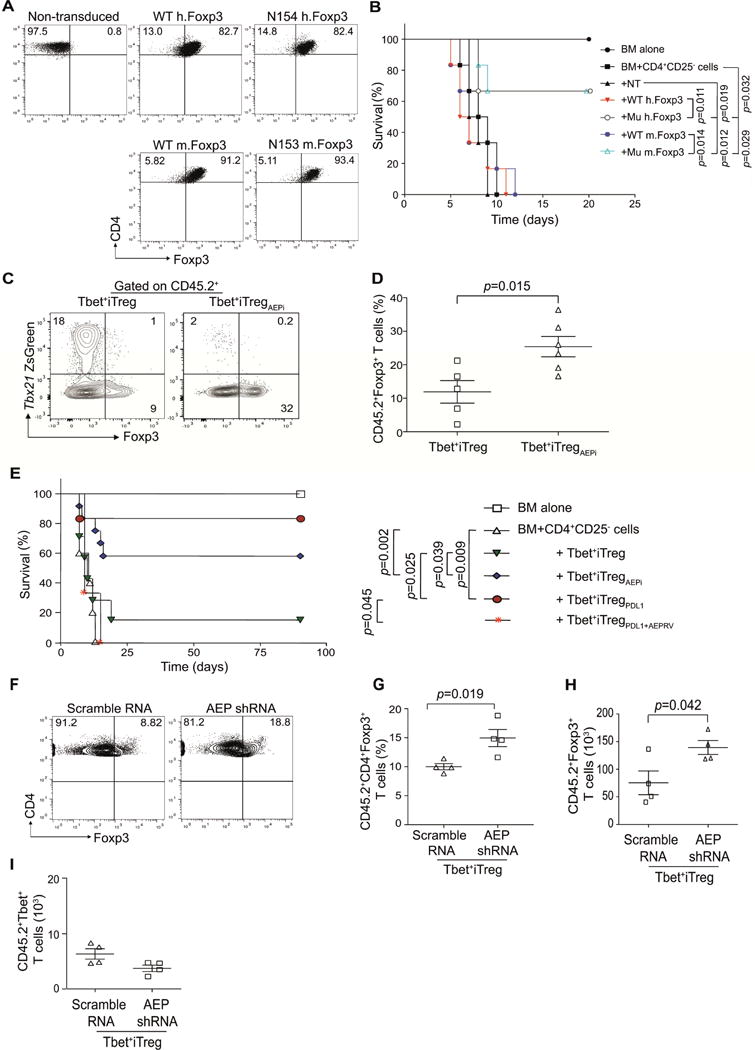
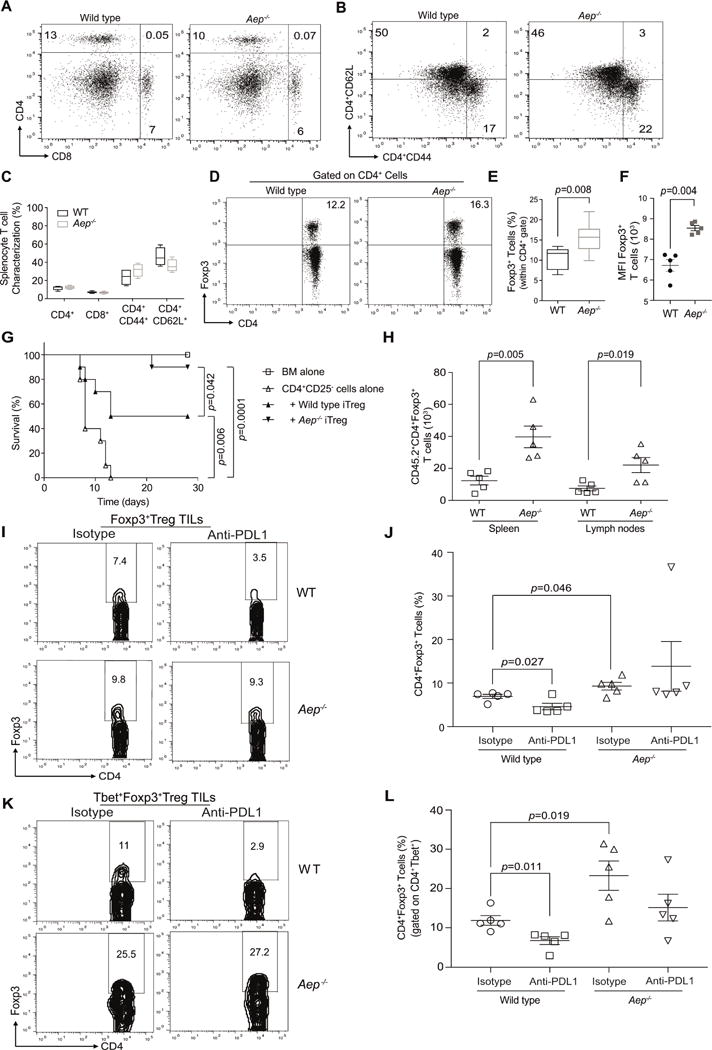
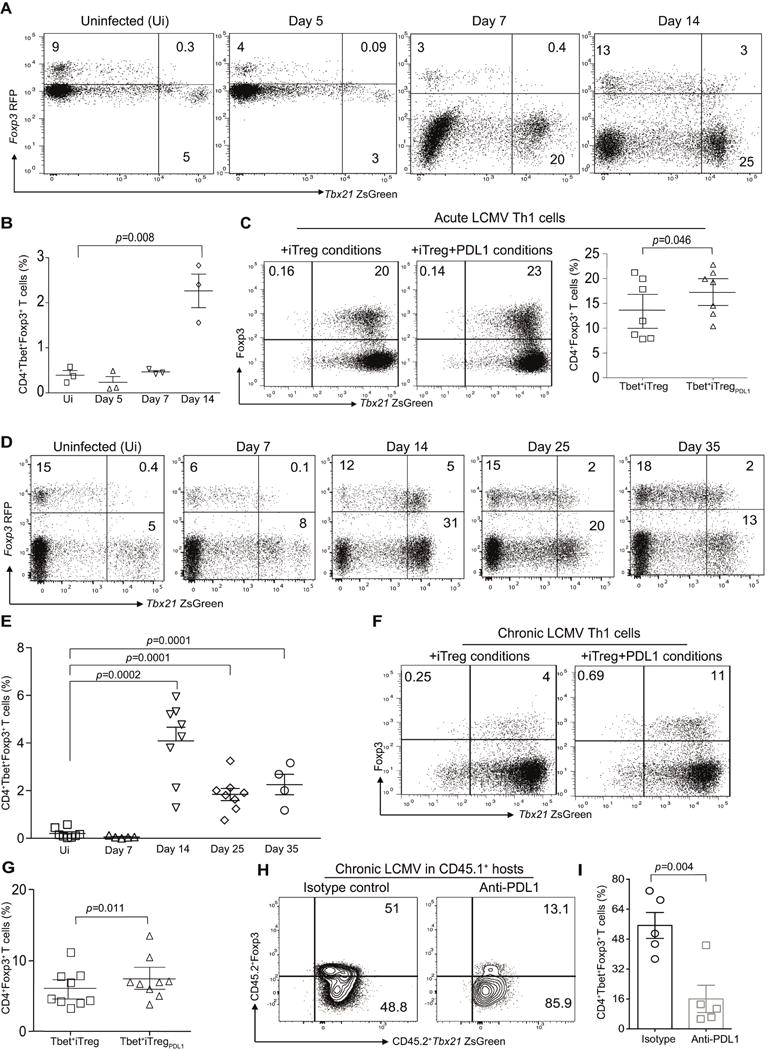
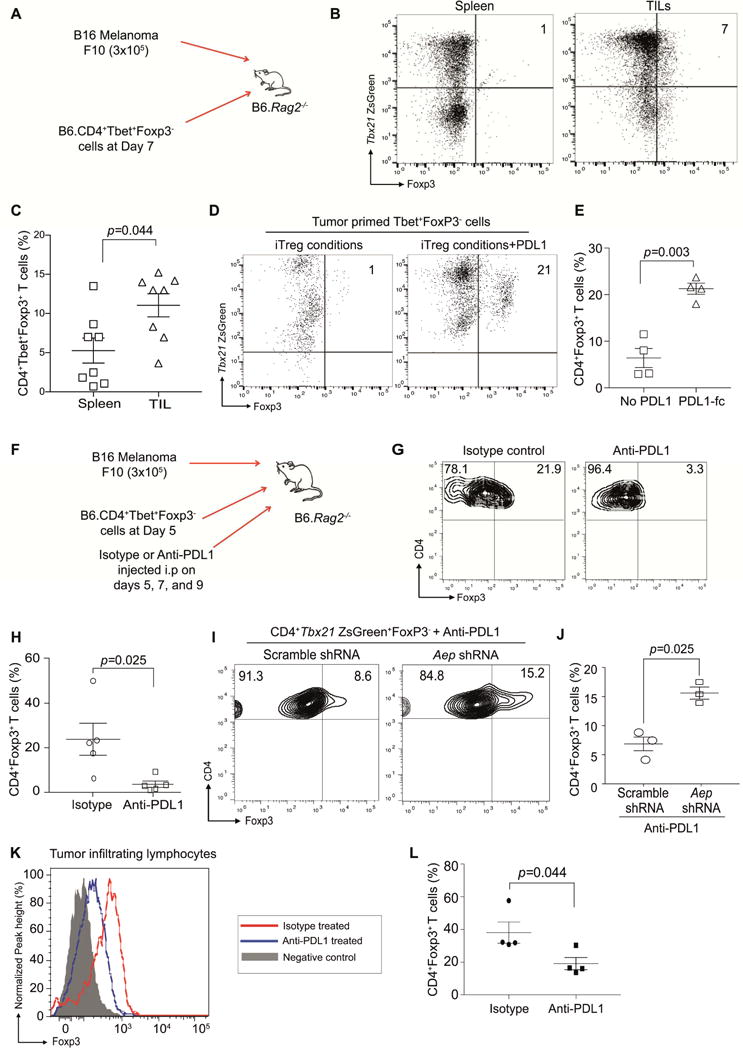
CD4+ T cell differentiation into multiple T helper (Th) cell lineages is critical for optimal adaptive immune responses. This report identifies an intrinsic mechanism by which programmed death-1 receptor (PD-1) signaling imparted regulatory phenotype to Foxp3+ Th1 cells (denoted as Tbet+iTregPDL1 cells) and inducible regulatory T (iTreg) cells. Tbet+iTregPDL1 cells prevented inflammation in murine models of experimental colitis and experimental graft versus host disease (GvHD). Programmed death ligand-1 (PDL-1) binding to PD-1 imparted regulatory function to Tbet+iTregPDL1 cells and iTreg cells by specifically downregulating endo-lysosomal protease asparaginyl endopeptidase (AEP). AEP regulated Foxp3 stability and blocking AEP imparted regulatory function in Tbet+iTreg cells. Also, Aep-/- iTreg cells significantly inhibited GvHD and maintained Foxp3 expression. PD-1-mediated Foxp3 maintenance in Tbet+ Th1 cells occurred both in tumor infiltrating lymphocytes (TILs) and during chronic viral infection. Collectively, this report has identified an intrinsic function for PD-1 in maintaining Foxp3 through proteolytic pathway.

Keywords: AEP; Foxp3; GvHD; LCMV; PD-1; PDL-1; colitis; iTreg; melanoma.


Conflict of interest statement

Declaration of Interests

The authors declare no competing interests.

Figures

Figure 1
Figure 1. Purified CD4+TbethiFoxp3 cells can upregulate Foxp3 under iTreg conditions
Schematic representation of cell culture conditions under which sorted CD4+TbethiFoxp3 cells were expanded (A). Flow cytometry profile of Tbx21ZsGreen Foxp3RFP expressing CD4+ T helper cells (B), Foxp3 expression of CD4+TbethiFoxp3 cells in the presence of IL-2 and TGF-β1 (Tbet+iTreg cells; C) or IL-2, TGF-β1 and PDL-1 Fc chimera (Tbet+iTregPDL1 cells; C) post differentiation and expansion. Summary of %CD4+Foxp3+ cells expression in Tbet+iTreg cells and Tbet+iTregPDL1 cells (D). Schematic representation of alternate cell culture conditions under which sorted CD4+TbethiFoxp3 cells were expanded (E). Foxp3 expression of CD4+TbethiFoxp3 cells in the presence of IL-2 (F), and summary of Foxp3 expression in different cell subsets (G). Experiments were repeated at least 5 times and each experiment was performed with n=5-9 mice. Cumulative data from all experiments are presented Mean±SEM. Please also refer to Figure S1
Figure 2
Figure 2. In vivo function of Tbet+iTreg cells and Tbet+iTregPDL1 cells
Tbet+iTreg cells and Tbet+iTregPDL1 cells were generated and then utilized for the prevention of autoimmune colitis and alloimmune GvHD. B6.Rag2−/− mice were reconstituted with CD45.1+CD4+CD45RBhiCD25 T cells (4×10⁵ cells/mouse) either alone or along with CD45.2+iTreg cells, iTreg PDL1 cells, Tbet+iTreg cells and Tbet+iTregPDL1 cells (1×10⁵ cells/mouse) cells. At day 60 post adoptive transfer, spleens were characterized. Representative flow plots of intracellular IFN-γ and IL-10 cytokine expression in cohorts that either received CD4+ T effector cells alone, cohorts that received Tbet+iTreg cells in addition to T effector cells or cohorts that received Tbet+iTregPDL1 cells in addition to T effector cells (A). Summary of T cell effector cytokine IFN-γ in the various different cohorts within CD45.1+ cell populations (B). Representative flow plot of Foxp3 expression in CD45.2+CD4+Tbet+iTreg cells and Tbet+iTregPDL1 cells (C), Summary of Foxp3 and IFN-γ expression in iTreg cells, iTregPDL1 cells, Tbet+iTreg cells and Tbet+iTregPDL1 cells (D–E). Function of Tbet+iTreg cells and Tbet+iTregPDL1 cells were assessed in an experimental model of GvHD. Survival curve of mice that succumbed to GvHD in the various different cohorts (F). Summary of Foxp3 expression in iTreg cells, iTregPDL1 cells, Tbet+iTreg cells and Tbet+iTregPDL1 cells on day 14 post-transplant (G). Alloreactive IFN-γ was measured using Luminex (H). Each experiment had n=3-5 mice per cohorts. Data shown is cumulative from 2 independent experiments. For survival curve, each cohort consisted of n=10 mice. Data are presented as Mean±SEM. Please also refer to Figure S2.
Figure 3
Figure 3. PDL-1 exposure downregulates asparaginyl endopeptidase in Tbet+iTreg cells
Tbet+iTreg cells and Tbet+iTregPDL1 cell lysates were generated at pH 7 and were subjected to immuno blotting. Asparaginyl endopeptidase (AEP; Legumain; LGMN) was measured in the different subsets (A). Tbet+iTreg cells and Tbet+iTregPDL1 cells were differentiated and then stained with LE28 (measuring active AEP) along with LAMP1 and DAPI and then subjected to Amnis Imaging Cytometry. Representative images of active AEP enzyme expression in the nucleus in Tbet+iTreg cells (B) and Tbet+iTregPDL1 cells (C). AEP expression in iTreg cells, iTregPDL1 cells, Th1 cells, Th1PDL1 cells, Th2 cells and Th2PDL1 cells (D). AEP expression was determined in cytoplasmic and nuclear fractions of iTreg cells and Tbet+iTreg cells (E). iTreg cells, iTregPDL1 cells, Tbet+iTreg cells and Tbet+iTregPDL1 cells were stained with DAPI, Foxp3 PE and AEP cy5. Confocal microscopy showing AEP and Foxp3 expression inside the nucleus (F; red is AEP, green is Foxp3 and blue is DAPI). Foxp3 co-localization with AEP in the nucleus in Tbet+iTreg cells (G) and Tbet+iTregPDL1 cells was shown (H). Confocal microscopy detecting co-localization of AEP and Foxp3 within the nucleus in iTreg cells and Tbet+iTreg cells (I; white arrows show AEP co-association with Foxp3 within the nucleus). Tbet cleavage (J; left panel) and Foxp3 cleavage (J; right panel) in the presence of AEP or AEP inhibitor. Spectral analysis of Foxp3 cleavage at N155 (K). Each experiment was repeated 3-5 times and representative data from one experiment is shown. Data are shown as Mean±SEM. Please also refer to Figures S3 and S4.
Figure 4
Figure 4. AEP specific Foxp3 mutants and AEP inhibition prevents GvHD
Murine CD4+CD25 T cells were transduced with WT human Foxp3, Mutant (N154) human Foxp3, WT murine Foxp3 or mutant murine Foxp3 (N153). Transduction efficiency at day 4 was measured by flow cytometry (A). Host BALB/c mice were subjected to lethal total body irradiation (TBI; 950cGy) and then reconstituted with B6 T depleted bone marrow (BM, 5×10⁶ cells) alone, or with CD4+CD25 T cells (CD45.1 marked, 0.1×10⁶). Certain cohorts were treated with BM plus CD4+CD25 T plus non-transduced T cells (NT, 0.1×10⁶) or T cells transduced with WT human Foxp3 (WT hFoxp3, 0.1×10⁶), or human mutant Foxp3 (Mu hFoxp3, N154; 0.1×10⁶) or murine WT Foxp3 (WT mFoxp3, 0.1×10⁶) or murine mutant Foxp3 (N153; Mu mFoxp3, 0.1×10⁶). GvHD lethality was monitored (n=6 per cohort) (B). Host BALB/c mice were subjected to TBI and then reconstituted with bone marrow (BM, 107 cells), CD4+CD25 T effector cells (CD45.1 marked; 1×10⁶ cells) and either Tbet+iTreg cells (1×10⁶ cells) that were expanded with AEP inhibitor or control Tbet+iTreg cells (1×10⁶ cells). At day 14 post-transplant, splenocytes were harvested and the Foxp3 was measured in the Tbet+iTreg cell populations (marked with CD45.2). Representative flow plots showing Foxp3 expression in the different cell populations (C); frequency of Foxp3 expression (D). A survival curve experiment was set up to test the efficacy of blocking AEP in preventing GvHD. Animals were conditioned with TBI and then reconstituted with BM alone or plus CD4+CD25 T cells. Cohorts were then treated with Tbet+iTreg cells, Tbet+iTreg cells expanded with AEP inhibitor (AEPi), Tbet+iTregPDL1 cells or Tbet+iTregPDL1 cells overexpressing AEP (E). Experiments were repeated with CD45.2+ Tbet+iTreg cells that were expanded with AEP shRNA or scramble shRNA and then tested in GvHD. Frequency and absolute numbers of CD45.2+Foxp3+ cells in the different cohorts (F–H) and absolute numbers of Tbet+ cells at day 14 post-transplant in Tbet+ iTreg cells (I). Experiments were repeated twice with n=4-6 mice for immunological studies and n=6-10 mice for survival curve. Representative data from one experiment is shown as Mean±SEM. Please also refer to Figure S5.
Figure 5
Figure 5. iTreg cells deficient in AEP inhibit GvHD and maintain Foxp3 expression in vivo
Splenocytes from WT littermate controls and Aep−/− mice were characterized for CD4+ T cells, CD8+ T cells (A), T central and effector memory phenotype of CD4+ cells were characterized using CD62L and CD44 markers (B). Cumulative data from n=4 mice on the frequency of CD4, CD8, CD44 and CD62L (C). Treg cell frequency was evaluated by intracellular Foxp3 expression (D). Cumulative data from n=5 mice of Foxp3 frequency (E), and Foxp3 mean fluorescence intensity (F). Host BALB/c mice were subjected to TBI and then reconstituted with B6 BM (107), CD4+CD25 T cells (CD45.1 marked; 0.1×10⁶ cells) and either WT iTreg cells (0.1×10⁶ cells) or Aep−/−iTreg cells (0.1×10⁶ cells). Survival curve of cohorts that received the various cell populations (G). Foxp3+ cells in WT and Aep−/− iTreg cells (marked with CD45.2+) at day 14 post-transplant (H). WT and Aep−/− mice were reconstituted with 3×10⁵ B16F10 melanoma cells subcutaneously and cohorts were treated with either isotype control or anti-PDL1 antibody at day 5, 7 and 9. Mice were euthanized on day 11 and then evaluated for Foxp3+Treg cells and Tbet+Foxp3+Treg cells within the TILs. Representative flow plots of Treg cell frequency within the tumor (I), and summary of Treg cells in the various cohorts (J). TILs were gated on CD4+Tbet+ cells and then Foxp3 expression was evaluated. Representative flow plots of Tbet+Treg cell frequency within the tumor (K), and summary of Tbet+Treg cell in the various cohorts of TILs (L). Data are shown as Mean±SEM, from one representative experiment. Each experiment was at least repeated twice and had n=5 mice for immunological studies or n=10 for survival. Please also refer to Figure S6.
Figure 6
Figure 6. Virus primed CD4+Tbet+Foxp3 cells upregulate Foxp3 under iTreg and pTreg conditions
B6.Tbx21ZsgreenFoxp3RFP mice were infected with LCMV Armstrong (2×10⁵ PFU) and then monitored for the presence of CD4+TbethiFoxp3+ cells. Representative flow plots from three individual experiments showing TbethiFoxp3+ cells in the CD4 compartment of murine recipients at various time points post infection (A). Summary of frequency of TbethiFoxp3+ T cells at various time points (B). Virus primed TbethiFoxp3 cells from acute LCMV infected mice were flow sorted at day 14 and then expanded under iTreg conditions in the absence or presence of PDL-1fc chimera. The frequency of Foxp3 expression in TbethiFoxp3 cell population in the absence or presence of PDL-1 after 7 days of ex vivo culture (C). B6.Tbx21ZsgreenFoxp3RFP mice were infected with LCMV clone 13 (2×10⁶ PFU) and then monitored for the presence of CD4+TbethiFoxp3+ cells. Representative flow plots showing TbethiFoxp3+ cells in the CD4 compartment of murine recipients at various time points post infection (D). Summary of frequency of TbethiFoxp3+ T cells at various time points (E). The frequency of Foxp3 expression in TbethiFoxp3 cell population in the absence or presence of PDL-1 after 7 days of ex vivo culture (F). Summary of Tbet+iTreg cell differentiation (G). CD45.2+Tbet+FoxP3 cells (0.7×10⁶ cells) were adoptively transferred into CD45.1+ murine hosts that were infected with Clone-13. Cohorts were treated with either isotype control or anti-PDL1 antibody (200μg/mouse). Splenocytes were harvested at day 10 and the frequency of CD4+Tbet+Foxp3+ pTreg cells were evaluated (H–I). Data are shown as Mean±SEM from a representative of one to three individual experiments involving n=3-9 mice per cohorts. Please also refer to Figure S7.
Figure 7
Figure 7. Tbet+Th1 cells upregulate Foxp3 in tumor microenvironment
B6.Rag2−/− mice were subcutaneously injected with B16F10 melanoma cells. At day 7 post-tumor inoculation, adoptive transfer of Tbet+Th1 cells was performed (A). Mice were euthanized on day 14, splenocytes and TILs were isolated and then Tbet+Foxp3+ cell frequency was determined (B). Summary of Foxp3+Tbet+ cells from the spleen and TIL (C). Tbet+Foxp3cells were flow sorted from the spleen and then expanded under iTreg conditions or iTreg conditions plus PDL-1fc. The upregulation of Foxp3 was then monitored by flow cytometry at day 7 post culture (D–E). B6.Rag2−/− mice were subcutaneously injected with B16F10 melanoma cells and adoptive transfer of Tbet+Th1 cells was performed at day 5. Cohorts were either treated with isotype control or anti-PDL1 antibody (250μg/mouse) at days 5, 7 and 9. Animals were euthanized at day 11. Experimental methodology outlined in (F), and the frequency of Tbet+iTreg cells was monitored within the TILs (G–H). Experiments were performed with Tbet+Foxp3 cells transduced with either scramble shRNA RV or AEP shRNA RV and then treated with anti-PDL1 antibody. Frequency of Tbet+iTreg cells within the TILs in the different cohorts (I–J). Murine CD45.1+ hosts were reconstituted with B16F10 melanoma tumors and sorted CD45.2+Tbet+Foxp3 cells. Cohorts were treated with either isotype or anti-PDL1 antibody. Frequency of Tbet+iTreg cells was measured within the TILs (K–L). Experiments were repeated at least twice and data are shown as Mean±SEM from one to two individual experiments involving n=3-8 mice per group.

References

    1. Adeeku E, Gudapati P, Mendez-Fernandez Y, Van Kaer L, Boothby M. Flexibility accompanies commitment of memory CD4 lymphocytes derived from IL-4 locus-activated precursors. Proc Natl Acad Sci U S A. 2008;105:9307–9312. - PMC - PubMed
    1. Ahmed R, Byrne JA, Oldstone MB. Virus specificity of cytotoxic T lymphocytes generated during acute lymphocytic choriomeningitis virus infection: role of the H-2 region in determining cross-reactivity for different lymphocytic choriomeningitis virus strains. Journal of virology. 1984;51:34–41. - PMC - PubMed
    1. Amarnath S, Mangus CW, Wang JC, Wei F, He A, Kapoor V, Foley JE, Massey PR, Felizardo TC, Riley JL, et al. The PDL1-PD1 axis converts human TH1 cells into regulatory T cells. Science translational medicine. 2011;3:111ra120. - PMC - PubMed
    1. Andrade V, Guerra M, Jardim C, Melo F, Silva W, Ortega JM, Robert M, Nathanson MH, Leite F. Nucleoplasmic calcium regulates cell proliferation through legumain. J Hepatol. 2011;55:626–635. - PMC - PubMed
    1. Asseman C, Mauze S, Leach MW, Coffman RL, Powrie F. An essential role for interleukin 10 in the function of regulatory T cells that inhibit intestinal inflammation. J Exp Med. 1999;190:995–1004. - PMC - PubMed

Publication types

MeSH terms

Substances