. 2018 Oct;367(1):82-94.
doi: 10.1124/jpet.118.249375. Epub 2018 Jul 27.

Amelioration of Diabetic Nephropathy Using a Retinoic Acid Receptor β 2 Agonist

Affiliations

Amelioration of Diabetic Nephropathy Using a Retinoic Acid Receptor β 2 Agonist

Steven E Trasino et al. J Pharmacol Exp Ther. 2018 Oct.

Abstract

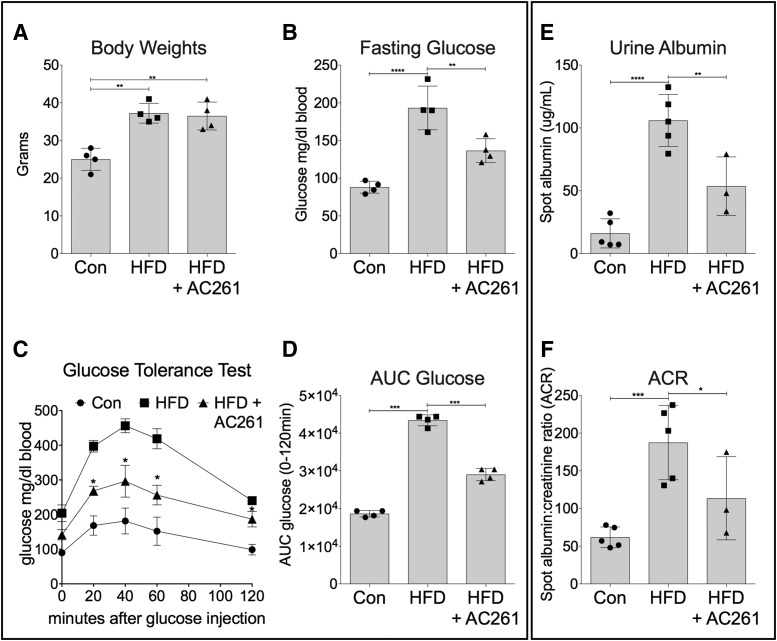
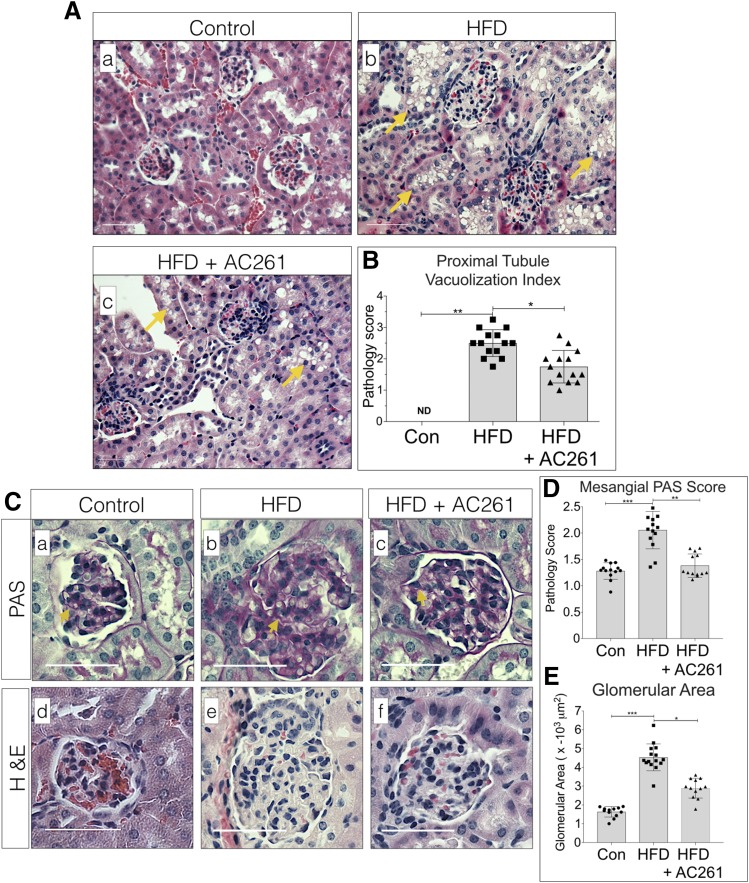
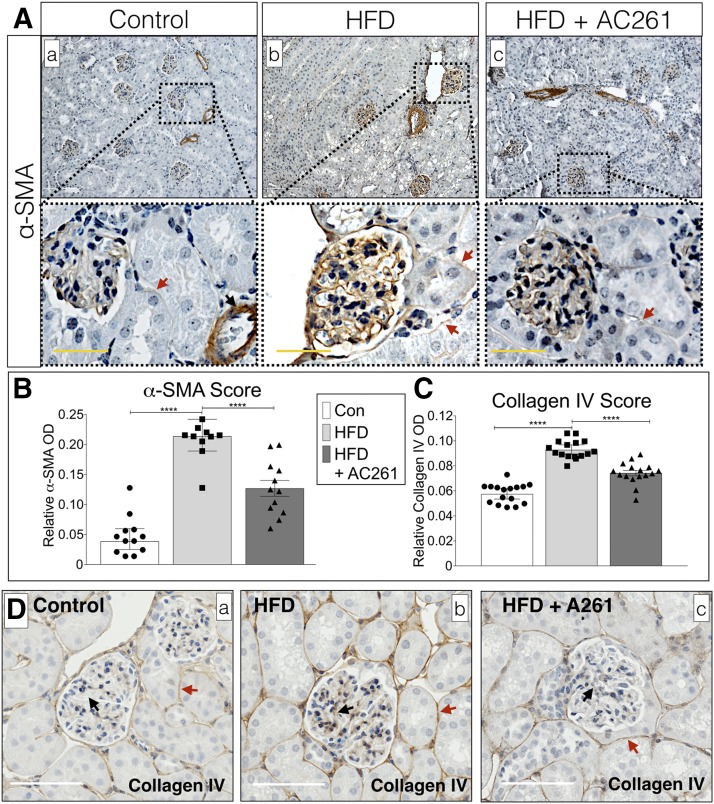
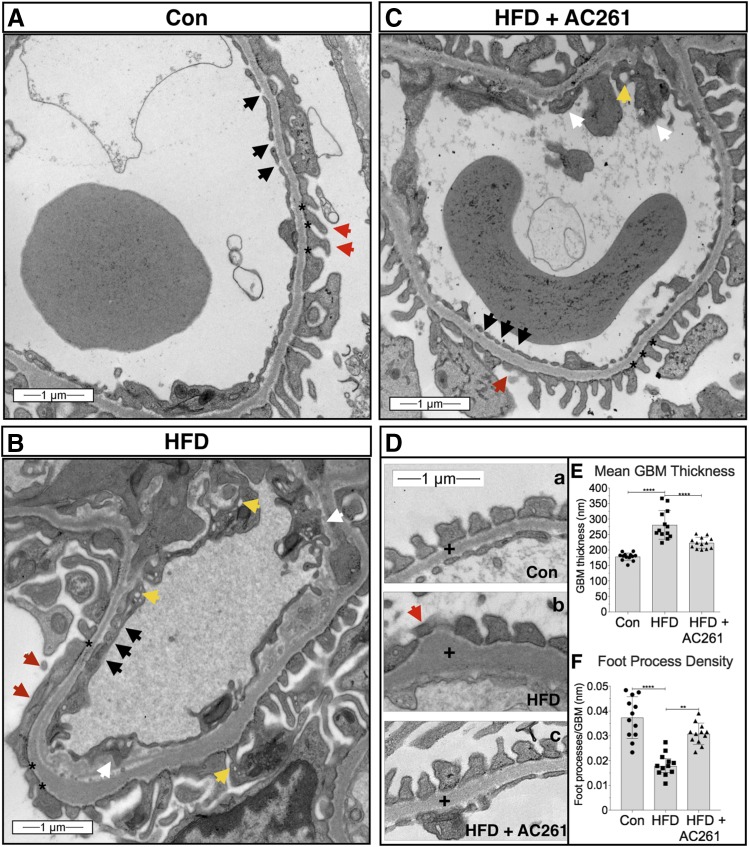
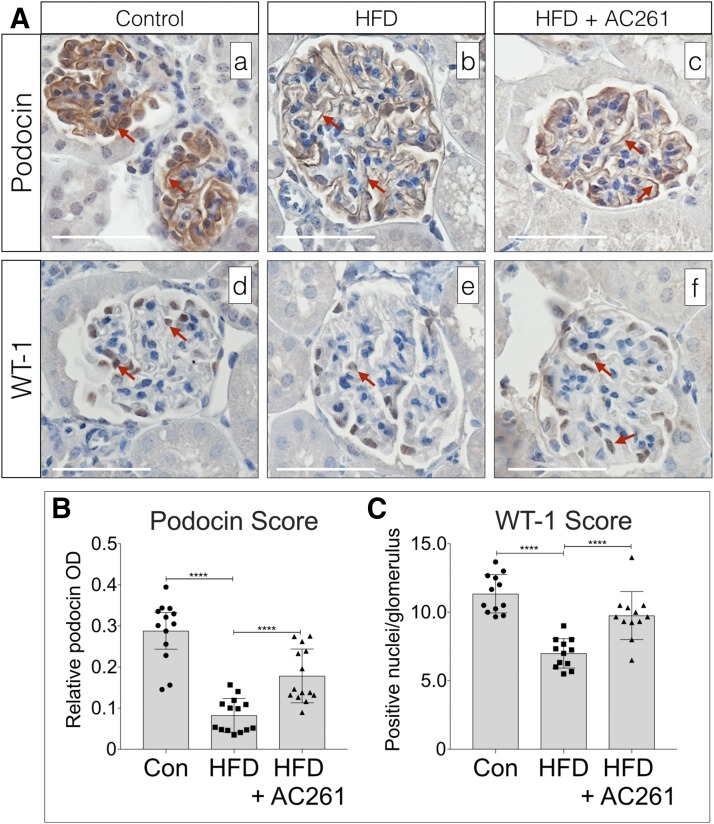
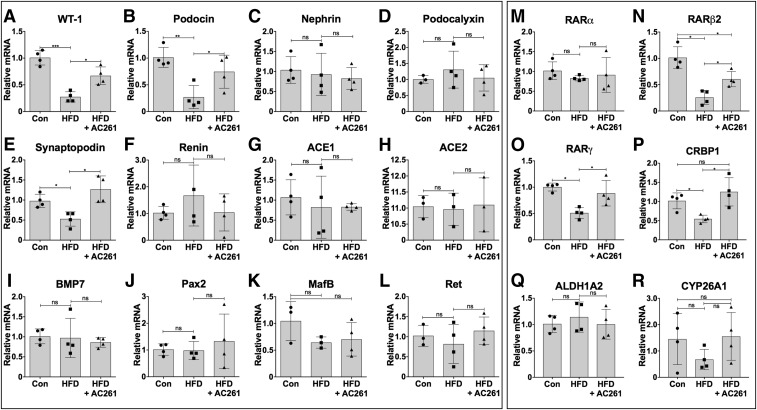
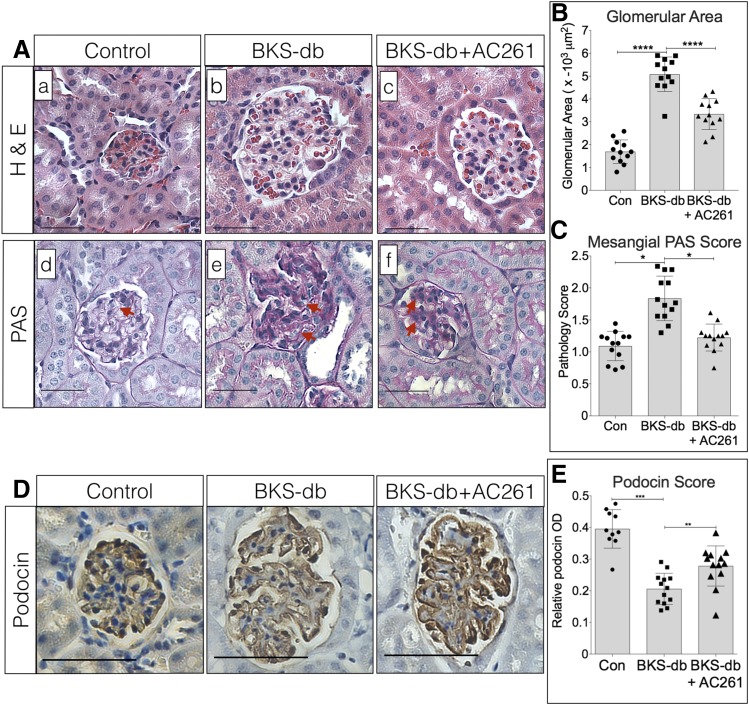
Vitamin A (VA) and its derivatives, known as retinoids, play critical roles in renal development through retinoic acid receptor β2 (RARβ2). Disruptions in VA signaling pathways are associated with the onset of diabetic nephropathy (DN). Despite the known role of RARβ2 in renal development, the effects of selective agonists for RARβ2 in a high-fat diet (HFD) model of DN are unknown. Here we examined whether AC261066 (AC261), a highly selective agonist for RARβ2, exhibited therapeutic effects in a HFD model of DN in C57BL/6 mice. Twelve weeks of AC261 administration to HFD-fed mice was well tolerated with no observable side effects. Compared with HFD-fed mice, HFD + AC261-treated mice had improved glycemic control and reductions in proteinuria and urine albumin-to-creatinine ratio. Several cellular hallmarks of DN were mitigated in HFD + AC261-treated mice, including reductions in tubule lipid droplets, podocyte (POD) effacement, endothelial cell collapse, mesangial expansion, and glomerular basement membrane thickening. Mesangial and tubule interstitial expression of the myofibroblast markers α-smooth muscle actin (α-SMA) and type IV collagen (Col-IV) was lower in HFD + AC261-treated mice compared with HFD alone. Ultrastructural and immunohistochemistry analyses showed that, compared with HFD-fed mice, HFD + AC261-treated mice showed preservation of POD foot process and slit-diaphragm morphology, an increase in the levels of slit-diagram protein podocin, and the transcription factor Wilms tumor-suppressor gene 1 in PODs. Given the need for novel DN therapies, our results warrant further studies of the therapeutic properties of AC261 in DN.


Figures

Fig. 1.
Fig. 1.
Effects of AC261066 (AC261), a RARβ2 agonist, on glucose tolerance and urine albumin excretion in a HFD model of diabetic nephropathy. (A) Body weights of C57BL/6 WT male mice after 16 weeks of being fed either a standard control chow (13% kcal fat) diet (Con, n = 4), a HFD (45% kcal fat) (n = 4), or a HFD with the RARβ2 agonist AC261066 (HFD + AC261, n = 4) in their drinking water from week 5 to week 16. (B) Fasting glucose levels in mice from (A). (C) Glucose tolerance tests (GTT) and (D) area under the curve (AUC) glucose in mice from (A). (E) Spot morning urine albumin concentration (μg/ml) and (F) spot morning (ACR) in mice as described in Materials and Methods, with control mice (n = 5); (HFD, n = 5) and (HFD + AC261, n = 3). Error bars represent ± S.D. of the mean with *P < 0.05; **P < 0.01; ***P < 0.001; ****P < 0.0001.
Fig. 2.
Fig. 2.
RARβ2 agonist results in less tubule lipid droplet (LD), mesangial expansion, and glomerular hypertrophy. (A) (a–c) Representative images of H&E-stained renal tissue analyzed by light microscopy showing glomeruli and tubule LD vacuolization [b and c, yellow arrows], in mice described in Fig. 1A and analyzed with control mice (n = 4); (HFD, n = 4); and (HFD + AC261, n = 4). Original magnification, 100×; scale bar, 50 μm. (B) Tubule vacuolization histology score of all mice from (A) and as described in Materials and Methods (ND = not detected). (C) Representative images of PAS [a–c; yellow arrows, a–c; capillary GBM thickening, and H&E-stained (d–f) glomeruli] in all mice from (A). (Original magnification, 400×; scale bar, 100 μm. (D) Mesangial expansion histology score of all mice from (A) and as described in Materials and Methods. (E) Mean glomerular area (−103 μm2) of all mice from (A) and as described in Materials and Methods. Histogram individual data points represent the score of each slide analyzed per mouse as described in Materials and Methods. Errors bars represent ± S.D. of the mean of each group with *P < 0.05; **P < 0.01; ***P < 0.001.
Fig. 3.
Fig. 3.
RARβ2 agonist-treated mice show lower renal α-SMA and type IV collagen resulting from a HFD. (A) (a–c) Representative images of α-SMA IHC performed on renal sections from mice described in Fig. 1A with control mice (n = 3), (HFD, n = 3) and (HFD + AC261, n = 3). Original magnification, 100×; scale bar, 50 μm; inset dotted field, magnification, 400×, Scale bar, 100 μm. (B) α-SMA IHC staining optical density (OD) determined in all mice from (A) and as described in Materials and Methods. (C) Collagen IV IHC staining OD score in all mice from (A) and as described in Materials and Methods. (D) Representative images of collagen IV IHC performed on renal sections from all mice described (A). Original magnification, 200×; scale bar, 50 μm. Histogram individual data points represent the score of each slide analyzed per mouse as described in Materials and Methods. Error bars represent ± S.D. of the mean of each group with ****P < 0.0001.
Fig. 4.
Fig. 4.
Less podocyte effacement, glomerular basement membrane thickening, and ultrastructural renal lesions in retinoic acid receptor β2 (RARβ2) agonist-treated mice. (A–C) Representative transmission electronic microscopic (TEM) images of glomeruli from mice described in Fig. 1A with control mice (n = 3), (HFD, n = 3), and (HFD+AC261, n = 3). Original magnification, 20,000×; Scale bar, 1μm; Indicators: [black arrows = capillary endothelial cell (EC) fenestrations; red arrows = podocyte foot process effacement and collapse; yellow arrows = podocyte and EC lipid droplets (LDs); white arrows = EC collapse; *(asterisks) = podocyte foot process slit diaphragm; + (black cross) = capillary glomerular basement membrane]. (D) Representative TEM images of GBM from mice described in Fig. 1A. Original magnification, 20,000×; scale bar, 1 μm; Indicators: black cross = GBM; red arrow = podocyte foot process effacement and collapse. (E and F) Quantitation of GBM thickness and podocyte foot process density as described in Materials and Methods. Histogram individual data points represent the score of each slide analyzed per mouse as described in Materials and Methods. Errors bars represent ± S.D. of the mean of each group with **P < 0.01; ****P < 0.0001.
Fig. 5.
Fig. 5.
Effects of RARβ2 agonist on podocin and WT1 protein expression. (A) Representative images of podocin (membranous positivity) (a–c), and WT1 (nuclear positivity) (d–f) IHC performed on renal sections from mice described in Fig. 1A with control mice (n = 4), (HFD, n = 4) and (HFD + AC261, n = 4). Original magnification, 400×; scale bar, 100 μm. (B and C) Podocin and WT1 IHC staining optical density (OD) and positive glomerular cell quantitation of all mice from (A) and as described in Materials and Methods. Histogram individual data points represent the score of each slide analyzed per mouse as described in Materials and Methods. Errors bars represent ± S.D. of the mean of each group with ****P < 0.0001.
Fig. 6.
Fig. 6.
Modulation of renal, podocyte, and vitamin A-specific genes by a HFD and RARβ2 agonist. Quantitative RT-PCR measurements of relative renal cortex tissue transcript levels of podocyte-specific genes from Wt C57BL/6 male mice fed either chow or HFD diets with and without the RARβ agonist (control mice, n = 4), (HFD, n = 4), and (HFD + AC261, n = 4) as described in the Materials and Methods. Relative renal mRNA levels of: (A) WT-1, (B) podocin (Nphs2), (C) nephrin (Nphs1), (D) podocalyxin (Podxl), (E) synaptopodin (Synpo), (F) renin (Ren), (G) Ace1, (H) Ace2), (I) bone morphogenetic protein 7 (BMP7), (J) paired box protein Pax-2 (Pax2), (K) MAF BZIP transcription factor B (MafB), (L) ret proto-oncogene (Ret), (M) RARα, (N) RARβ2, (O) RARγ), (P) cellular retinoid binding protein 1 (CRBP1), (Q) aldehyde dehydrogenase, member 1a2 (ALDH1A2), (R) cytochrome P-450 enzyme (Cyp26a1). Relative fold mRNA levels were normalized to transcript levels of hypoxanthine guanine phosphoribosyl transferase (Hprt) and analyzed by the Δ,Δ CT method as described in Materials and Methods. Histogram individual data points represent the mean of each mouse. Errors bars represent ± S.D. of the mean of (n = 4) animals for each experimental group, with *P < 0.05; **P < 0.01; ***P < 0.001; and ns = not significant.
Fig. 7.
Fig. 7.
RARβ2 agonist–treated BKS-db/db mice show fewer DN lesions. (A) Representative images of H&E (a–c), and PAS (d–f, red arrows = capillary glomerular basement membrane thickening] stained renal sections from male Wt C57BL/6 (control, n = 4) and 14-week-old BKS-db/db (BKS-db, n = 3) mice fed chow with and without the RARβ2 agonist AC261066 (BKS-db + AC261, n = 3) for 14 days. (B) Mean glomerular area (−103 μm2) of mice from (A), as described in Materials and Methods. (C) Mesangial expansion histology score of mice from (A) and as described in Materials and Methods. (D) Representative images of podocin IHC performed on renal sections from mice from (A). Original magnification, 400×; scale bar, 100 μm. (E) Podocin IHC staining optical density (OD) quantitation of mice from (A) and as described in Materials and Methods. Histogram individual data points represent the score of each slide analyzed per mouse as described in Materials and Methods. Errors bars represent ± S.D. of the mean of each group with *P < 0.05; **P < 0.01; ***P < 0.001; ****P < 0.0001.

Similar articles

Cited by

References

    1. Abrahamson DR. (2012) Role of the podocyte (and glomerular endothelium) in building the GBM. Semin Nephrol 32:342–349. - PMC - PubMed
    1. Alsaad KO, Herzenberg AM. (2007) Distinguishing diabetic nephropathy from other causes of glomerulosclerosis: an update. J Clin Pathol 60:18–26. - PMC - PubMed
    1. Anderson RJ, Ray CJ, Hattler BG. (1998) Retinoic acid regulation of renal tubular epithelial and vascular smooth muscle cell function. J Am Soc Nephrol 9:773–781. - PubMed
    1. Batourina E, Choi C, Paragas N, Bello N, Hensle T, Costantini FD, Schuchardt A, Bacallao RL, Mendelsohn CL. (2002) Distal ureter morphogenesis depends on epithelial cell remodeling mediated by vitamin A and Ret. Nat Genet 32:109–115. - PubMed
    1. Batourina E, Gim S, Bello N, Shy M, Clagett-Dame M, Srinivas S, Costantini F, Mendelsohn C. (2001) Vitamin A controls epithelial/mesenchymal interactions through Ret expression. Nat Genet 27:74–78. - PubMed

Publication types

MeSH terms