Meta-Analysis
. 2018 Jul 27;9(1):2941.
doi: 10.1038/s41467-018-04951-w.

Genome-wide association analyses identify 143 risk variants and putative regulatory mechanisms for type 2 diabetes

Collaborators, Affiliations
Meta-Analysis

Genome-wide association analyses identify 143 risk variants and putative regulatory mechanisms for type 2 diabetes

Angli Xue et al. Nat Commun. .

Abstract

Type 2 diabetes (T2D) is a very common disease in humans. Here we conduct a meta-analysis of genome-wide association studies (GWAS) with ~16 million genetic variants in 62,892 T2D cases and 596,424 controls of European ancestry. We identify 139 common and 4 rare variants associated with T2D, 42 of which (39 common and 3 rare variants) are independent of the known variants. Integration of the gene expression data from blood (n = 14,115 and 2765) with the GWAS results identifies 33 putative functional genes for T2D, 3 of which were targeted by approved drugs. A further integration of DNA methylation (n = 1980) and epigenomic annotation data highlight 3 genes (CAMK1D, TP53INP1, and ATP5G1) with plausible regulatory mechanisms, whereby a genetic variant exerts an effect on T2D through epigenetic regulation of gene expression. Our study uncovers additional loci, proposes putative genetic regulatory mechanisms for T2D, and provides evidence of purifying selection for T2D-associated variants.


Conflict of interest statement

The authors declare no competing interests.

Figures

Fig. 1
Fig. 1
Manhattan plots of common- and rare-variant associations for T2D. a GWAS results for common variants (MAF ≥ 0.01) in the meta-analysis. The 39 novel loci are annotated and highlighted in green. b GWAS results of rare variants (0.0001 ≤ MAF < 0.01) in UKB. Four loci with P < 5 × 10−9 are highlighted in red. The blue lines denote the genome-wide significant threshold of P < 5 × 10−8, and the red lines denote a more stringent threshold of P < 5 × 10−9
Fig. 2
Fig. 2
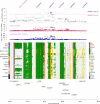
Prioritizing genes and regulatory elements at the CAMK1D locus for T2D. The results of the SMR analysis that integrates data from GWAS, eQTL, and mQTL studies are shown. The top plot shows −log10(P value) of SNPs from the GWAS meta-analysis for T2D. Red diamonds and blue circles represent −log10(P value) from the SMR tests for associations of gene expression and DNAm probes with T2D, respectively. Solid diamonds and circles represent the probes not rejected by the HEIDI test. The yellow star denotes the top cis-eQTL SNP rs11257655. The second plot shows −log10(P value) of the SNP association for gene expression probe 51129 (tagging CAMK1D). The third plot shows −log10(P value) of the SNP association with DNAm probes cg03575602 and cg16894855 from the mQTL study. The bottom plot shows 25 chromatin state annotations (indicated by colors) of 127 samples from Roadmap Epigenomics Mapping Consortium (REMC) for different primary cells and tissue types (rows)
Fig. 3
Fig. 3
Hypothesized regulatory mechanism at the CAMK1D locus for T2D. When the allele of rs11257655 in the enhancer region (red) changes from C to T, the enhancer activator protein FOXA1/FOXA2 (orange ellipsoid) binds to the enhancer region and the DNA methylation level in the promoter region is reduced; this increases the binding efficiency of RNA polymerase II recruited by mediator proteins (gray circles) and, therefore increases the transcription of CAMK1D
Fig. 4
Fig. 4
Prioritizing genes and regulatory elements at TP53INP1 locus for T2D. Shown are the results from the SMR analysis that integrates data from GWAS, eQTL, and mQTL studies. The top plot shows −log10(P value) from the GWAS meta-analysis for T2D. Red diamonds and blue circles represent −log10(P value) from the SMR tests for associations of gene expression and DNAm probes with T2D, respectively. Solid diamonds and circles represent the probes not rejected by the HEIDI test. The second plot shows −log10(P value) of the SNP association with gene expression probe 16667 (tagging TP53INP1). The third plot shows −log10(P value) of the SNP association with DNAm probe cg13393036 and cg09323728. The bottom plot shows 25 chromatin state annotations (indicated by colors) of 127 samples from Roadmap Epigenomics Mapping Consortium (REMC) for different primary cells and tissue types (rows)
Fig. 5
Fig. 5
Hypothesized regulatory mechanism at the TP53INP1 locus for T2D. When the promoter region is highly methylated, which prevents binding of repressor protein (red rounded rectangle) to the promoter region, RNA polymerase II (green ellipsoid), transcription factor protein (orange ellipsoid) and mediator proteins (gray circles) will form a transcription initiation complex that increases the transcription. However, when the methylation level of the promoter region is low, repressor protein can more efficiently bind to the promoter, blocking the binding of the transcription initiation complex to the promoter, which decreases the transcription of TP53INP1
Fig. 6
Fig. 6
Estimation of the genetic architecture parameters for T2D in UKB. Shown in the panel a are the results from the GREML-LDMS analysis, and those in panels b, c and d are the results from the BayesS analysis using the UKB data. Error bars are standard errors of the estimates. a Variance explained by SNPs in each MAF bin. We combined the estimates of the first three bins (MAF < 0.1) to harmonize the width of all MAF bins. b Chromosome-wide SNP-based heritability against chromosome length. c Estimate of the BayesS parameter (S) reflecting the strength of purifying selection on each chromosome. d Proportion of SNPs with non-zero effects on each chromosome (π)

References

    1. Zhou B, et al. Worldwide trends in diabetes since 1980: a pooled analysis of 751 population-based studies with 4.4 million participants. Lancet. 2016;387:1513–1530. doi: 10.1016/S0140-6736(15)00551-6. - DOI - PMC - PubMed
    1. Taylor R. Type 2 diabetes: etiology and reversibility. Diabetes Care. 2013;36:1047–1055. doi: 10.2337/dc12-1805. - DOI - PMC - PubMed
    1. Altshuler D, et al. The common PPARgamma Pro12Ala polymorphism is associated with decreased risk of type 2 diabetes. Nat. Genet. 2000;26:76–80. doi: 10.1038/79216. - DOI - PubMed
    1. Grant SF, et al. Variant of transcription factor 7-like 2 (TCF7L2) gene confers risk of type 2 diabetes. Nat. Genet. 2006;38:320–323. doi: 10.1038/ng1732. - DOI - PubMed
    1. Morris AP, et al. Large-scale association analysis provides insights into the genetic architecture and pathophysiology of type 2 diabetes. Nat. Genet. 2012;44:981–990. doi: 10.1038/ng.2383. - DOI - PMC - PubMed

Publication types

MeSH terms

Substances