. 2018 Jul 27;9(1):2958.
doi: 10.1038/s41467-018-05387-y.

Neutrophil extracellular trap formation requires OPA1-dependent glycolytic ATP production

Affiliations

Neutrophil extracellular trap formation requires OPA1-dependent glycolytic ATP production

Poorya Amini et al. Nat Commun. .

Abstract

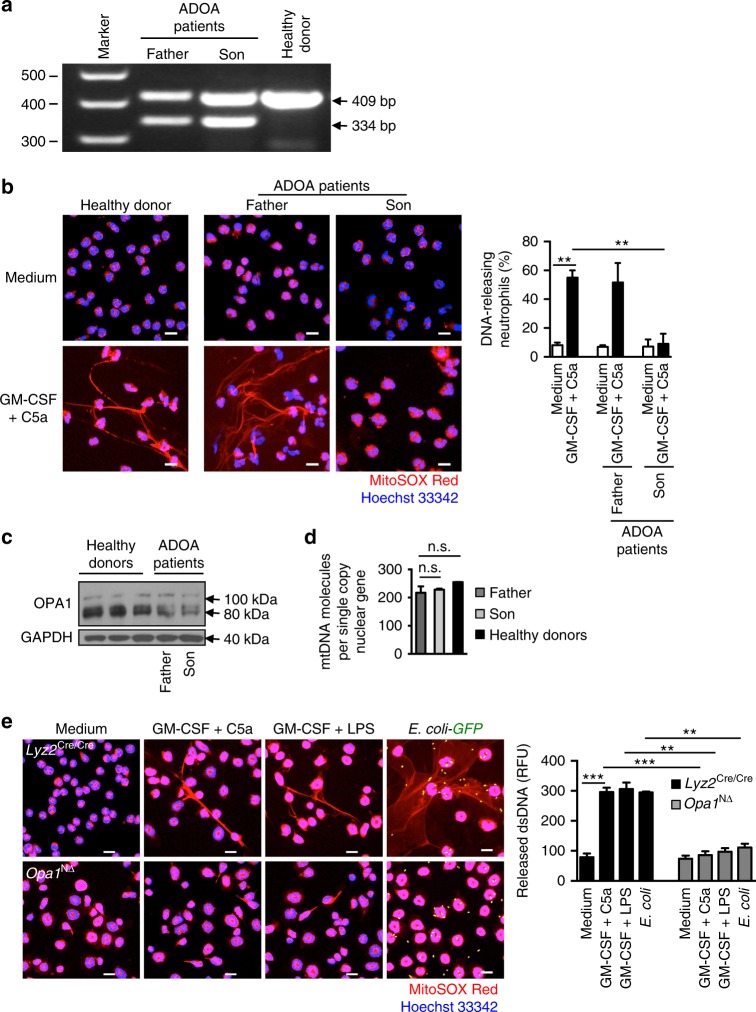
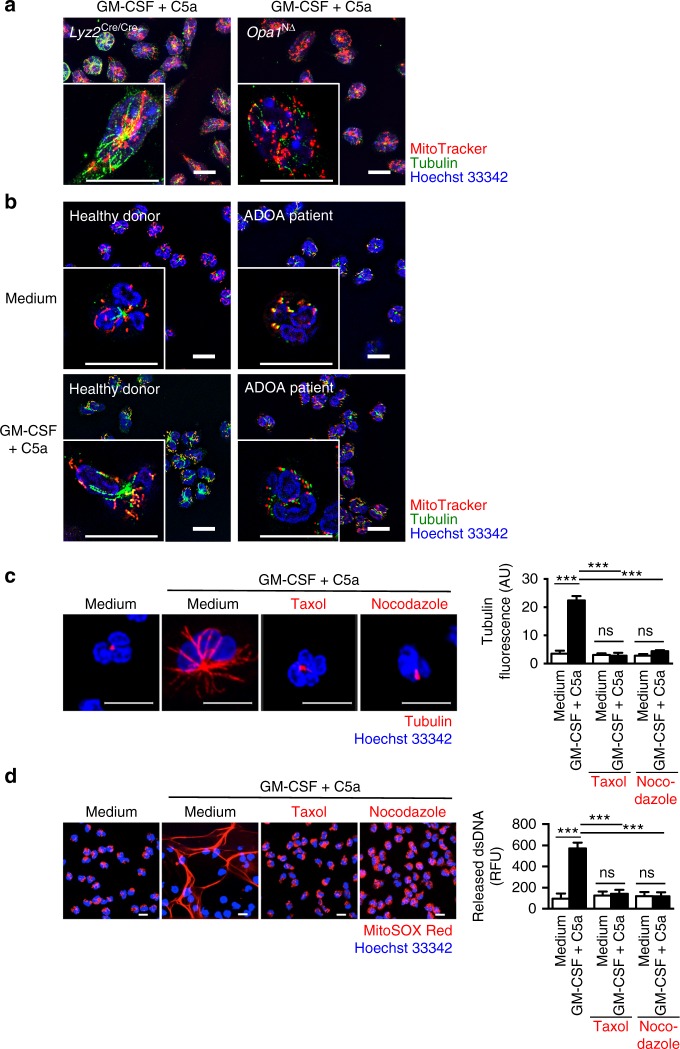
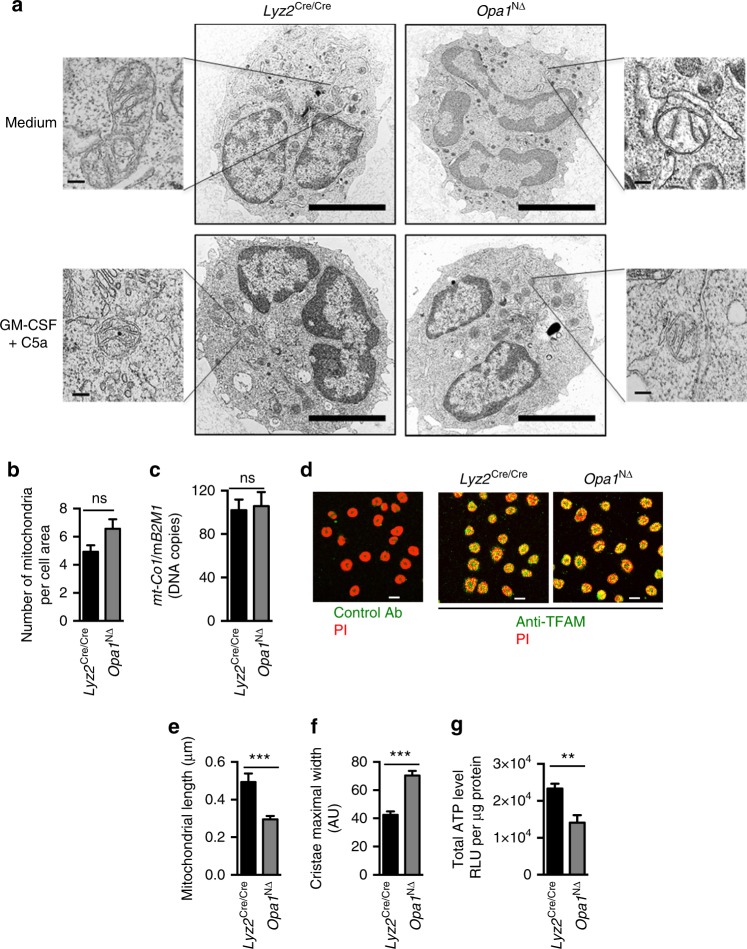
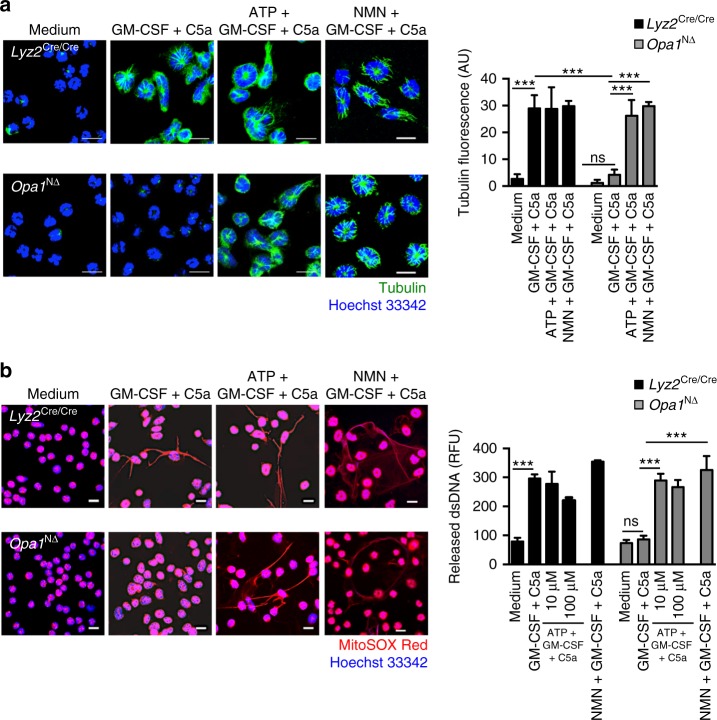
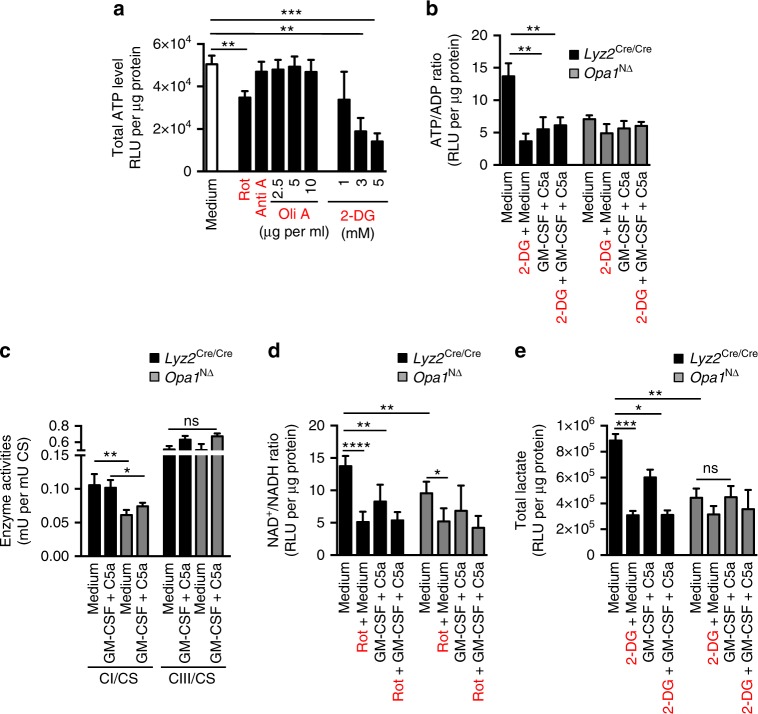
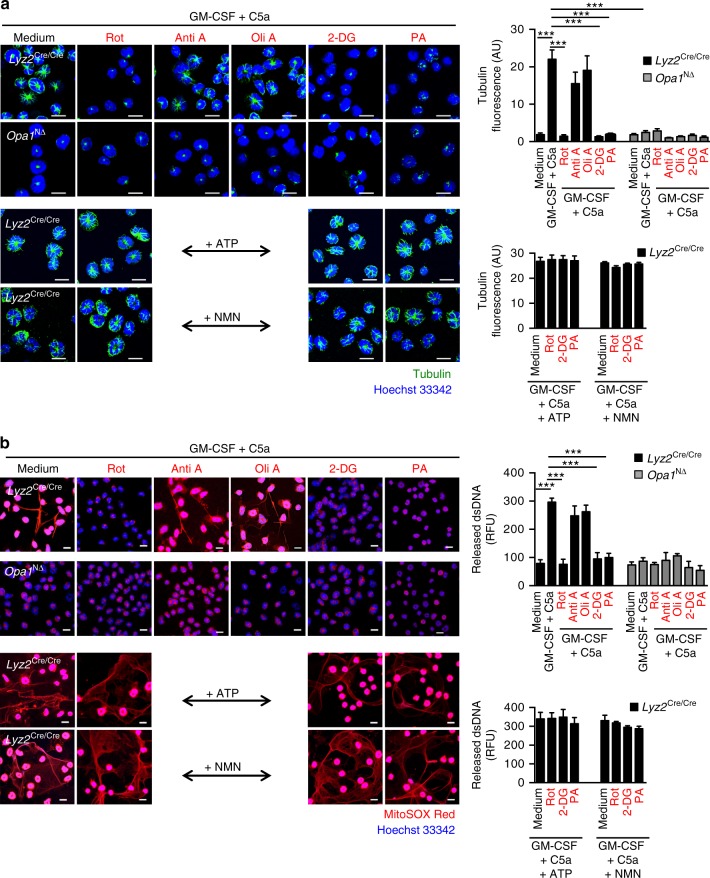
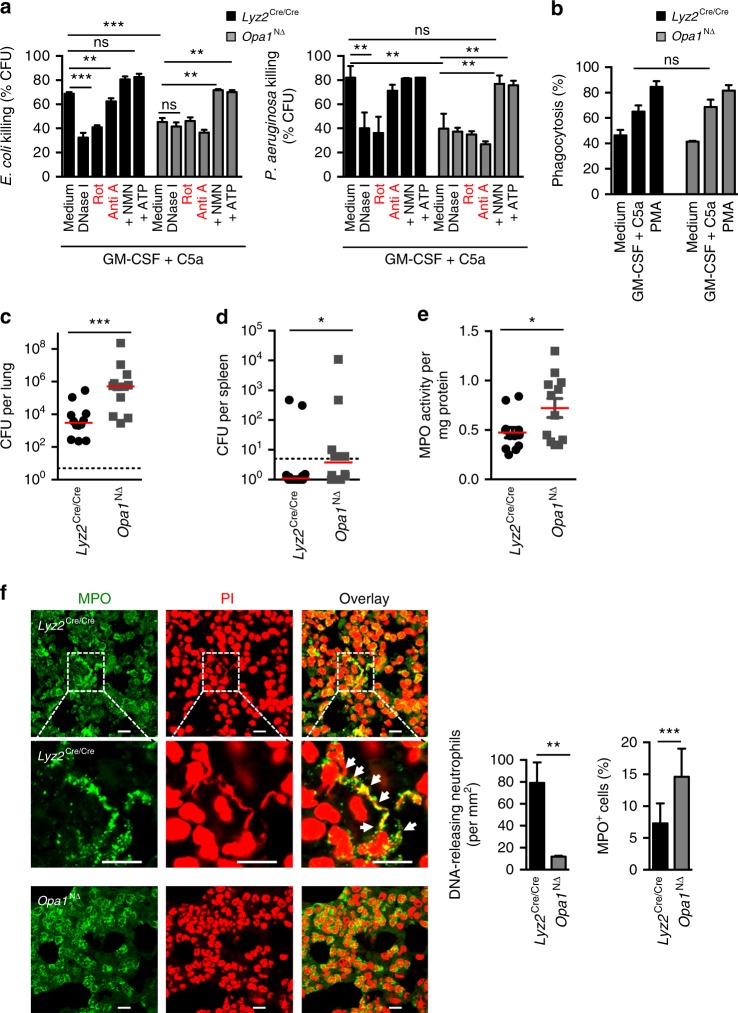
Optic atrophy 1 (OPA1) is a mitochondrial inner membrane protein that has an important role in mitochondrial fusion and structural integrity. Dysfunctional OPA1 mutations cause atrophy of the optic nerve leading to blindness. Here, we show that OPA1 has an important role in the innate immune system. Using conditional knockout mice lacking Opa1 in neutrophils (Opa1N∆), we report that lack of OPA1 reduces the activity of mitochondrial electron transport complex I in neutrophils. This then causes a decline in adenosine-triphosphate (ATP) production through glycolysis due to lowered NAD+ availability. Additionally, we show that OPA1-dependent ATP production in these cells is required for microtubule network assembly and for the formation of neutrophil extracellular traps. Finally, we show that Opa1N∆ mice exhibit a reduced antibacterial defense capability against Pseudomonas aeruginosa.


Conflict of interest statement

The authors declare no competing interests.

Figures

Fig. 1
Fig. 1
Failure of DNA release by OPA1-deficient human and mouse neutrophils. a Molecular characterization of OPA1 transcripts in ADOA patients. OPA1 transcript analysis from isolated neutrophils encompassing exons 10–12 derived from a control and two ADOA patients harboring the heterozygous c.1140G>A mutation (NM_015560.2). A shortened product of 334 bp reveals the aberrantly spliced, skipped exon 11 and is detected in patients’ cDNA only. The band of 409 bp indicates the wild-type transcript. A full image of the agarose gel is provided in Supplementary Fig. 11a. b Confocal microscopy. Highly purified human blood neutrophils from control individuals and two ADAO patients were primed with GM-CSF and subsequently stimulated with C5a. Extracellular DNA was stained with MitoSOX™ Red and the nucleus with Hoechst 33342 (blue). Bars, 10 μm. Right: Quantification of the number of DNA-releasing neutrophils. Values are means ± SEM. **p < 0.01; n = 3. c Immunoblotting. Protein lysates of freshly isolated neutrophils from ADOA patients and healthy donors were analyzed for OPA1 protein expression. Full-length immunoblots are provided in Supplementary Fig. 11b. d Quantitative PCR. Genomic DNA from freshly purified human neutrophils of ADOA patients and healthy control donors were analyzed for mtDNA content (average of ATP synthase protein 8 (MT-ATP8) and mitochondrial D-Loop) per single copy nuclear gene (B2M). Values are means ± SEM (n = 3). e Confocal microscopy. Primary mature neutrophils from Opa1N∆ and control mice were primed with GM-CSF and subsequently stimulated with C5a, LPS, or co-cultured with E. coli–GFP. Extracellular DNA was stained with MitoSOX™ Red and the nucleus with Hoechst 33342 (blue). Bars, 10 μm. Right: quantification of released dsDNA in supernatants of activated neutrophils. Values are means ± SEM. n.s., not significant; **p < 0.01; ***p < 0.001; n = 5. Additional data including NET formation induced by other triggers are provided in Supplementary Fig. 2c
Fig. 2
Fig. 2
Absence of microtubule formation in OPA1-deficient human and mouse neutrophils. a Super-resolution microscopy. Microtubule formation and mitochondrial morphology of primary mature neutrophils from Opa1N∆ and control mice following GM-CSF priming and subsequent C5a stimulation. Microtubules were stained with anti-α-tubulin antibody (green), the nucleus with Hoechst 33342 (blue) and mitochondria with MitoTracker® Orange (red). Images were acquired by ELYRA super-resolution microscopy. Bars, 10 µm. The data are representative of three independent experiments. Quantification and additional data including microtubule formation induced by other triggers are provided in Supplementary Fig. 4a–c. b Super-resolution microscopy. Microtubule formation and mitochondrial morphology in human blood neutrophils from control individuals and an ADAO patient (son, see Fig. 1) following GM-CSF priming and subsequent C5a stimulation. Microtubules were stained with anti-α-tubulin antibody (green), the nucleus with Hoechst 33342 (blue) and mitochondria with MitoTracker® Orange (red). Single cells are shown at higher magnification in the insets. Images were acquired by ELYRA super-resolution microscopy. Bars, 10 µm. The data are representative of three independent experiments. Quantification is provided in Supplementary Fig. 5a. c Confocal microscopy. Microtubule assembly was analyzed in human control neutrophils following pre-treatment with the indicated inhibitors and subsequent combined GM-CSF/C5a stimulation. Microtubules were stained with anti-α-tubulin antibody (red), the nucleus with Hoechst 33342 (blue). Bars, 10 µm. Right: Quantification of the microtubule network formation was performed by automated analysis of microscopy images using Imaris software. Values are means ± SEM. n.s., not significant; ***p < 0.001; n = 5. d Confocal microscopy. Human blood neutrophils from control individuals pretreated with the indicated inhibitors were stimulated with GM-CSF/C5a. Extracellular DNA was stained with MitoSOX™ Red and the nucleus with Hoechst 33342 (blue). Bars, 10 μm. Right: quantification of the released dsDNA in supernatants of activated neutrophils. Values are means ± SEM. n.s., not significant; ***p < 0.001; n = 3
Fig. 3
Fig. 3
Lack of Opa1 alters mitochondrial morphology and cristae structure. a Transmission electron microscopy (TEM). Primary mature neutrophils from Opa1N∆ and control mice were fixed and analyzed. Representative images are shown. Bars, 5 µm. Insets to the sides, bars, 1 µm. Mitochondria were further analyzed at higher magnification and statistical analyses are provided below in (b), (e), and (f). b The average numbers of mitochondria per neutrophil was quantified in at least 100 cells. Values are means ± SEM (n = 3); n.s., not significant. c Quantitative PCR. Freshly purified mature neutrophils from Opa1N∆ and control mice were analyzed for the number of DNA copies of mitochondrial mouse cytochrome c oxidase subunit 1 (mt-Co1) relative to mouse β2 microglobulin (B2M) which was used as a single copy nuclear-encoded reference gene. Values are means ± SEM (n = 3); n.s., not significant. d Confocal microscopy. Primary mature mouse neutrophils from Opa1N∆ and control mice were stained for TFAM expression (green) and DNA (red) using anti-TFAM antibody and PI. Bars, 10 µm; n = 3. e Average mitochondrial major axis length in freshly purified mature neutrophils from Opa1N∆ and control mice. Images were acquired by TEM and subsequently analyzed using the measurement points module of Imaris software. Data were collected from at least five mitochondria per cell and more than 50 neutrophils per experiment. Values are means ± SEM. ***p < 0.001; n = 3. f Morphometric analysis of cristae width in 60 randomly selected mitochondria of freshly purified mature neutrophils from Opa1N∆ and control mice. Values are lengths in arbitrary units (AU) and shown as means ± SEM. ***p < 0.001; n = 3. g Total cellular ATP production by freshly purified mature neutrophils from Opa1N∆ and control mice was measured by ATP-dependent luciferase activity using an ATP determination kit. Relative luciferase units (RLU) are shown as means ± SEM. **p < 0.01; n = 5. Quantification of the data obtained in activated neutrophils is provided in Supplementary Fig. 6
Fig. 4
Fig. 4
Exogenous ATP or NMN restore the microtubule network and the ability of activated Opa1N∆ neutrophils to release DNA. a Confocal microscopy. GM-CSF primed and C5a-stimulated neutrophils of Opa1N∆ and control mice were pretreated with 100 μM ATP or 500 μM NMN. Microtubules were stained with anti-α-tubulin antibody (green). Bars, 10 µm. Right: quantification of the microtubule network formation was performed using automated analysis of microscopy images with Imaris software. Values are means ± SEM. n.s., not significant; ***p < 0.001; n = 5. b Confocal microscopy. GM-CSF primed and C5a-stimulated neutrophils of Opa1N∆ and control mice were pretreated with 10 and 100 μM ATP or 500 μM NMN. Extracellular DNA was stained with MitoSOX™ Red and the nucleus with Hoechst 33342 (blue). Bars, 10 µm. Right: quantification of released dsDNA in supernatants of activated neutrophils. Values are means ± SEM. n.s., not significant; ***p < 0.001; n = 4. Additional data including microtubule and NET formation induced by other stimuli known to trigger NETs are provided in Supplementary Figs. 7 and 8
Fig. 5
Fig. 5
Reduced glycolytic ATP production in neutrophils of Opa1N∆ mice is a consequence of reduced mitochondrial complex I activity. a ATP-dependent luciferase activity assay. Control human neutrophils were incubated with the indicated inhibitors for 70 min in a concentration-dependent manner. Relative luciferase unit (RLU) values are means ± SEM. **p < 0.01; ***p < 0.001; n = 3. b ATP/ADP bioluminescent assay. Neutrophils of Opa1N∆ and control mice were pre-treated with 3 mM 2-DG for 70 min and the ATP/ADP ratio was measured in the presence and absence of GM-CSF/C5a. RLU values are means ± SEM. **p < 0.01; n = 6. c Complex I (CI), complex III (CIII) and citrate synthase (CS) activities of mitochondria isolated from resting and GM-CSF/C5a-activated Opa1N∆ and control Hoxb8 neutrophils were assessed in the presence and absence of 10 µM rotenone (Rot) using a spectrophotometer. Values are means ± SEM. n.s., not significant; *p < 0.05; **p < 0.01; n = 3. d NAD/NADH bioluminescent assay. NAD+/NADH ratios in resting and GM-CSF/C5a-activated neutrophils of Opa1N∆ and control mice were measured after 70 min incubation in the presence and absence of 10 µM Rot using a NAD/NADH determination kit. RLU values are means ± SEM. *p < 0.05; **p < 0.01; ****p < 0.0001; n = 5. e Lactate bioluminescent assay. Lactate levels in resting and GM-CSF/C5a activated neutrophils of Opa1N∆ and control mice were measured after 70 min incubation in the presence and absence of 3 mM 2-DG using a lactate determination kit. RLU values are means ± SEM. n.s., not significant; *p < 0.05; **p < 0.01; ***p < 0.001; n = 4. ECAR and OCR data are provided in Supplementary Fig. 9
Fig. 6
Fig. 6
Pharmacological inhibition of mitochondrial complex I activity and glycolysis blocks microtubule network formation and extracellular DNA release. a Confocal microscopy. Opa1N∆ and control neutrophils were pretreated with 10 µM rotenone (Rot), 5 µg per ml antimycin A (Anti A), 2.5 µg per ml oligomycin A (Oli A), 3 mM 2-DG, or 0.5 µM piericidin A (PA) for 30 min before GM-CSF priming and subsequent C5a activation. Lower panels: control mouse neutrophils were pretreated with 100 µM ATP or 500 µM NMN, incubated in presence or absence of the indicated inhibitors, and subsequently stimulated with GM-CSF/C5a. Microtubules were stained with anti-α-tubulin antibody (green). Bars, 10 µm. Right: Quantification of microtubule network formation was performed by automated analysis of microscopy images using Imaris software. Values are means ± SEM. ***p < 0.001; n = 3. b Confocal microscopy. Neutrophils of Opa1N∆ and control mice were pretreated with 10 µM Rot, 5 µg per ml Anti A, 2.5 µg per ml Oli A, 3 mM 2-DG, or 0.5 µM PA for 30 min before GM-CSF priming and subsequent C5a activation. Lower panels: control mouse neutrophils were pretreated with 100 µM ATP or 500 µM NMN, incubated in presence or absence of the indicated inhibitors, and subsequently stimulated with GM-CSF/C5a. Extracellular DNA was stained with MitoSOX™ Red and the nucleus with Hoechst 33342 (blue). Bars, 10 µm. Right: quantification of released dsDNA in supernatants of activated neutrophils. Values are means ± SEM. ***p < 0.001; n = 3. Additional data using human neutrophils are provided in Supplementary Figs. 7 and 10
Fig. 7
Fig. 7
Anti-microbial response of Opa1N∆ neutrophils and failure to clear P. aeruginosa lung infections. a Bacterial killing assays. Neutrophils of Opa1N∆ and control mice were primed with GM-CSF and subsequently stimulated with C5a before co-culture with E. coli–GFP (left panel) and P. aeruginosa (right panel) in presence or absence of the indicated inhibitors or following 100 μM ATP or 500 μM NMN pre-treatment. Values are means ± SEM. n.s., not significant; **p < 0.01; ***p < 0.001; n = 4. b Phagocytosis assay. Phagocytosis of opsonized E. coli-GFP by Opa1N∆ and control neutrophils was analyzed after 35 min. Values are means ± SEM (n = 3); n.s., not significant. c, d Bacterial clearance in vivo. Opa1N∆ and control mice were intra-nasally inoculated with 2 × 106 CFUs of P. aeruginosa. Total CFU numbers of bacteria were assessed by plating homogenized lungs (c) and spleen (d) on agar plates. The medians are indicated and each symbol represents a value for an individual mouse. *p < 0.05; ***p < 0.001. e MPO enzymatic activity assay. Neutrophil infiltration of lungs in Opa1N∆ and control mice was assessed by MPO activity in total lung homogenates. The medians are indicated and each symbol represents a value for an individual mouse. *p < 0.05. f Confocal microscopy. Lung sections of Opa1N∆ and control mice were obtained after infection with P. aeruginosa and stained with anti-MPO antibody (green) and PI (red). Higher magnifications are shown in the middle panels; white arrows indicate co-localization of extracellular DNA and MPO. Bars, 10 µm. Right: quantification of the DNA-releasing and infiltrating neutrophils in the lungs. Quantification of MPO positive infiltrating neutrophils compared with total PI positive nuclei in the infected lungs using an automated slide scanner. Values are means ± SEM. **p < 0.01; ***p < 0.001; n = 3

References

    1. Brinkmann V, et al. Neutrophil extracellular traps kill bacteria. Science. 2004;303:1532–1535. doi: 10.1126/science.1092385. - DOI - PubMed
    1. Yousefi S, Mihalache C, Kozlowski E, Schmid I, Simon HU. Viable neutrophils release mitochondrial DNA to form neutrophil extracellular traps. Cell Death Differ. 2009;16:1438–1444. doi: 10.1038/cdd.2009.96. - DOI - PubMed
    1. Simon D, Simon HU, Yousefi S. Extracellular DNA traps in allergic, infectious, and autoimmune diseases. Allergy. 2013;68:409–416. doi: 10.1111/all.12111. - DOI - PubMed
    1. Garcia-Romo GS, et al. Netting neutrophils are major inducers of type I IFN production in pediatric systemic lupus erythematosus. Sci. Transl. Med. 2011;3:73ra20. doi: 10.1126/scitranslmed.3001201. - DOI - PMC - PubMed
    1. Lande R, et al. Neutrophils activate plasmacytoid dendritic cells by releasing self-DNA-peptide complexes in systemic lupus erythematosus. Sci. Transl. Med. 2011;3:73ra19. doi: 10.1126/scitranslmed.3001180. - DOI - PMC - PubMed

Publication types

MeSH terms