. 2018 Jul 27;8(1):11355.
doi: 10.1038/s41598-018-29319-4.

Hippo Signaling Pathway Dysregulation in Human Huntington's Disease Brain and Neuronal Stem Cells

Affiliations

Hippo Signaling Pathway Dysregulation in Human Huntington's Disease Brain and Neuronal Stem Cells

Kaly A Mueller et al. Sci Rep. .

Abstract

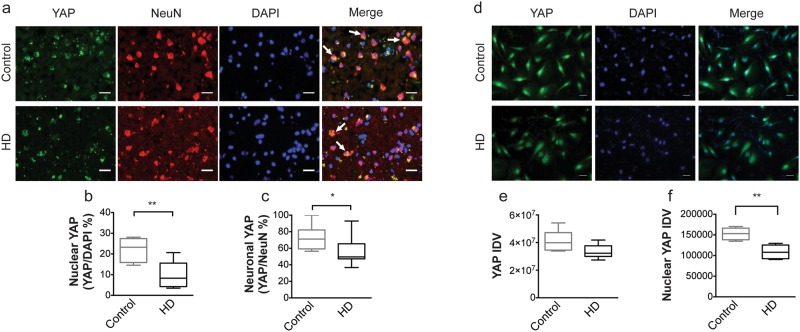
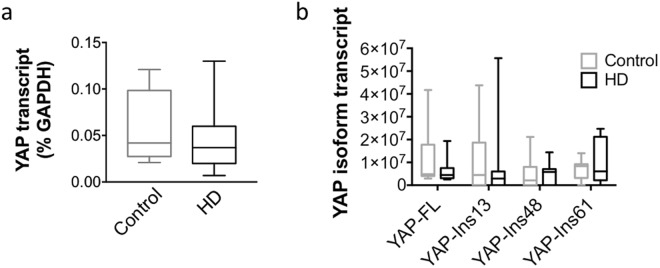
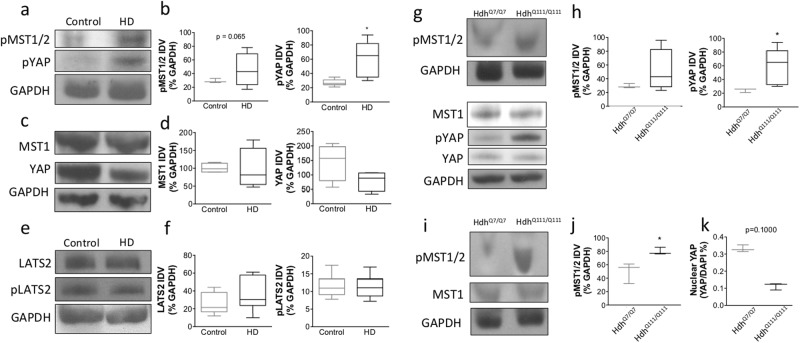
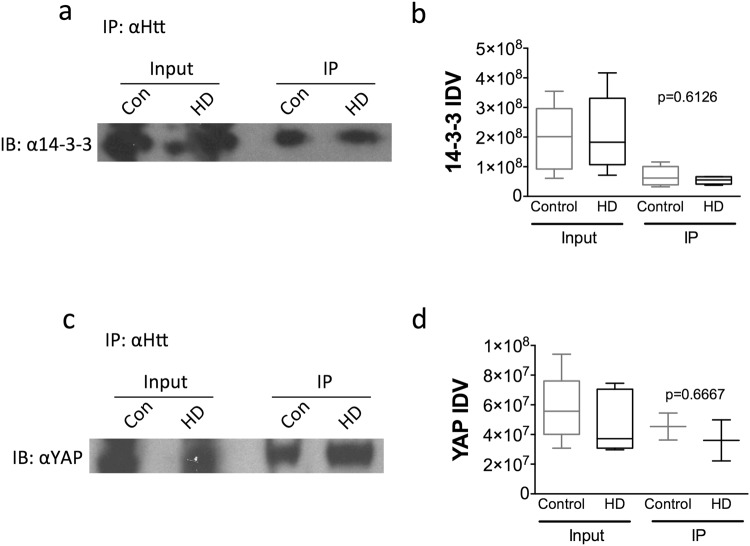
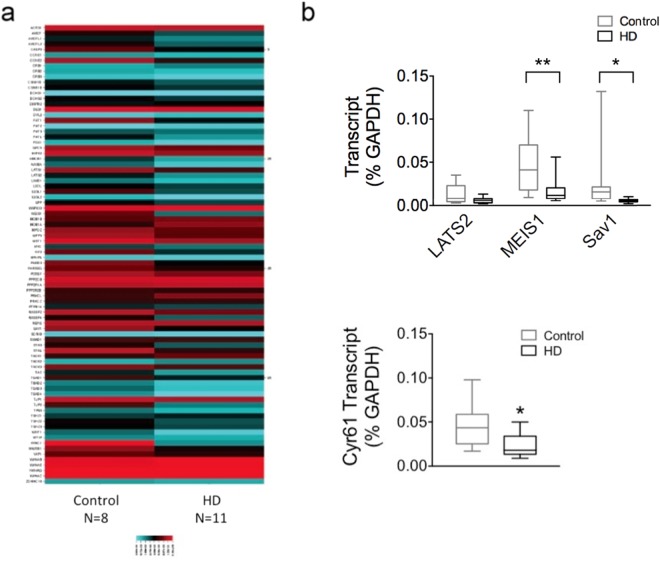
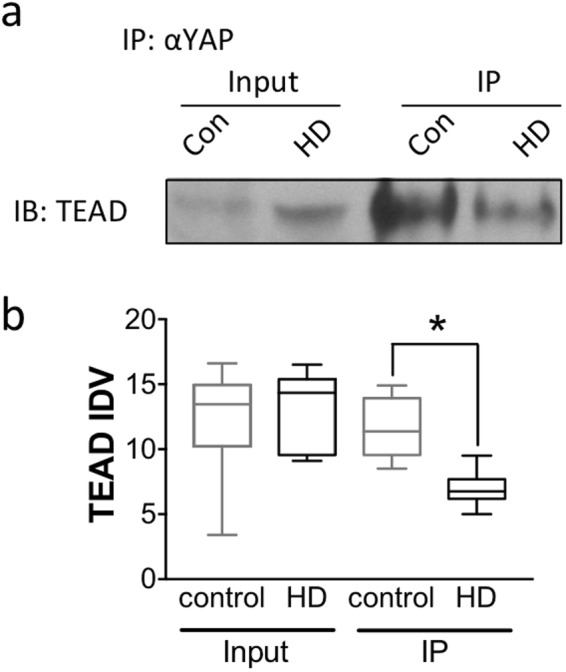
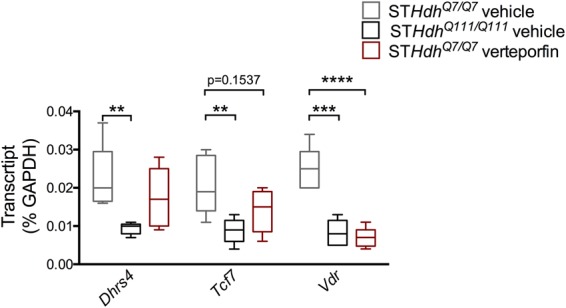
The Hippo signaling pathway is involved in organ size regulation and tumor suppression. Although inhibition of Hippo leads to tumorigenesis, activation of Hippo may play a role in neurodegeneration. Specifically, activation of the upstream regulator, mammalian sterile 20 (STE20)-like kinase 1 (MST1), reduces activity of the transcriptional co-activator Yes-Associated Protein (YAP), thereby mediating oxidative stress-induced neuronal death. Here, we investigated the possible role of this pathway in Huntington's disease (HD) pathogenesis. Our results demonstrate a significant increase in phosphorylated MST1, the active form, in post-mortem HD cortex and in the brains of CAG knock-in HdhQ111/Q111 mice. YAP nuclear localization was also decreased in HD post-mortem cortex and in neuronal stem cells derived from HD patients. Moreover, there was a significant increase in phosphorylated YAP, the inactive form, in HD post-mortem cortex and in HdhQ111/Q111 brain. In addition, YAP was found to interact with huntingtin (Htt) and the chaperone 14-3-3, however this interaction was not altered in the presence of mutant Htt. Lastly, YAP/TEAD interactions and expression of Hippo pathway genes were altered in HD. Together, these results demonstrate that activation of MST1 together with a decrease in nuclear YAP could significantly contribute to transcriptional dysregulation in HD.


Conflict of interest statement

The authors declare no competing interests.

Figures

Figure 1
Figure 1
YAP subcellular localization in human post-mortem cortex and NSCs derived from HD patients. (a) Representative images from unaffected control (top; n = 7) and HD (bottom; n = 10) human cortical tissue stained with YAP (green), NeuN (red), and DAPI (blue) (left to right). Merged images (far right) show overlap of YAP, NeuN and DAPI. Arrows highlight representative cells; scale bar = 50 μM. (b) The percentage of NeuN+ cells that were YAP+ (YAP/NeuN%) was significantly lower (p = 0.0250, Mann-Whitney U Test) in HD (black) compared to control (grey) human tissue. (c) The percentage of DAPI+ cells that were YAP+ (YAP/DAPI%) was significantly lower (p = 0.0020, Mann-Whitney U Test) in HD compared to control tissue. (d) Representative images from unaffected control (WAD9) (top; n = 5) and HD (G018) (bottom; n = 6) human embryonic-derived NSCs stained with YAP (green; left) and DAPI (blue; middle). Merged images (right) show overlap of YAP and DAPI. Scale bar = 25 μM. (e) Overall YAP intensity was not different (p = 0.1255, Mann-Whitney U Test) between control (grey) and HD (black) NSCs. (f) Nuclear YAP staining was significantly lower (p = 0.0043, Mann-Whitney U Test) in HD compared to control tissue. Data are presented as median and min-max values. *p < 0.05, **p < 0.01.
Figure 2
Figure 2
YAP mRNA expression in post-mortem human cortex. (a) Quantitative real time PCR assay illustrates no change in YAP mRNA relative to GAPDH levels (p = 0.397, Mann Whitney U test) between unaffected control (n = 5; grey) and HD (n = 12; black) patients. (b) Quantitative real time PCR assay also demonstrates no change (p > 0.05, Two-way ANOVA) in full length YAP (YAP-FL; left) or YAPΔC isoforms with 13, 48, and 61 nucleotide inserts (left to right: YAP-Ins13, YAP-Ins48, and YAP-Ins61, respectively) between unaffected control and HD patients. A two-way ANOVA demonstrated that there was no significant effect of genotype [F(3, 68) = 0.775, p = 0.512], YAP isoform [F(1, 68) = 0.282, p = 0.597], or interaction [F(3, 68) = 0.383, p = 0.765] in control (n = 8; grey) and HD (n = 11; black) patients. Data are presented as median values.
Figure 3
Figure 3
MST1/2 is activated and YAP is inactivated in post-mortem human cortex and the Hdh mouse model of HD. (a) Representative western blots for pMST1/2, pYAP and GAPDH (top to bottom) with human cortex samples from unaffected control (left; n = 4) and HD (right; n = 4) patients. (b) There was a trend towards an increase (p = 0.065, Mann-Whitney U Test) in pMST1/2 levels (left) from HD compared to controls. pYAP protein levels (right) were significantly increased (p = 0.015, Mann-Whitney U Test) in HD compared to controls. (c) Representative western blots for MST, YAP and GAPDH (top to bottom) with human cortex samples from unaffected control (left; n = 4) and HD (right; n = 4) patients. (d) There was no change in MST1 (left) (p = 0.343, Mann-Whitney U Test) or YAP (right) (p = 0.200, Mann-Whitney U Test) between HD and controls. (e) Representative western blots for LATS2, pLATS2 and GAPDH (top to bottom) with human cortex samples from unaffected control (left; n = 8) and HD (right; n = 8) patients. (f) There was no change in LATS2 (left) (p = 0.2039, Mann-Whitney U Test) or pLATS2 (right) (p = 0.8785, Mann-Whitney U Test) in HD compared to controls. (g) Representative western blots for phosphorylated MST1/2 (pMST1/2) and GAPDH (top to bottom) from HdhQ7/Q7 (left; n = 3) and HdhQ111/Q111 (right; n = 4) striatum and for MST1, phosphorylated YAP (pYAP), YAP and GAPDH (top to bottom) from HdhQ7/Q7 (left; n = 3) and HdhQ111/Q111 (right; n = 5) striatum. (h) Quantification of westerns blots showed no change in pMST1/2 (left) (p = 0.4000, Mann-Whitney U Test) and increased pYAP (right) (p = 0.0357, Mann-Whitney U Test) protein levels in HdhQ111/Q111 relative to HdhQ7/Q7 striatum. (i) Representative western blots for pMST1/2, MST1, and GAPDH (top to bottom) from HdhQ7/Q7 (left; n = 3) and HdhQ111/Q111 (right; n = 4) cortex. (j) Quantification of western blots shows increased pMST1/2 (p = 0.0286, Mann-Whitney U Test) protein levels in HdhQ111/Q111 (right; n = 4) relative to HdhQ7/Q7 (left; n = 4) cortex. (k) Quantification of immunofluorescence staining illustrated a trend towards a decrease (p = 0.1000, Mann-Whitney U Test) in nuclear YAP (YAP/DAPI%) levels in HdhQ111/Q111 (n = 3) relative to HdhQ7/Q7 (n = 3) samples. Data are presented as median and min-max values. * p < 0.05.
Figure 4
Figure 4
YAP-Htt-14-3-3 interactions. (a) Representative blot from a co-immunoprecipitation assay using human cortex with anti-14-3-3 antibody followed by immunoblotting with an anti-huntingtin (2166) antibody. (b) There was no change in 14-3-3 levels in the input samples (left) (p = 0.7209, Mann-Whitney U Test) or in 14-3-3/Htt interactions (right) in HD cortex (black; n = 8 input and IP) compared to control (grey; n = 8 input, n = 7 IP) as demonstrated in the IP samples (p = 0.6126, Mann-Whitney U Test). (c) Representative blot from a co-immunoprecipitation assay using human cortex with anti-YAP antibody followed by immunoblotting with an anti-huntingtin (2166) antibody. (d) There was no change in YAP levels in the input samples (left) (p = 0.1031, Mann-Whitney U Test) in HD cortex (black; n = 7) compared to control (grey; n = 7) or in YAP/Htt interactions (right) (p = 0.6667, Mann-Whitney U Test) in HD cortex (black; n = 7) compared to control (grey; n = 7) as demonstrated in the IP samples in HD cortex (black; n = 2) compared to control (grey; n = 2) (p = 0.6667, Mann-Whitney U Test). Data are presented as median and min-max values.
Figure 5
Figure 5
Expression patterns of Hippo pathway components in human cortex. (a) Heat map illustrating expression levels in Hippo pathway proteins from a gene expression array performed on control (n = 8) and HD (n = 14) human cortex samples. Colors indicate expression levels (blue = low to red = high). Overall there were more downregulated genes in human HD compared to control cortex. (b) Two-way ANOVA revealed a significant effect of genotype [F(2, 60) = 6.633, p = 0.0025] and treatment [F(1, 60) = 17.03, p = 0.0001] but no effect of interaction [F(2, 60) = 1.826, p = 0.1698] on gene expression from qPCR analysis. Sidak’s multiple comparison’s test demonstrated that there was a significant decrease in Meis1 (p < 0.001) and Sav1 (p < 0.05) expression in HD cortex compared to control but not a decrease in Lats2 expression (p > 0.05). (c) qPCR findings also demonstrated a significant decrease in Cyr61, another known YAP target gene, expression in HD cortex (black; n = 13) compared to control (grey; n = 8) (p = 0.0132 Mann-Whitney U Test). Data are presented as medians and min to max. *p < 0.05, **p < 0.01.
Figure 6
Figure 6
YAP/TEAD interactions are decreased in HD. (a) Representative blot from a co-immunoprecipitation assay using human cortex with anti-YAP antibody followed by immunoblotting with an anti-pan-TEAD antibody. (b) There was no change in TEAD levels in the input samples (p = 0.6857, Mann-Whitney U Test) (left) but there was a significant decrease in YAP/TEAD interactions (right) in HD cortex (black; n = 6) compared to control (grey; n = 7) as demonstrated in the IP samples (p = 0.0043, Mann-Whitney U Test). Data are presented as median and min-max values. *p < 0.05.
Figure 7
Figure 7
Disruption of YAP/TEAD interaction alters transcription. Two-way ANOVA demonstrated that there was a significant effect of gene [F(2, 12) = 23.87, p < 0.0001] but no effect of treatment [F(2, 36) = 1.144, p = 0.3298] or interaction [F(4, 36) = 2.019, p = 0.1124] on expression data from qPCR analysis. Tukey’s multiple comparison’s test a significant decrease in expression of the NADPH dehydrogenase (Dhrs4) (p = 0.0025), transcription factor 7 (Tcf7) (p = 0.0053), and vitamin D receptor (Vdr) (p = 0.0001) genes in untreated STHdhQ7/Q7 cells (light grey) compared to untreated STHdhQ111/Q111 cells (black; n = 5). In addition, verteporfin treatment (10 mM, 24 hours) in STHdhQ7/Q7 cells (red; n = 5) also significantly decreased Vdr expression (p < 0.0001, Tukey’s post-hoc test) and produced a trend towards a decrease in Tcf7 expression (p = 0.1537, Tukey’s post-hoc test) compared to untreated STHdhQ7/Q7 cells. However, verteporfin treatment did not affect Dhrs4 (p = 0.3535, Tukey’s post-hoc test) expression in STHdhQ7/Q7 cells. Data are presented as median and min-max values. **p < 0.01, **p < 0.001, ****p < 0.0001.

References

    1. A novel gene containing a trinucleotide repeat that is expanded and unstable on Huntington’s disease chromosomes. The Huntington’s Disease Collaborative Research Group. Cell72, 971–983 (1993). - PubMed
    1. MacDonald ME. Huntingtin: alive and well and working in middle management. Sci STKE. 2003;2003:pe48. - PubMed
    1. Glajch KE, Sadri-Vakili G. Epigenetic Mechanisms Involved in Huntington’s Disease Pathogenesis. J Huntingtons Dis. 2015;4:1–15. - PubMed
    1. McFarland KN, Cha JH. Molecular biology of Huntington’s disease. Handb Clin Neurol. 2011;100:25–81. doi: 10.1016/B978-0-444-52014-2.00003-3. - DOI - PubMed
    1. Ross CA, Tabrizi SJ. Huntington’s disease: from molecular pathogenesis to clinical treatment. Lancet Neurol. 2011;10:83–98. doi: 10.1016/S1474-4422(10)70245-3. - DOI - PubMed

Publication types

MeSH terms