. 2018 Jul 27;8(1):11354.
doi: 10.1038/s41598-018-29251-7.

Ocean acidification drives community shifts towards simplified non-calcified habitats in a subtropical-temperate transition zone

Affiliations

Ocean acidification drives community shifts towards simplified non-calcified habitats in a subtropical-temperate transition zone

Sylvain Agostini et al. Sci Rep. .

Abstract

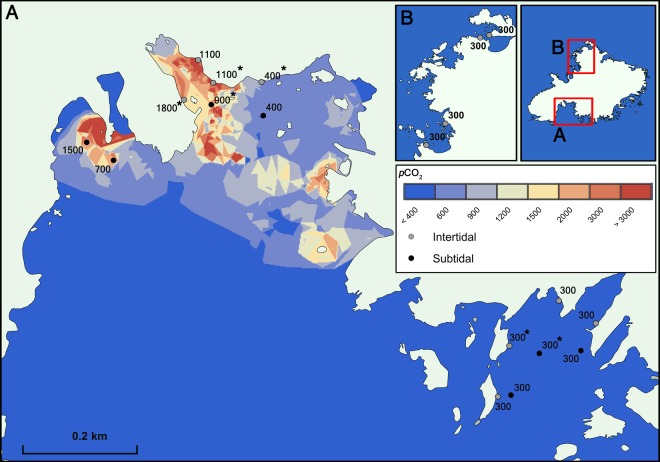
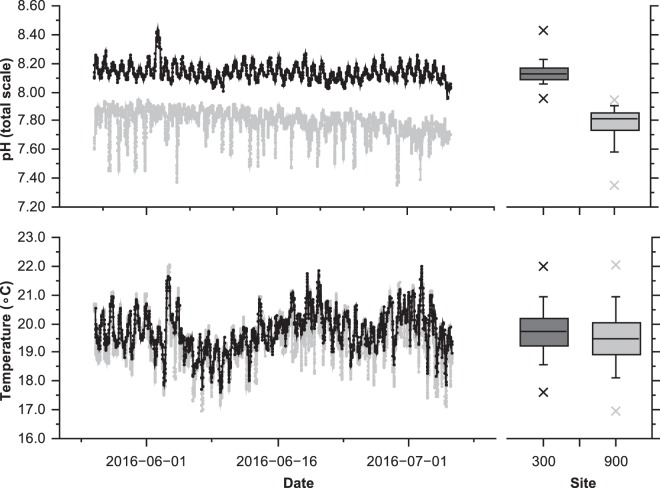
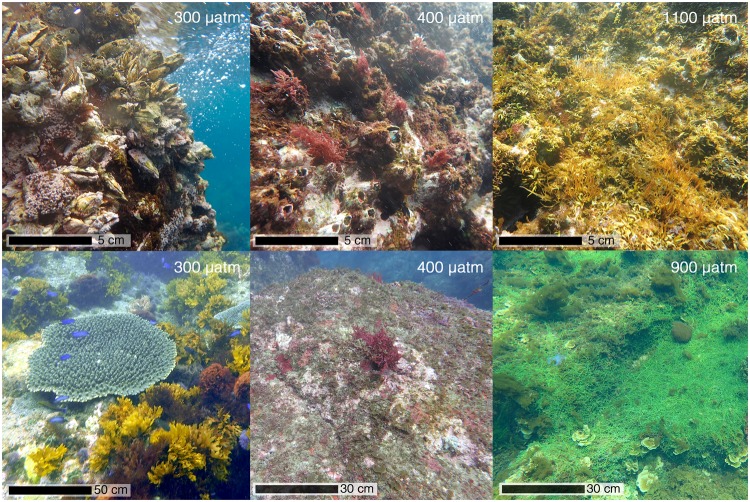
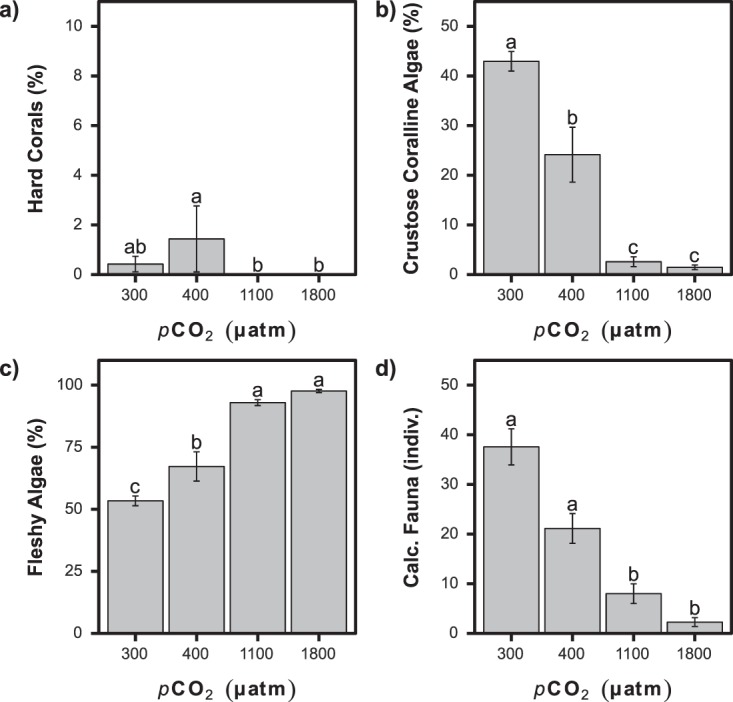
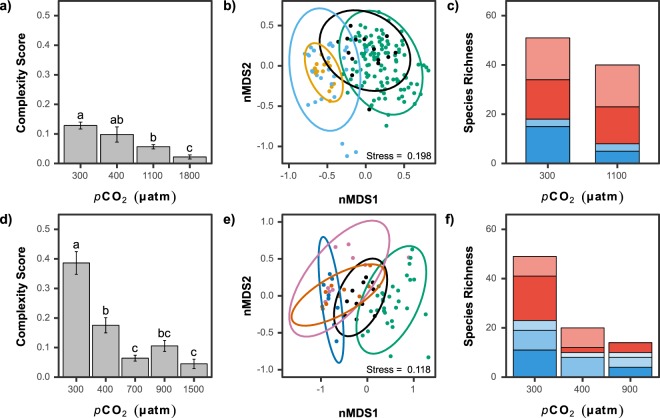
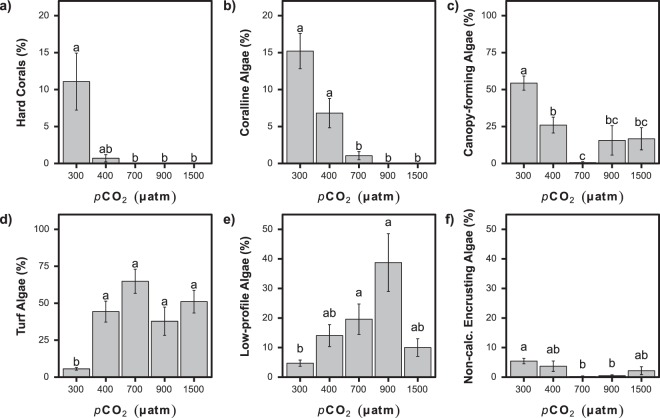
Rising atmospheric concentrations of carbon dioxide are causing surface seawater pH and carbonate ion concentrations to fall in a process known as ocean acidification. To assess the likely ecological effects of ocean acidification we compared intertidal and subtidal marine communities at increasing levels of pCO2 at recently discovered volcanic seeps off the Pacific coast of Japan (34° N). This study region is of particular interest for ocean acidification research as it has naturally low levels of surface seawater pCO2 (280-320 µatm) and is located at a transition zone between temperate and sub-tropical communities. We provide the first assessment of ocean acidification effects at a biogeographic boundary. Marine communities exposed to mean levels of pCO2 predicted by 2050 experienced periods of low aragonite saturation and high dissolved inorganic carbon. These two factors combined to cause marked community shifts and a major decline in biodiversity, including the loss of key habitat-forming species, with even more extreme community changes expected by 2100. Our results provide empirical evidence that near-future levels of pCO2 shift sub-tropical ecosystems from carbonate to fleshy algal dominated systems, accompanied by biodiversity loss and major simplification of the ecosystem.


Conflict of interest statement

The authors declare no competing interests.

Figures

Figure 1
Figure 1
Study area (Shikine-Jima, Japan) showing intertidal and subtidal stations, and the spatial variability in pCO2. The spatial distribution of pCO2 was computed using the nearest neighbour algorithm in ArcGIS 10.2 software (http://www.esri.com/software/arcgis/). ‘*’Indicates sites where 24-hour measurements of carbonate chemistry were taken.
Figure 2
Figure 2
Variation of temperature and pH (total scale) over the month of June 2016 at a subtidal control site (‘300 µatm’) and a subtidal elevated CO2 site (‘900 µatm’). Measurements were carried out with the SeaFETs sensors deployed just above the seafloor.
Figure 3
Figure 3
Representative ecological communities at increasing pCO2 levels. The top panels represent intertidal communities associated with mean levels of 300, 400 and 1100 µatm pCO2. The bottom panels represent subtidal communities associated with mean levels of 300, 400 and 900 µatm pCO2.
Figure 4
Figure 4
Changes in abundance (mean ± SE) of taxa (mean ± SE) with increasing pCO2 for the intertidal habitat. (a) Hard corals. (b) Coralline algae. (c) Fleshy algae. (d) Calcified fauna. A significant difference between pCO2 groups is indicated with a different letter (Kruskal-Wallis with Bonferroni-adjusted Fisher’s least significant difference).
Figure 5
Figure 5
Changes in habitat complexity (mean ± SE), communities, and species richness with increasing pCO2 for intertidal (ac) and subtidal (df) habitats. (a,d) A significant difference between pCO2 groups is indicated with a different letter (Kruskal-Wallis with Bonferroni-adjusted Fisher’s least significant difference). (b,e) The change in communities are illustrated by an nMDS plot based on Bray Curtis distance. The colour of each point represents the pCO2: green: ‘300 µatm’, black: ‘400 µatm’, light blue: ‘1100 µatm’ and orange: ‘1800 µatm’ for the intertidal and green: ‘300 µatm’, black: ‘400 µatm’, blue: ‘700 µatm’, red: ‘900 µatm’ and pink: ‘1500 µatm’ for the subtidal. Ellipses represent the 95% interval confidence. (c,f) Algal (blue) and faunal (red) species richness are shown with darker colours used for species only found in that site, and lighter shades for species that overlap across two sites. For the subtidal, the species overlap are graduated (from darkest to lightest) in the following order: 300–400 µatm, 300–900 µatm and 400–900 µatm (no species were common to all three sites).
Figure 6
Figure 6
Changes in abundance (mean ± SE) of taxa with increasing pCO2 for the subtidal habitat. (a) Hard corals. (b) Coralline algae. (c) Canopy-forming fleshy algae. (d) Turf algae. (e) Low-profile fleshy algae. (f) Non-calcified encrusting algae. A significant difference between pCO2 groups is indicated with a different letter (Kruskal-Wallis with Bonferroni-adjusted Fisher’s least significant difference).

References

    1. IPCC. Climate Change 2013 - The Physical Science Basis: Working Group I Contribution to the Fifth Assessment Report of the IPCC. 1535 (Cambridge University Press, 2013).
    1. Harvey BP, Gwynn-Jones D, Moore PJ. Meta-analysis reveals complex marine biological responses to the interactive effects of ocean acidification and warming. Ecol. Evol. 2013;3:1016–1030. doi: 10.1002/ece3.516. - DOI - PMC - PubMed
    1. Connell SD, Kroeker KJ, Fabricius KE, Kline DI, Russell BD. The other ocean acidification problem: CO as a resource among competitors for ecosystem dominance. Philos. Trans. Royal Soc. B. 2013;368:20120442. doi: 10.1098/rstb.2012.0442. - DOI - PMC - PubMed
    1. Harvey BP, Moore PJ. Ocean warming and acidification prevents compensatory response in a predator to reduced prey quality. Mar. Ecol. Prog. Ser. 2016;563:111–122. doi: 10.3354/meps11956. - DOI
    1. Sunday JM, et al. Ocean acidification can mediate biodiversity shifts by changing biogenic habitat. Nat. Clim. Change. 2017;7:81–85. doi: 10.1038/nclimate3161. - DOI

Publication types