

Skeletal muscle cutoff values for sarcopenia diagnosis using T10 to L5 measurements in a healthy US population
- PMID: 30054580
- PMCID: PMC6063941
- DOI: 10.1038/s41598-018-29825-5
Skeletal muscle cutoff values for sarcopenia diagnosis using T10 to L5 measurements in a healthy US population
Abstract
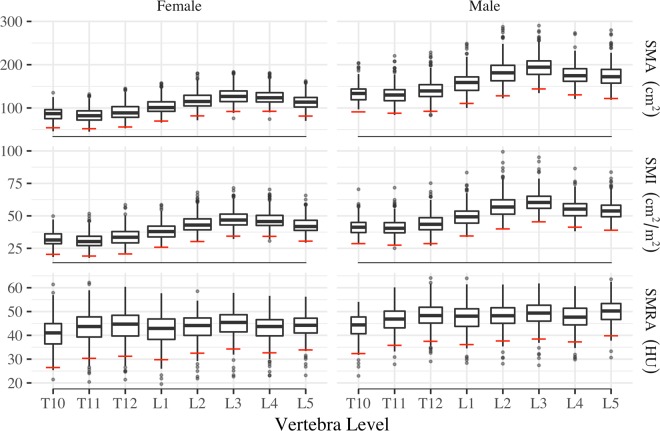
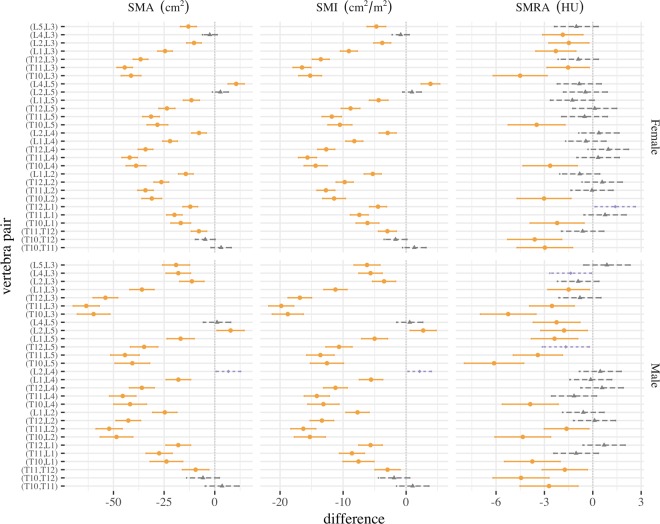
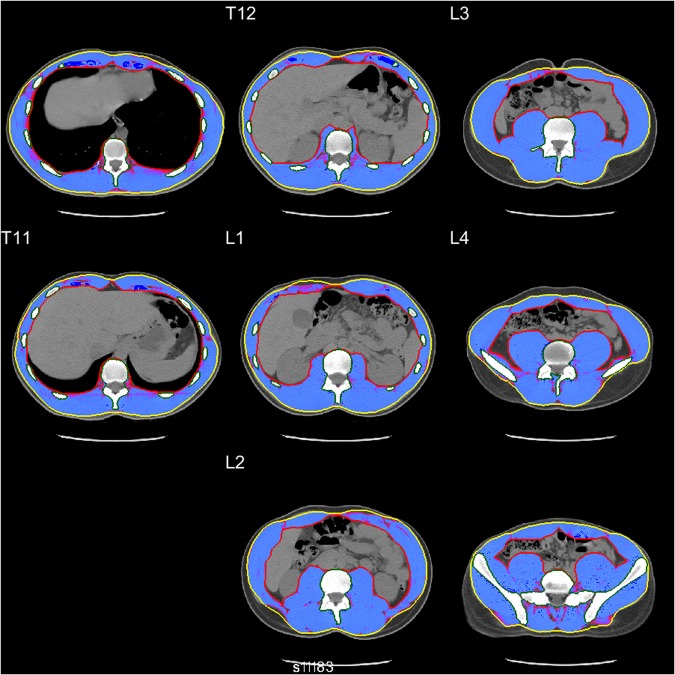
Measurements of skeletal muscle cross-sectional area, index, and radiation attenuation utilizing clinical computed tomography (CT) scans are used in assessments of sarcopenia, the loss of skeletal muscle mass and function associated with aging. To classify individuals as sarcopenic, sex-specific cutoffs for 'low' values are used. Conventionally, cutoffs for skeletal muscle measurements at the level of the third lumbar (L3) vertebra are used, however L3 is not included in several clinical CT protocols. Non-contrast-enhanced CT scans from healthy kidney donor candidates (age 18-40) at Michigan Medicine were utilized. Skeletal muscle area (SMA), index (SMI), and mean attenuation (SMRA) were measured at each vertebral level between the tenth thoracic (T10) and the fifth lumbar (L5) vertebra. Sex-specific means, standard deviations (s.d.), and sarcopenia cutoffs (mean-2 s.d.) at each vertebral level were computed. Associations between vertebral levels were assessed using Pearson correlations and Tukey's difference test. Classification agreement between different vertebral level cutoffs was assessed using overall accuracy, specificity, and sensitivity. SMA, SMI, and SMRA L3 cutoffs for sarcopenia were 92.2 cm2, 34.4 cm2/m2, and 34.3 HU in females, and 144.3 cm2, 45.4 cm2/m2, and 38.5 HU in males, consistent with previously reported cutoffs. Correlations between all level pairs were statistically significant and high, ranging from 0.65 to 0.95 (SMA), 0.64 to 0.95 (SMI), and 0.63 to 0.95 (SMRA). SMA peaks at L3, supporting its use as the primary site for CT sarcopenia measurements. However, when L3 is not available alternative levels (in order of preference) are L2, L4, L5, L1, T12, T11, and T10. Healthy reference values reported here enable sarcopenia assessment and sex-specific standardization of SMA, SMI, and SMRA in clinical populations, including those whose CT protocols do not include L3.
Conflict of interest statement
Brian A. Derstine, Brian E. Ross, Nicholas C. Wang, and Grace L. Su declare that they have no conflict of interest. Sven A. Holcombe and Stewart C. Wang are listed as inventors on a US Patent for Analytic Morphomics (#US 20140064583 A1).
Figures
References
-
- White JV, Guenter P, Jensen G, Malone A, Schofield M. Consensus statement of the academy of nutrition and dietetics/american society for parenteral and enteral nutrition: characteristics recommended for the identification and documentation of adult malnutrition (undernutrition) Journal of the Academy of Nutrition and Dietetics. 2012;112:730–738. doi: 10.1016/j.jand.2012.03.012. - DOI - PubMed
-
- Prado, C. M. et al. Prevalence and clinical implications of sarcopenic obesity in patients with solid tumours of the respiratory and gastrointestinal tracts: a population-based study. Lancet Oncol9, 629–35 https://www.ncbi.nlm.nih.gov/pubmed/18539529, 10.1016/s1470-2045(08)70153-0 (2008). - PubMed
-
- Prado, C. M. et al. Sarcopenia as a determinant of chemotherapy toxicity and time to tumor progression in metastatic breast cancer patients receiving capecitabine treatment. Clin Cancer Res15, 2920–6 http://clincancerres.aacrjournals.org/content/clincanres/15/8/2920.full.pdf, 10.1158/1078-0432.ccr-08-2242 (2009). - PubMed
MeSH terms
LinkOut - more resources
Full Text Sources
Other Literature Sources
Research Materials
