. 2018 Sep;596(18):4511-4536.
doi: 10.1113/JP275814. Epub 2018 Aug 18.

Uncovering a critical period of synaptic imbalance during postnatal development of the rat visual cortex: role of brain-derived neurotrophic factor

Affiliations

Uncovering a critical period of synaptic imbalance during postnatal development of the rat visual cortex: role of brain-derived neurotrophic factor

Hanmeng Zhang et al. J Physiol. 2018 Sep.

Abstract

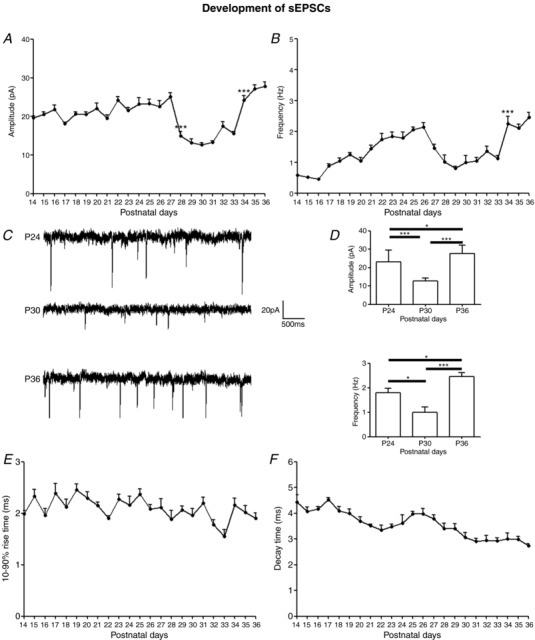
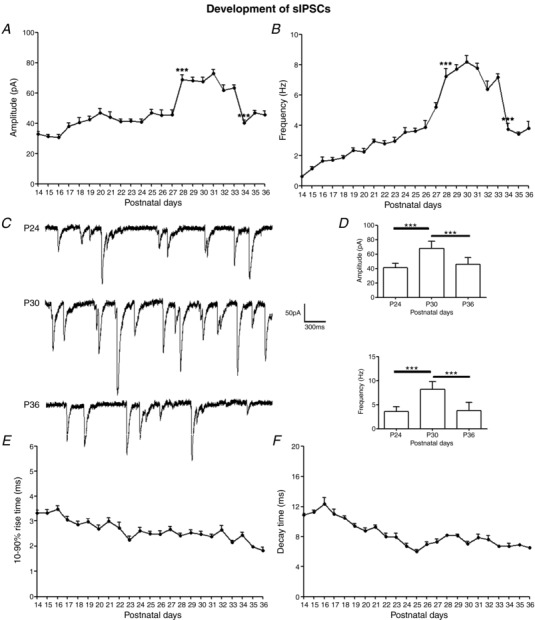
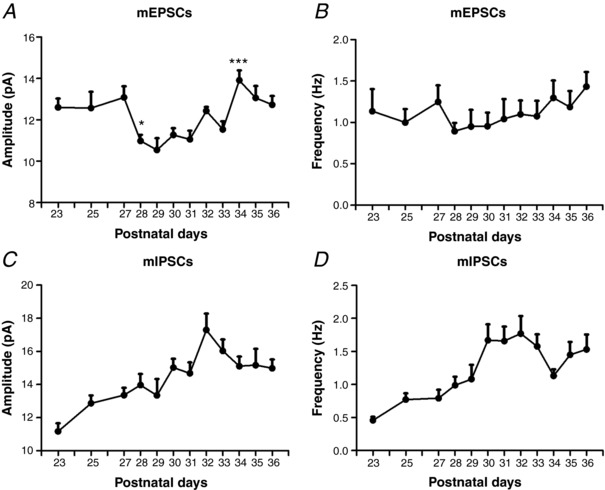
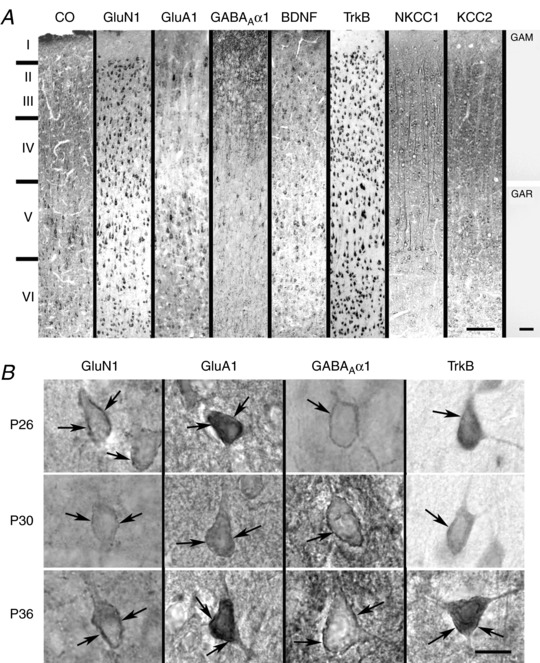
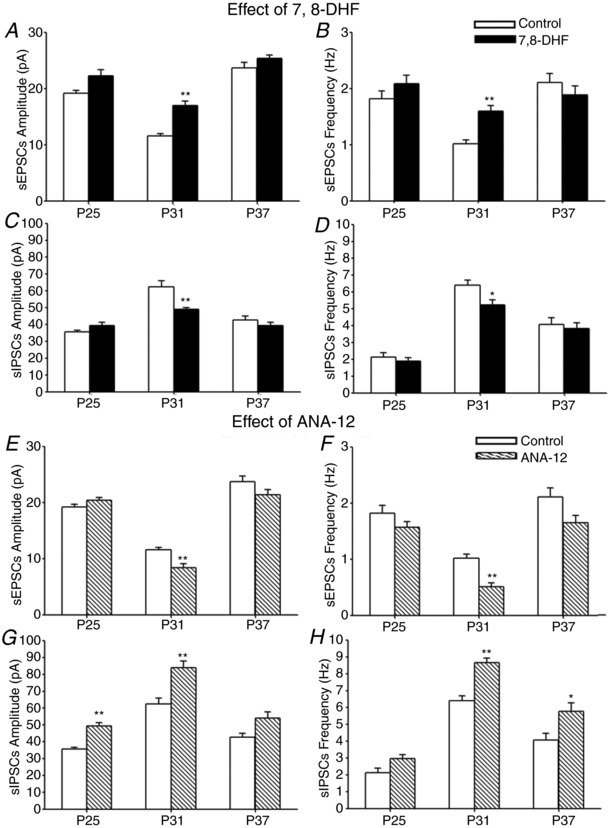
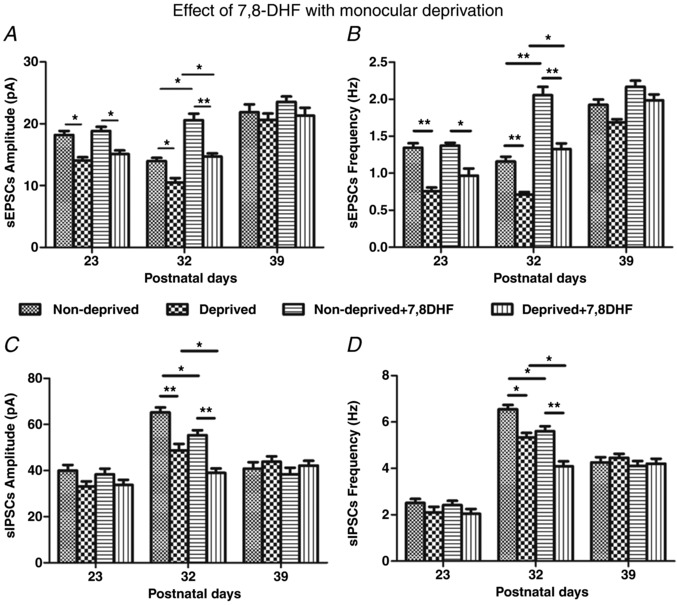
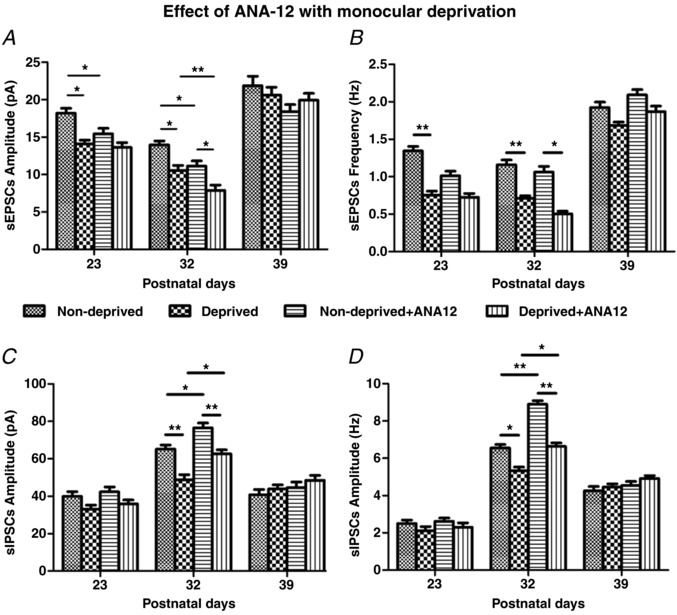
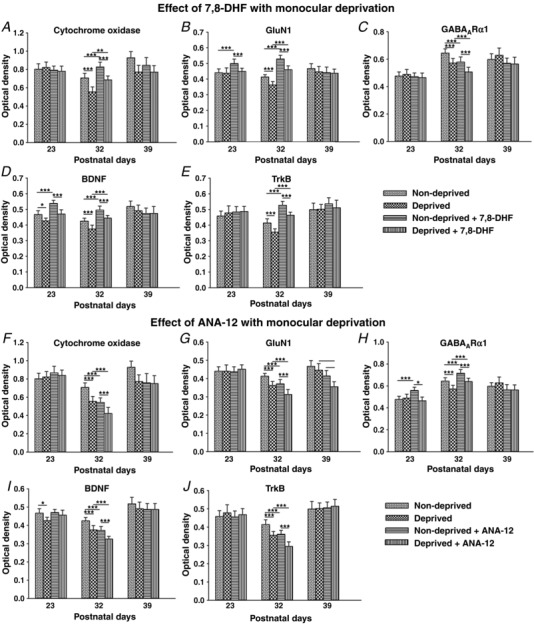
Key points: With daily electrophysiological recordings and neurochemical analysis, we uncovered a transient period of synaptic imbalance between enhanced inhibition and suppressed excitation in rat visual cortical neurons from the end of the fourth toward the end of the fifth postnatal weeks. The expression of brain-derived neurotrophic factor (BDNF), which normally enhances excitation and suppresses inhibition, was down-regulated during that time, suggesting that this may contribute to the inhibition/excitation imbalance. An agonist of the BDNF receptor tropomyosin-related kinase B (TrkB) partially reversed the imbalance, whereas a TrkB antagonist accentuated the imbalance during the transient period. Monocular lid suture during the transient period is more detrimental to the function and neurochemical properties of visual cortical neurons than before or after this period. We regard the period of synaptic imbalance as the peak critical period of vulnerability, and its existence is necessary for neurons to transition from immaturity to a more mature state of functioning.

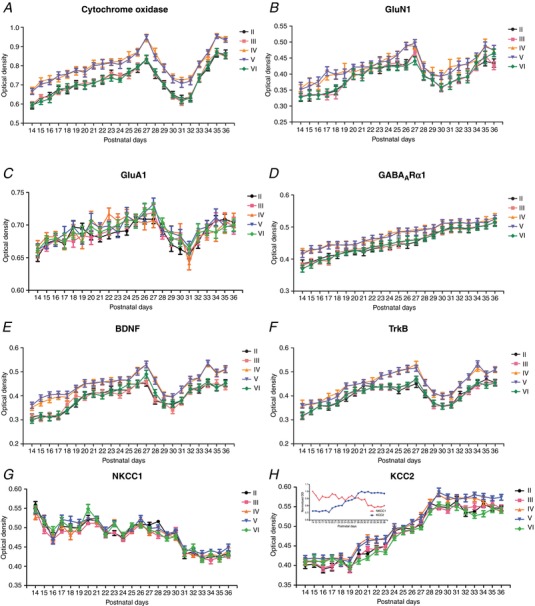
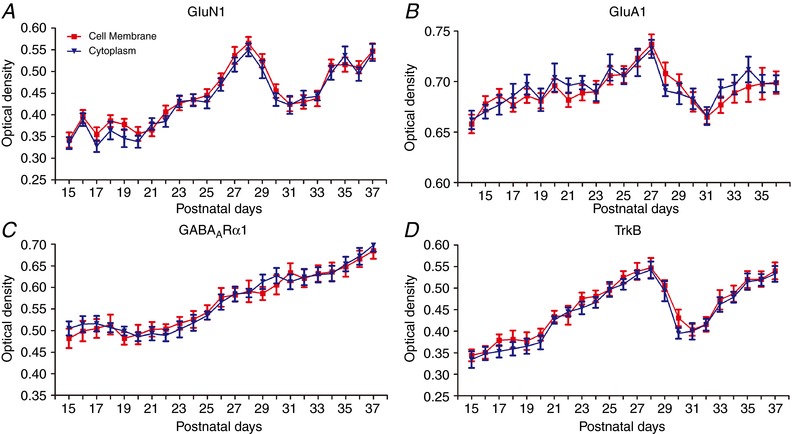
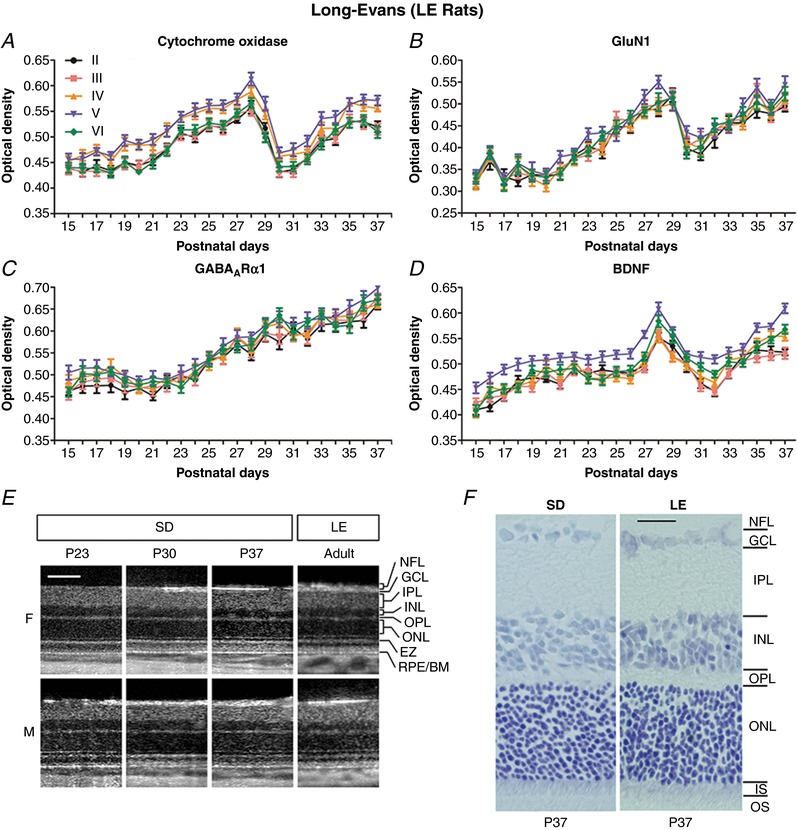
Abstract: The mammalian visual cortex is immature at birth and undergoes postnatal structural and functional adjustments. The exact timing of the vulnerable period in rodents remains unclear. The critical period is characterized by inhibitory GABAergic maturation reportedly dependent on brain-derived neurotrophic factor (BDNF). However, most of the studies were performed on experimental/transgenic animals, questioning the relationship in normal animals. The present study aimed to conduct in-depth analyses of the synaptic and neurochemical development of visual cortical neurons in normal and monocularly-deprived rats and to determine specific changes, if any, during the critical period. We found that (i) against a gradual increase in excitation and inhibition with age, a transient period of synaptic and neurochemical imbalance existed with suppressed excitation and enhanced inhibition at postnatal days 28 to 33/34; (ii) during this window, the expression of BDNF and tropomyosin-related kinase B (TrkB) receptors decreased, along with glutamatergic GluN1 and GluA1 receptors and the metabolic marker cytochrome oxidase, whereas that of GABAA Rα1 receptors continued to rise; (iii) monocular deprivation reduced both excitatory and inhibitory synaptic activity and neurochemicals mainly during this period; and (iv) in vivo TrkB agonist partially reversed the synaptic imbalance in normal and monocularly-deprived neurons during this time, whereas a TrkB antagonist accentuated the imbalance. Thus, our findings highlight a transitory period of synaptic imbalance with a negative relationship between BDNF and inhibitory GABA. This brief critical period may be necessary in transitioning from an immature to a more mature state of visual cortical functioning.

Keywords: BDNF; critical period; immunohistochemistry; monocular deprivation; patch-clamp recording; visual cortex.


Figures

Figure 1
Figure 1. Development of sEPSCs in the rat visual cortex
A and B, mean amplitudes and frequencies of sEPSCs in layer V pyramidal neurons recorded daily from P14 to P36. The amplitudes decreased significantly at P28 (P < 0.001) and remained low until rising at P34 (P < 0.001) to P27 levels. The frequencies decreased gradually from P27 to P29 and stayed low until increasing significantly at P34 (P < 0.001). N ≥ 15 from at least two litters for each time point tested.C, sample traces of sEPSCs at P24, P30 and P36. D, histograms and comparisons of mean ± SEM amplitudes and frequencies of sEPSC at P24, P30 and P36. All pairwise comparisons are significant. For amplitudes, P24 vs. P30: *** P < 0.001; P30 vs. P36: *** P < 0.001; P24 vs. P36: * P = 0.0312. For frequencies, P24 vs. P30: * P = 0.0112; P30 vs. P36: *** P < 0.001; P24 vs. P36: * P = 0.0111. E, 10–90% rise time of sEPSCs remained stable with age (mean ± SEM). F, decay time of sEPSCs (mean ± SEM) accelerated with age (P14 vs. P36: P < 0.001).
Figure 2
Figure 2. Development of sIPSCs in the rat visual cortex
A and B, mean amplitudes and frequencies of sIPSCs in layer V pyramidal neurons daily from P14 to P36. Both parameters increased significantly at P28 (P < 0.001 for both) and stayed high until falling abruptly at P34 (P < 0.001 for both). N ≥ 15 from at least two litters for each time point tested. C, sample traces of sIPSCs recorded at P24, P30 and P36. D, histograms and comparisons of mean ± SEM amplitudes and frequencies of sIPSCs at P24, P30 and P36. Pairwise comparisons reaching significance are indicated with asterisks. For amplitudes, P24 vs. P30: *** P < 0.001; P30 vs. P36: *** P < 0.001. For frequencies, P24 vs. P30: *** P < 0.001; P30 vs. P36: *** P < 0.001. E, 10–90% rise time of sIPSCs (mean ± SEM) with age. F, decay time of sIPSCs (mean ± SEM) with age. Both rise time and decay time accelerated with age (P14 vs. P36: P < 0.001 for both).
Figure 3
Figure 3. Development of mEPSCs and mIPSCs in the rat visual cortex
Amplitudes and frequencies of mEPSCs (A and B) and IPSCs (C and D) in layer V pyramidal neurons at representative time points from P23 to P36. One‐way ANOVA indicated significant differences among the ages for the amplitudes of mEPSCs (A) and for both the amplitudes and frequencies of mIPSCs (C and D) (P < 0.01 for all). Tukey's tests comparing one age group with the immediately adjacent younger age group revealed a significant decrease in the amplitude of mEPSCs at P28 (P < 0.05) and a significant increase in the amplitude of mEPSCs at P34 (P < 0.05). N for mEPSCs at each time point between P23 and P27 = 13–30; at P28–P33 = 26–37; and at P34–P36 = 21–37; N for mIPSCs at each time point between P23 and P27 = 19–46; at P28–P33 = 29–40; and at P34–P36 = 16–45.
Figure 4
Figure 4. E/I ratio and AMPA/NMDA receptor‐mediated eEPSC ratio
A, sample tracings of eIPSCs (voltage clamped at 0 mV) and eEPSCs (voltage clamped at ‐60 mV) recorded at P18 and P28. The amplitude of eIPSC was greater and that of eEPSC was less at P28 compared to those at P18. B, E/I ratio of P18, P25, P28 and P36, respectively. The E/I at P28 (N = 9; 6 stimulations for each cell) was significantly less than those at P18 (N = 9), P25 (N = 9) and P36 (N = 5). P < 0.0001 for all comparisons. C, representative tracings of AMPA and NMDA receptor‐mediated eEPSCs at P23–P24, P28 and P35. D, AMPA/NMDA receptor‐mediated synaptic ratio at P23–P24 (N = 8), P28 (N = 6) and P35–P36 (N = 6). No significant differences were found among the three groups.
Figure 5
Figure 5. Neurochemical expression in the rat visual cortex
A, sample low magnification images of the primary visual cortex reacted histochemically for cytochrome oxidase (CO) and immunohistochemically for GluN1, GluA1, GABAARα1, BDNF, TrkB, NKCC1 and KCC2 at P26. Cortical layers are indicated on the left. Far right: two controls without primary antibodies but with secondary antibodies only: GAM, goat‐anti‐mouse; GAR, goat‐anti‐rabbit secondary antibodies. B, higher magnification images of membrane labelling (arrows) of GluN1, GluA1, GABAARα1 and TrkB in layer V pyramidal neurons at P26, P30 and P36. Scale bars in (A): 100 μm; in (B): 10 μm.
Figure 6
Figure 6. Neurochemical development of visual cortical neurons in each of the five cellular layers (II–VI) daily from P14 to P36
AH, optical densitometric analysis of reaction product of CO histochemistry (A) or of immunohistochemistry against GluN1 (B), GluA1 (C), GABAARα1 (D), BDNF (E), TrkB (F), NKCC1 (G) and KCC2 (H) in single neurons of each of the five cellular layers. Note the fall in the expression of CO, GluN1, GluA1, BDNF and TrkB between P28 and P33/P34. On the other hand, the expression of GABAARα1 continued to rise with age. The expression of NKCC1 decreased with age, whereas that of KCC2 increased with age. The two trends intersected at around P27 (H, inset). N = 100–150 from at least two litters for each time point tested.
Figure 7
Figure 7. Comparisons between plasma membrane and cytoplasmic labeling during neurochemical development
Optical densitometric analysis of the cell membrane vs. cytoplasmic labelling of GluN1 (A), GluA1 (B), GABAARα1 (C) and TrkB (D) in layer V pyramidal neurons daily, from P14/P15 to P36/P37. (A), (C) and (D) are from LE rats and (B) is from SD rats. The developmental trends are comparable, except that LE rats opened their eyes 1 day later (P15) than the SD rats. The developmental trends of cell membrane and cytoplasmic labelling are almost identical for each neurochemical tested. N = 100 neurons for neurochemical at each time point. The same neurons were analysed for both membrane and cytoplasmic labelling.
Figure 8
Figure 8. Developmental comparisons between Long Evans and Sprague‐Dawley rats at the cortical and retinal levels
AD, neurochemical development of layers II to VI visual cortical neurons in LE rats. A 1‐day delay in eye opening in these rats led to analysis from P15 to P37. The developmental trends of CO (A), GluN1 (B), GABAARα1 (C) and BDNF (D) in LE rats were virtually identical to those of SD rats (Fig. 6). N = 50–100 neurons from two litters for each layer at each time point tested. E, OCT of SD and adult LE rats. No evidence of major retinal changes was observed in SD rats from the third to fifth postnatal weeks. Log intensity OCT images from the same female (F) and male (M) SD rats at P23, P30 and P37 are shown. For comparison, images from an adult female and an adult male LE rats are included at approximately the same retinal location. For display purposes, images have been manually contrast stretched. Scale bar: 100 μm. F, Nissl‐stained retinal sections from SD and LE rats, both at P37. All retinal layers were comparable in thickness between the two strains. NFL, nerve fiber layer; GCL, ganglion cell layer; IPL, inner plexiform layer; INL, inner nuclear layer; OPL, outer plexiform layer; ONL, outer nuclear layer; EZ, ellipsoid zone of the inner segment of photoreceptor cells; IS, inner segment; OS, outer segment of photoreceptors; RPE/BM, retinal pigmented epithelium/Bruch's membrane. Scale bar: 25 μm.
Figure 9
Figure 9. Effects of 7,8‐DHF and ANA‐12 on sEPSCs and sIPSCs
Effect of in vivo 7,8‐DHF or ANA‐12 on amplitudes and frequencies of sEPSCs (A, B, E and F) and of sIPSCs (C, D, G and H) at three time points (injections at P23–P24, P29–P30 or P35–P36, and recordings 1 day later at P25, P31 and P37, respectively). Note that 7,8‐DHF significantly increased the amplitudes and frequencies of sEPSC but decreased those of sIPSCs only at P31. N = 14 for controls at P25 and at P37; and N = 15 for controls at P31 and for 7,8‐DHF‐injected at each of the three time points tested for sEPSCs and sIPSCs, respectively. On the other hand, ANA‐12 significantly decreased the amplitudes and frequencies of sEPSC only at P31, whereas it increased those of sIPSCs mainly at P31, and also increased the amplitudes of sIPSCs at P25 and the frequencies at P37. For controls: N = 14 at P25 and at P37, and 15 at P31; for ANA‐12‐treated: N = 15 at P25, 16 at P31 and 14 at P37 for each of sEPSCs and sIPSCs. A, *** P < 0.0003. B, *** P < 0.0003. C, ** P = 0.0036. D, * P = 0.0297. E, *** P < 0.0003. F, *** P < 0.0003. G, *** P < 0.0003 for P25 and ** P = 0.0012 for P31. H, *** P < 0.0003 for P31 and * P = 0.0414 for P37.
Figure 10
Figure 10. Effect of MD on sEPSCs and sIPSCs without or with in vivo 7,8‐DHF
Amplitudes and frequencies of sEPSCs (A and B) and sIPSCs (C and D) in layer V pyramidal neurons of non‐deprived (ipsilateral) and deprived (contralateral) visual cortices recorded 4 days after MD at three time points (P23, P32 or P39). Note that MD reduced the amplitudes and frequencies of sEPSCs but significantly reduced the amplitudes and frequencies of sIPSCs in both non‐deprived and deprived cortical neurons only at P32. N = 8 for non‐deprived neurons at each of the three age groups for sEPSCs or sIPSCs. For deprived neurons, N = 8 at P32 and at P39, and N = 6 at P23 for sEPSCs or sIPSCs. N = 6 for non‐deprived + 7,8‐DHF neurons at each of the three age groups for sEPSCs or sIPSCs. For deprived + 7,8‐DHF neurons, N = 8 at P23 for sEPSCs or sIPSCs, and N = 6 at P32 and at P39 for sEPSCs or sIPSCs. A, at P23: * P = 0.046 for ND vs. D; * P = 0.030 for ND + DHF vs. D + DHF. At P32: * P = 0.040 for ND vs. D; ** P = 0.006 for ND + DHF vs. D + DHF; * P = 0.015 for ND vs. ND + DHF; * P = 0.045 for D vs. D + DHF. B, at P23: ** P = 0.001 for ND vs. D; * P = 0.020 for ND + DHF vs. D + DHF. At P32: ** P = 0.001 for ND vs. D; ** P = 0.002 for ND + DHF vs. D + DHF; ** P = 0.002 for ND vs. ND + DHF; * P = 0.020 for D vs. D + DHF. C, at P32: ** P = 0.002 for ND vs. D; ** P = 0.002 for ND + DHF vs. D + DHF; * P = 0.034 for ND vs. ND + DHF; * P = 0.040 for D vs. D + DHF. D, at P32: * P = 0.010 for ND vs. D; ** P = 0.001 for ND + DHF vs. D + DHF; * P = 0.030 for ND vs. ND + DHF; * P = 0.025 for D vs. D + DHF.
Figure 11
Figure 11. Effect of MD on sEPSCs and sIPSCs without or with in vivo ANA‐12
Comparable experiments as those shown in Fig. 10 were performed, except that 7,8‐DHF was replaced by ANA‐12. Note that MD reduced the amplitudes and frequencies of sEPSCs before and during, but not after the period of synaptic imbalance (A and B). However, it reduced the amplitudes and frequencies of sIPSCs only during the period of synaptic imbalance (P32) (C and D). In vivo ANA‐12 significantly decreased the amplitudes and frequencies of sEPSCs but significantly increased those of sIPSCs in both non‐deprived and deprived cortical neurons only at P32. N = 8 for non‐deprived neurons at each of the three age groups for sEPSCs or sIPSCs. For deprived neurons, N = 8 at P32 and at P39, and N = 6 at P23 for sEPSCs or sIPSCs. For non‐deprived + ANA‐12 neurons, N = 8 at P23, and N = 6 at P32 and at P39 for sEPSCs or sIPSCs. For deprived + ANA‐12 neurons, N = 8 at P23, and N = 6 at P32 and at P39 for sEPSCs or sIPSCs. A, at P23: * P = 0.041 for ND vs. D; * P = 0.046 for ND vs. ND + ANA. At P32: * P = 0.040 for ND vs. D; * P = 0.030 for ND + ANA vs. D + ANA; * P = 0.01538 for ND vs. ND + ANA; ** P = 0.009 for D vs. D + ANA. B, at P23: ** P = 0.001 for ND vs. D. At P32: ** P = 0.001 for ND vs. D; * P = 0.015 for ND + ANA vs. D + ANA. C, at P32: ** P = 0.002 for ND vs. D; ** P = 0.009 for ND + ANA vs. D + ANA; * P = 0.020 for ND vs. ND + ANA; * P = 0.015 for D vs. D + ANA. D, at P32: * P = 0.010 for ND vs. D; ** P = 0.001 for ND + ANA vs. D + ANA; ** P = 0.007 for ND vs. ND + ANA; * P = 0.032 for D vs. D + ANA.
Figure 12
Figure 12. Effect of MD on neurochemical expression without or with in vivo 7,8‐DHF or ANA‐12
Optical densitometric measurements of reaction product of CO (A and F) and immunoreaction product of GluN1 (B and G), GABAARα1 (C and H), BDNF (D and I) and TrkB (E and J) in single, non‐deprived and deprived layer V neurons are shown for the three time points (P23, P32 and P39) after 4 days of MD without or with in vivo 7,8‐DHF or ANA‐12. Comparisons that have reached statistical significance are indicated by asterisks. Changes were most striking at P32. All *** P < 0.001. A, ** P = 0.006 for D vs. D + DHF. B, ** P = 0.005 for ND vs. ND + DHF at P23; ** P = 0.004 for ND + DHF vs. D + ANA at P23. D, * P = 0.023 for ND vs. D at P23. G, * P = 0.016 for D vs. D + ANA at P39; ** P = 0.003 for ND + ANA vs. D + ANA at P39. H, * P = 0.017 for ND + ANA vs. D + ANA. I, * P = 0.023. N = 150 neurons from at least two litters for each bar shown (i.e. for each animal group at each time point and for each neurochemical tested).

Comment in

References

    1. Alvarez‐Leefmans FJ, León‐Olea M, Mendoza‐Sotelo J, Alvarez FJ, Antón B & Garduño R (2001). Immunolocalization of the Na(+)‐K(+)‐2Cl(–) cotransporter in peripheral nervous tissue of vertebrates. Neurosci 104, 569–582. - PubMed
    1. Adotevi NK & Leitch B (2017). Synaptic changes in AMPA receptor subunit expression in cortical parvalbumin interneurons in the Stargazer model of absence epilepsy. Front Mol Neurosci 10, 1–10. - PMC - PubMed
    1. Barde YA, Edgar D & Thoenen H (1982). Purification of a new neurotrophic factor from mammalian brain. EMBO J 1, 549–553. - PMC - PubMed
    1. Ben‐Ari Y (2002). Excitatory actions of GABA during development: the nature of the nurture. Nat Rev Neurosci 3, 728–739. - PubMed
    1. Berger A, Cavallero S, Dominguez E, Barber P, Simonutti M, Sahel JA, Sennlaub F, Raoul W, Paques M & Bemelmans AP (2014). Spectral‐domain optical coherence tomography of the rodent eye: highlighting layers of the outer retina using signal averaging and comparison with histology. PLoS ONE 9, e96494. - PMC - PubMed

Publication types

Substances

LinkOut - more resources