. 2018 Aug 22;7(2):137-145.e3.
doi: 10.1016/j.cels.2018.06.005. Epub 2018 Jul 25.

Signal Percolation within a Bacterial Community

Affiliations

Signal Percolation within a Bacterial Community

Joseph W Larkin et al. Cell Syst. .

Abstract

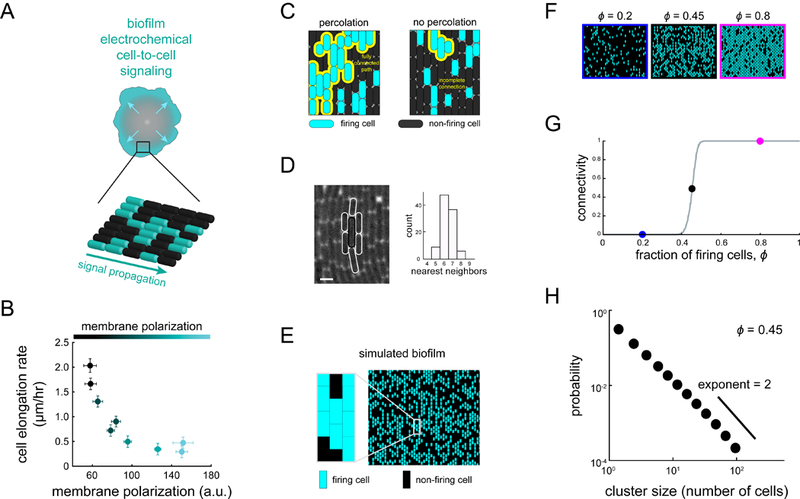
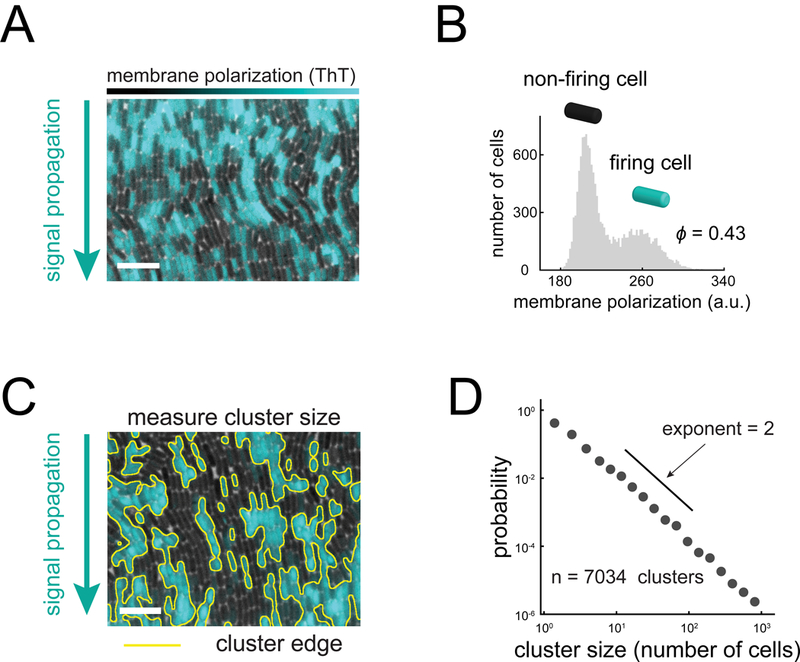
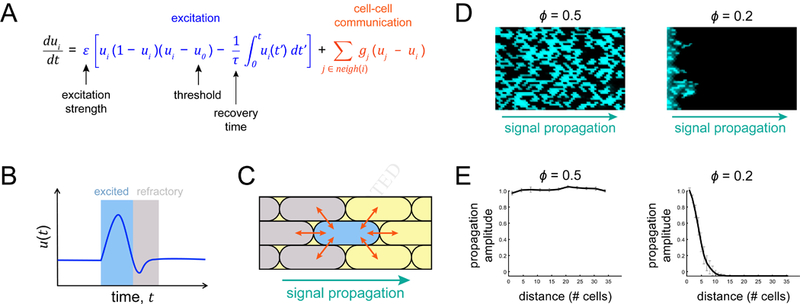
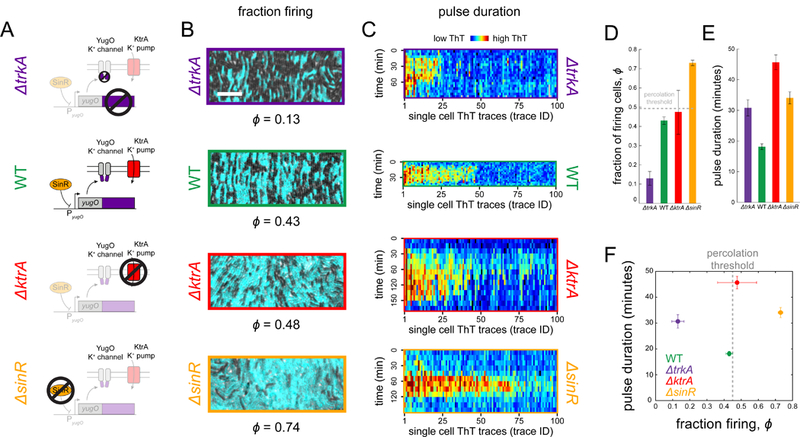
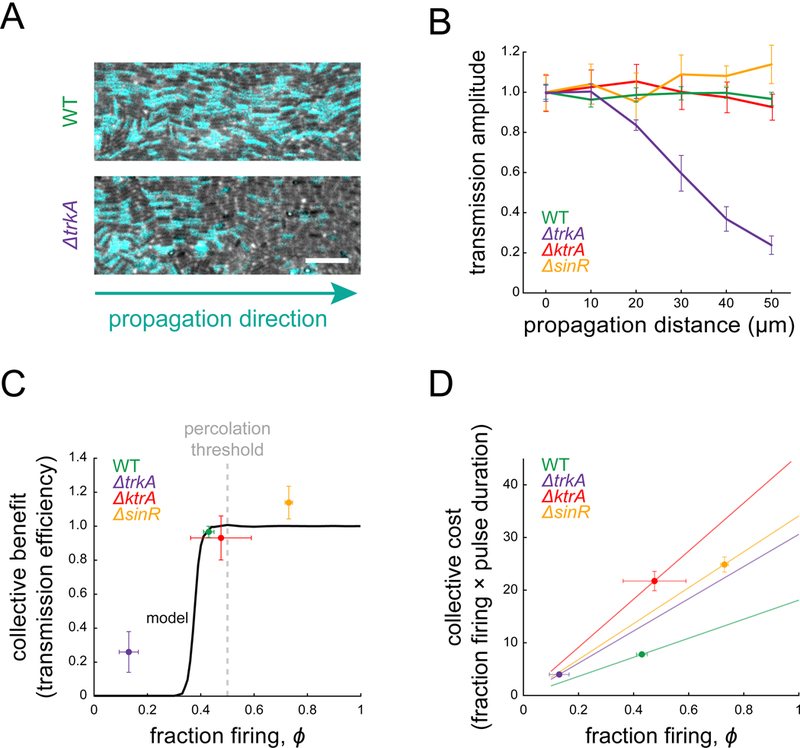
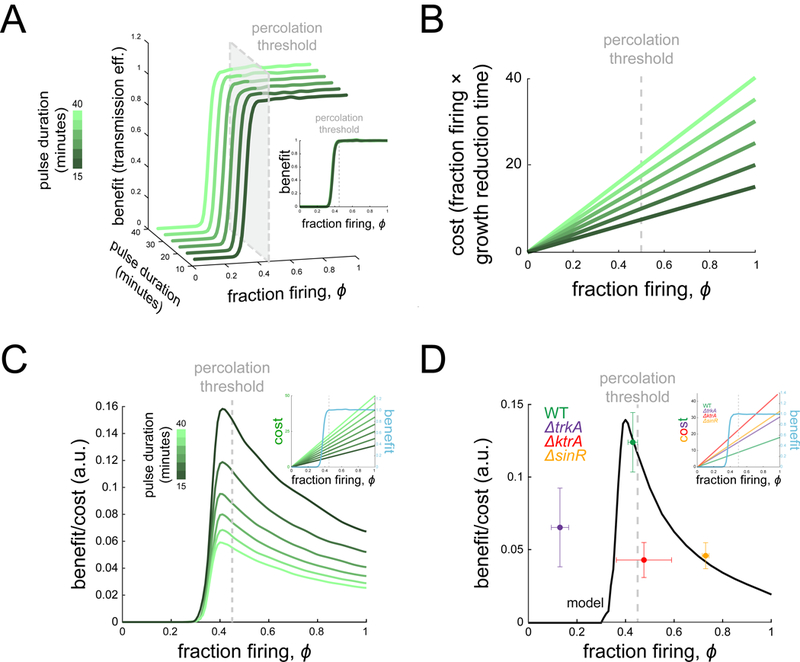
Signal transmission among cells enables long-range coordination in biological systems. However, the scarcity of quantitative measurements hinders the development of theories that relate signal propagation to cellular heterogeneity and spatial organization. We address this problem in a bacterial community that employs electrochemical cell-to-cell communication. We developed a model based on percolation theory, which describes how signals propagate through a heterogeneous medium. Our model predicts that signal transmission becomes possible when the community is organized near a critical phase transition between a disconnected and a fully connected conduit of signaling cells. By measuring population-level signal transmission with single-cell resolution in wild-type and genetically modified communities, we confirm that the spatial distribution of signaling cells is organized at the predicted phase transition. Our findings suggest that at this critical point, the population-level benefit of signal transmission outweighs the single-cell level cost. The bacterial community thus appears to be organized according to a theoretically predicted spatial heterogeneity that promotes efficient signal transmission.

Keywords: biofilms; criticality; percolation; self-organization; signal transmission.


Conflict of interest statement

The authors declare no competing interests.

Figures

Figure 1.
Figure 1.. A percolation theory-based model for electrochemical signaling in biofilms.
(A)Biofilms undergo electrochemical signaling where the stressed biofilm interior periodically signals cells at the biofilm edge (arrows). Bottom cartoon depicts heterogeneous signaling where some cells participate in signaling (cyan), becoming hyperpolarized, while many cells do not participate (black). (B) Cell elongation rate is inversely correlated with membrane polarization, indicating a cost of electrical signaling activity to individual cells (N = 35 cells, error bars indicate ± SEM). (C) Percolation theory predicts the emergence of a connected path of firing cells (yellow line) when the fraction of firing cells exceeds a critical value (left) but not below this critical value (right). (D) Image illustrating a method for counting the number of neighbors for a given cell, highlighted in white (left). Scale bar, 2 μm. Histogram (right) indicates the modal number of nearest neighbors is 6 (N = 100 cells). (E) Using the experimentally constrained nearest neighbor value of 6 (see also Figure S1), firing and non-firing cells are randomly positioned on a two-dimensional lattice with probability ϕ (0.5 in this image). (F) Representative snapshots showing lattice simulations at various values of ϕ (see also Figure S2). (G) Onset of connectivity (percolation) is predicted when ϕ exceeds 0.45. The ϕ values for the representative images in (F) are indicated on the graph by their respective colored circles. (H) Model-generated cluster size distribution at the percolation threshold (ϕ = 0.45), where clusters are distributed according to a power-law.
Figure 2.
Figure 2.. Electrochemical signaling within biofilms is heterogeneous at the single cell- level.
(A) Membrane polarization is heterogeneous at the single cell level within signaling biofilms. Cyan overlay indicates fluorescence of Thioflavin T (ThT), a cationic membrane polarization reporter. Scale bar, 10 μm (see also Figure S3). (B) Histogram of individual cell ThT intensity (N = 14,936 cells) during a signal pulse. The bimodal shape of the histogram indicates that only a fraction of firing cells (cyan) participate in signaling (0.43±0.02, mean+/−SEM). (C) Firing cells are spatially clustered within biofilms. Yellow lines indicate cluster edges identified by image analysis based on ThT fluorescence. Scale bar, 10 μm. (D) Cluster sizes (N = 7,034 clusters) are distributed according to a power-law decay across 3 decades with an approximate exponent of 2. These properties indicate that the arrangement of firing cell clusters within the biofilm can be described by percolation theory.
Figure 3.
Figure 3.. An excitable model for signal propagation in biofilms.
(A) Model equation combines excitation (blue) and cell-cell communication (orange) to give rise to excitable propagation. The geometric factor gj is 1/4 at the cell poles and 1/2 otherwise. (B) A cartoon trace illustrates firing (blue-shading) followed by a refractory period (gray-shading) for a given excitable cell. (C) Cell-cell communication (arrows) allows directional signal propagation from one cell to another. Refractory cells are gray and excited cells are blue. (D) Example model snapshots depict complete signal propagation (direction indicated by arrow, Ɛ = 10 for active cells) in the regime above the percolation threshold (left, ϕ = 0.5) and incomplete signal propagation below the percolation threshold (right, ϕ = 0.2). Both cases have the same values for the dynamic parameters, uo = 0.01, τ = 300. (E) Example amplitude profiles for the images shown in (D).
Figure 4.
Figure 4.. Experimental tuning of firing cell fraction and pulse duration with mutant biofilms.
(A) A series of cartoons illustrates the function of genes deleted in the mutant strains. (B) Representative images from time points of peak signaling activity depicting the fraction of firing cells for each strain (cyan ThT fluorescence). Scale bar, 10 μm. (C) Heatmaps depict single cell ThT trajectories (N = 100) for all strains. Each column is one cell trace, with time progressing downwards. The color-scale varies across strains due to baseline fluorescence differences among experiments (see also Figure S5). (D) Mutant strains exhibit decreased (ΔtrkA, 0.13±0.04, N = 7, mean ± SEM) or increased (ΔsinR, 0.74±0.04, N = 4 and ΔktrA 0.48±0,11, N = 4) fraction of firing cells relative to wild-type (0.43±0.02, N = 12). Wild-type is near, but slightly below, the percolation threshold, ϕc = 0.45. The ΔtrkA strain (purple), which lacks the gating domain of the potassium channel YugO, is expected to exhibit reduced signaling activity. The ΔktrA strain (red) lacks a potassium uptake pump and is expected to remain hyperpolarized for longer than wild-type. The ΔsinR mutant (orange) lacks a transcription factor (SinR) that represses expression of YugO, resulting in higher signaling activity. (E) Pulse duration measurements, where pulse duration is defined as the amount of time membrane polarization remains above baseline level. All mutant strains (ΔtrkA 30.6±2.6, 124 cells, 3 biofilms, and ΔktrA 45.7±2.4, 204 cells, 3 biofilms, and ΔsinR 34.1±2.0, 165 cells, 3 biofilms, mean ± SEM) have larger pulse durations than wild-type (18.1±1.0, 383 cells, 3 biofilms). (F) A phase plot of pulse duration and fraction firing for each strain. ΔtrkA lies below the percolation threshold (dotted line) and ΔsinR above, both with longer pulse duration than wild-type. Wild-type and ΔktrA lie near the threshold, but with different pulse times.
Figure 5.
Figure 5.. Signal transmission occurs above the percolation threshold.
(A) Phase images with overlaid ThT intensity (cyan) during peak signaling show steady propagation in wild-type (top) and spatial signal decay in ΔtrkA (bottom). Scale bar, 10 μm. (B) Transmission amplitude measurements show that wild-type (N = 7), ΔktrA (N =4), and ΔsinR (N = 4) propagate the signal at a constant amplitude, while ΔtrkA (N = 5) does not. Transmission amplitude is defined as the fraction of firing cells at a given position divided by the firing fraction at the beginning of the field of view (error bars, ± SEM). (C) Collective benefit of signaling is defined as the ratio of transmission amplitudes at the biofilm edge and at the beginning of the field of view. Experimental data are shown by points. The model output for wild-type parameters (black curve) illustrates the non-linear nature of collective benefit. (D) Collective cost of signaling is defined as the product of the firing cell fraction, ϕ, and mean pulse time. Experimental data are shown as points. Lines represent the cost that would be incurred for each strain given its mean pulse time.
Figure 6.
Figure 6.. Cost-benefit negotiation in signal transmission.
(A) The benefit (transmission efficiency) is plotted for different dynamic parameters as a function of ϕ and resulting pulse time (green color scale). When plotted as a function of ϕ only, the curves line up with benefit rising near the threshold (inset). (B) The cost function is plotted for the corresponding benefit curves from (A). (C) Benefit/cost ratio is plotted as a function of ϕ for the different model curves in (A) and (B), illustrating that, no matter the dynamic model parameters, benefit/cost ratio has a peak near the percolation threshold. This comes from the fact that benefit is highly non-linear in ϕ while cost increases smoothly for any set of dynamic parameters (inset). (D) Measured benefit/cost ratio is plotted for each strain (dots), along with the model output given wild-type parameters (curve). The ratio exhibits a peak due to the linear cost but highly non-linear benefit, with wild-type near the maximum (see also Figure S6). Inset plot overlays cost and benefit on separate y axes.

References

    1. Aharony A (1980). Universal critical amplitude ratios for percolation. Phys. Rev. B 22, 400–414.
    1. Alonso S, and Bär M (2016). Reentry produced by small-scale heterogeneities in a discrete model of cardiac tissue. J. Phys.: Conf. Ser. 727, 012002.
    1. Asally M, Kittisopikul M, Rué P, Du Y, Hu Z, Çağatay T, Robinson AB, Lu H, Garcia- Ojalvo J, and Süel GM (2012). Localized cell death focuses mechanical forces during 3D patterning in a biofilm. Proc. Natl. Acad. Sci. U. S. A. 109, 18891–18896. - PMC - PubMed
    1. Bak P, Chen K, and Tang C (1990). A forest-fire model and some thoughts on turbulence. Phys. Lett. A 147, 297–300.
    1. Bär M, Bangia AK, Kevrekidis IG, Haas G, Rotermund HH, and Ertl G (1996). Composite Catalyst Surfaces: Effect of Inert and Active Heterogeneities on Pattern Formation. J. Phys. Chem. 100, 19106–19117.

Publication types