. 2018 Aug 9;174(4):884-896.e17.
doi: 10.1016/j.cell.2018.06.032. Epub 2018 Jul 26.

Systematic Nanoscale Analysis of Endocytosis Links Efficient Vesicle Formation to Patterned Actin Nucleation

Affiliations

Systematic Nanoscale Analysis of Endocytosis Links Efficient Vesicle Formation to Patterned Actin Nucleation

Markus Mund et al. Cell. .

Abstract

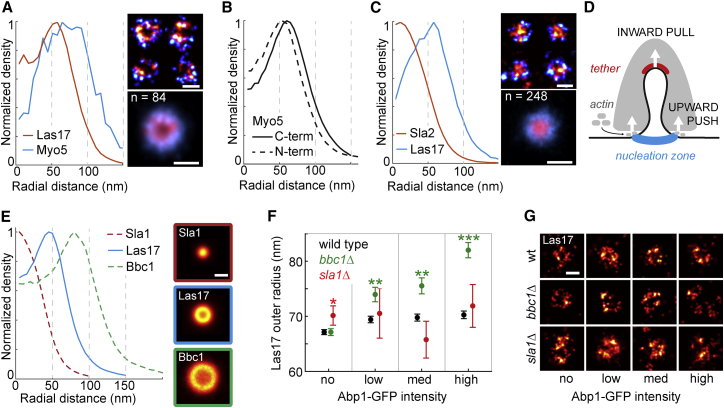
Clathrin-mediated endocytosis is an essential cellular function in all eukaryotes that is driven by a self-assembled macromolecular machine of over 50 different proteins in tens to hundreds of copies. How these proteins are organized to produce endocytic vesicles with high precision and efficiency is not understood. Here, we developed high-throughput superresolution microscopy to reconstruct the nanoscale structural organization of 23 endocytic proteins from over 100,000 endocytic sites in yeast. We found that proteins assemble by radially ordered recruitment according to function. WASP family proteins form a circular nanoscale template on the membrane to spatially control actin nucleation during vesicle formation. Mathematical modeling of actin polymerization showed that this WASP nano-template optimizes force generation for membrane invagination and substantially increases the efficiency of endocytosis. Such nanoscale pre-patterning of actin nucleation may represent a general design principle for directional force generation in membrane remodeling processes such as during cell migration and division.

Keywords: Brownian dynamics simulations; SMLM; WASP; actin; clathrin; endocytosis; high-throughput; single-molecule localization microscopy; superresolution microscopy.


Figures

None
Graphical abstract
Figure 1
Figure 1
High-Throughput Superresolution Imaging of Endocytosis in Yeast (A) Fixed yeast cells expressing fluorescently tagged endocytic proteins were imaged using 2D high-throughput superresolution microscopy with the focal plane at the bottom of the cells. Images contain the 2D projection of the entire endocytic site in the membrane plane. (B–E) Cells (B) and endocytic sites were automatically segmented only in the center of cells (C) to avoid tilted structures. Individual endocytic sites (D) were analyzed by fitting a single geometric model (E) to determine center coordinates x0, y0, outer radius rout, and a rim with a thickness dr. The model accounts for the localization precision and describes both patch-like (dr ≥ rout) and ring-like (dr < rout) structures. (F) The radial density distribution around x0, y0 was calculated for each site. (G) Using x0, y0 individual sites were aligned by translation, and the average protein distribution and radial density profiles were calculated. Scale bars represent 100 nm. See also Figures S1, S2, and S3 and Table S1.
Figure S1
Figure S1
Overview of Imaged Endocytic Proteins (Part 1/3), Related to Figures 1 and 2 (A and B) Shown are superresolved images of cells where the focal plane was positioned on the midplane (A) and bottom (B) of the cells. (C) Shows example endocytic sites focused as in (B). (D) Shows average radial profiles. Shaded areas correspond to the standard deviation (left) or standard error of the mean (right). (E) Shows the average image. The number of sites, fraction of rings as obtained by the fit from the dr/rout values (see the STAR Methods for details), the half-maximum of radial profiles (HWHM), as well as the mean and standard deviation of the outer radius as obtained by the fit are indicated. Scale bars 1 μm (A and B) or 100 nm (C and E).
Figure S2
Figure S2
Overview of Imaged Endocytic Proteins (Part 2/3), Related to Figures 1 and 2 (A–E) As in Figure S1. Scale bars 1 μm (A and B) or 100 nm (C and E).
Figure S3
Figure S3
Overview of Imaged Endocytic Proteins (Part 3/3), Related to Figures 1 and 2 (A–E) As in Figure S1. Scale bars 1 μm (A and B) or 100 nm (C and E).
Figure 2
Figure 2
Average Radial Distribution of 23 Proteins in the Endocytic Machinery (A) Endocytic proteins form very diverse structures. Shown are the average images for 23 endocytic proteins (for a description, see text). (B) Side-view schematic of structures formed by the endocytic modules on the plasma membrane. (C) Outer radii of structures of 23 endocytic proteins (mean ± SEM; number of sites and SD in Table S1). Mammalian homologs in parentheses, as identified in Weinberg and Drubin (2012). (D–G) Average radial profiles of endocytic proteins in the early (D), coat (E), WASP (F), and actin (G) modules. Shaded areas indicate the endocytic coat (beige, profile of Pan1) and WASP modules (blue, profile of Las17). (H) Average radial profiles of Ede1, Pan1, and Las17 after LatA treatment, analyzed both in living and in fixed cells. Scale bars represent 100 nm. See Figures S1, S2, S3, and S4 for representative images of all proteins.
Figure S4
Figure S4
Ede1, Pan1, and Las17 Structures after Latrunculin A Treatment, Related to Figure 2H (A–F) Shown are images of fixed (A, C, and E) and living (B, D, and F) cells, where endocytic sites have been arrested on flat membranes using Latrunculin A. (A and B) Show cells expressing Ede1-mMaple and Sla2-GFP. (C and D) Show cells expressing Pan1-mMaple and Abp1-GFP. The signal from Abp1-GFP was diffuse due to LatA treatment and omitted here. (E and F) Show cells expressing Las17-mMaple and Abp1-GFP. The signal from Abp1-GFP was diffuse due to LatA treatment and omitted here. Boxed regions have been magnified. Scale bars are 1 μm and 100 nm (zoomed regions).
Figure 3
Figure 3
Structural Rearrangements of Key Proteins during Endocytosis (A) Strategy: Staging of endocytosis by combining superresolution imaging with diffraction-limited imaging of Sla2, Abp1, and Rvs167, which each label specific phases of endocytosis. Latrunculin A arrests endocytosis before membrane bending begins (see Figure 2H). (B and C) Ede1 in superresolution overlaid on diffraction-limited images of Sla2-GFP at individual sites (B) and in a cell overview (C). (D) Outer radii of Ede1 sites for no, low, medium, and high Sla2-GFP intensities, as proxy for early to late time points (mean ± SEM; nno = 2514; nlow = nmed = nhigh = 2,634). (E) Dual-color superresolution images of Ede1-mMaple and Sla2-GFP αGFP-nanobody-AF647. Representative individual sites and the average distribution from 267 sites are shown. (F) Corresponding radial profiles. (G–I) Like (B)–(D), but for Pan1 in superresolution and Abp1-GFP as timing marker. (nno = 494; nlow = nmed = nhigh = 98.) (J–L) Like (B)–(D), but for Las17 in superresolution and Abp1-GFP as timing marker. (nno = 2,550; nlow = nmed = nhigh = 1,595.) Scale bars represent 100 nm (B, E, G, and J) and 1 μm (C, H, and K). ∗∗∗p < 0.001 from Wilcoxon rank-sum test. See Figure S5 for radial profiles and Table S2 for data.
Figure S5
Figure S5
Average Radial Profiles of Ede1, Pan1, Las17, and Abp1 Staged Using Diffraction-Limited Timing Markers, Related to Figures 3 and 5 Average radial profiles of (A) Ede1-mMaple staged by Sla2-GFP, (B) Pan1-mMaple staged by Abp1-GFP, (C) Las17 staged by Abp1-GFP, (D) Abp1 staged by Rvs167-GFP.
Figure 4
Figure 4
WASP Forms a Nano-Template for Actin Nucleation at the Membrane Base (A) Dual-color superresolution images of Las17-mMaple and Myo5-SNAP at individual endocytic sites, and average. (B) Radial profiles of N-terminally and C-terminally tagged Myo5. (C) Dual-color superresolution images of Las17-SNAP and Sla2-mMaple at individual endocytic sites and the average. (D) Model for force generation by the actin network. (E) Las17 is most abundant between its inhibitors. Shown are average radial profiles and images of Las17, Sla1, and Bbc1. (F) Outer radii of Las17 structures in wild-type (WT), bbc1Δ, and sla1Δ cells (mean outer radii ± SEM; WT: nno = 2,550, nlow = nmed = nhigh = 1,595; bbc1Δ: nno = 1,237; nlow = nmed = nhigh = 503; sla1Δ: nno = 131; nlow = nmed = nhigh = 28). p < 0.05, ∗∗p < 0.01, ∗∗∗p < 0.001 from Wilcoxon rank-sum test of WT versus sla1Δ (red) and WT versus bbc1Δ (green) at each GFP intensity. (G) Individual Las17 sites in WT, bbc1Δ, and sla1Δ cells for different Abp1-GFP intensities. Scale bars represent 100 nm. See Figure S6 for example images and radial profiles of Las17 sla1Δ cells and Table S2 for data.
Figure S6
Figure S6
Las17 Structures in sla1Δ Cells, Related to Figure 4 (A and B) SLA1 deletion leads to strong changes in Las17 structures. Shown are example sla1Δ cells expressing Las17-mMaple and Abp1-GFP. We note that the large majority of cells showed Las17 in large cluster-like structures (A), while a small subset contained Las17 structures that were similar in size to wild-type (B). (C) Shows radial profiles of Las17 in sla1Δ cells for different Abp1-GFP intensities (compare Figures 3J–3L). (D) Shows radial profile of Las17 in sla2Δ cells. Scale bars 1 μm or 100 nm (zoomed regions).
Figure 5
Figure 5
The Actin Network Emanates from the WASP Nucleation Zone (A and B) Abp1 in superresolution overlaid with diffraction-limited Rvs167-GFP as timing marker for vesicle scission at individual sites (A) and in a cell overview (B). (C) Outer radius of Abp1 for no, low, medium, and high Rvs167-GFP intensities (mean ± SEM; nno = 1,044; nlow = nmed = nhigh = 568; data in Table S2). (D) Average images of Abp1 for each time window. At medium and high Rvs167-GFP, a pronounced minimum in the center indicates the membrane invagination. See Figure S5 for radial profiles. (E) Schematic of the side-view perspective used in (F) and (G). (F) Dual-color side-view superresolution images of Las17-SNAP and Abp1-mMaple at individual sites. Images were rotated so endocytosis occurs upward, and sorted by the distance of Abp1 centroid to Las17 at the base. (G) Running-window averages of Las17 and Abp1 at endocytic sites. For comparison, average outer boundaries of the actin network (dotted lines), and average plasma membrane profiles (solid line) obtained by CLEM (Kukulski et al., 2012) are overlaid for each time point, as inferred from the images. ∗∗∗p < 0.001 from Wilcoxon rank-sum test. Scales bars represent 100 nm (A, D, and F) and 1 μm (B). See also Figure S5 and Table S2.
Figure S7
Figure S7
Potential Organization of Actin Filaments, Related to Figure 6 (A) Illustration of a thin slice through an endocytic actin network. (B and C) The experimental radial profiles (B) and mean outer radii ± SEM of Cap1, Arc18 and Sac6 (C). These are indicating that barbed ends (Cap1) protrude further outward than pointed ends (Arc18). Crosslinker (Sac6) had an intermediate size, consistent with a cross-linking function between the middles of the filaments (Skau et al., 2011). (D and E) This organization is recapitulated in the raw (D) and filtered (E) average profiles from Cytosim simulations. Profiles in (E) were calculated from (D) by blurring the raw coordinates from the simulations by 15 nm to simulate the localization precision of superresolution imaging. (F) Comparison how many actin filaments are needed to reach a certain invagination depth in symmetric and asymmetric nucleation. ∗∗∗p < 0.001 from Wilcoxon rank-sum test.
Figure 6
Figure 6
Simulations of the Actin Network at Endocytic Sites Using Cytosim (A and B) Initial configuration of the simulation (A) and overview of simulated elements (B). (C) Time series of a representative simulated endocytic event, with a snap-through transition at ∼9 s. (D) Detail of an endocytic event where nucleation occurred all around the invagination. 5,022 actin monomers were required to reach the snap-through transition. Lateral distance between actin center of mass and invagination is 7 nm. See also Video S1. (E) Detail of an endocytic event where actin nucleation occurred asymmetrically with respect to the invagination, shown at the same depth as (D). More time and actin (7,824 monomers) were required to reach the snap-through transition. Actin is not symmetrically organized, with a lateral distance of 32 nm between actin center of mass and invagination. (F) Fraction of successful simulations that overcome the snap-through transition over time, for symmetric (blue) and asymmetric nucleation (red). N is number of simulations. Thin lines correspond to different distances between tether and center of actin nucleation (bin width, 10 nm) at the starting time of invagination. (G) Median invagination depth over time for symmetric (blue) and asymmetric nucleation (red). Color-filled areas represent the spread from the first to third quartile. Thin lines show median invagination depths over time within the same bins as (F). Scale bars represent 50 nm. See also Figure S7 and Videos S2 and S3.
Figure 7
Figure 7
The Endocytic Machinery Assembles via Peripheral Binding (A) Schematic representation of the assembly of the endocytic machinery (for description, see text). (B) Representative radial averages of endocytic proteins at key time points during assembly. Shown are Ede1 (early), Clathrin (Clc1, early coat), Pan1 (late coat), Las17 (WASP), Myo5 (Myosin-1), Arc18 (Arp2/3 complex bound to pointed ends), Cap1 (barbed ends), and Rvs167 (Scission). Scale bar represents 100 nm.

References

    1. Aghamohammadzadeh S., Ayscough K.R. Differential requirements for actin during yeast and mammalian endocytosis. Nat. Cell Biol. 2009;11:1039–1042. - PMC - PubMed
    1. Arasada R., Sayyad W.A., Berro J., Pollard T.D. High-speed superresolution imaging of the proteins in fission yeast clathrin-mediated endocytic actin patches. Mol. Biol. Cell. 2018;29:295–303. - PMC - PubMed
    1. Ayscough K.R., Eby J.J., Lila T., Dewar H., Kozminski K.G., Drubin D.G. Sla1p is a functionally modular component of the yeast cortical actin cytoskeleton required for correct localization of both Rho1p-GTPase and Sla2p, a protein with talin homology. Mol. Biol. Cell. 1999;10:1061–1075. - PMC - PubMed
    1. Basu R., Munteanu E.L., Chang F. Role of turgor pressure in endocytosis in fission yeast. Mol. Biol. Cell. 2014;25:679–687. - PMC - PubMed
    1. Batchelder E.M., Yarar D. Differential requirements for clathrin-dependent endocytosis at sites of cell-substrate adhesion. Mol. Biol. Cell. 2010;21:3070–3079. - PMC - PubMed

Publication types

MeSH terms

Substances

LinkOut - more resources