. 2018 Aug 13;34(2):286-297.e10.
doi: 10.1016/j.ccell.2018.06.014. Epub 2018 Jul 26.

Targeting the HTLV-I-Regulated BATF3/IRF4 Transcriptional Network in Adult T Cell Leukemia/Lymphoma

Affiliations

Targeting the HTLV-I-Regulated BATF3/IRF4 Transcriptional Network in Adult T Cell Leukemia/Lymphoma

Masao Nakagawa et al. Cancer Cell. .

Abstract

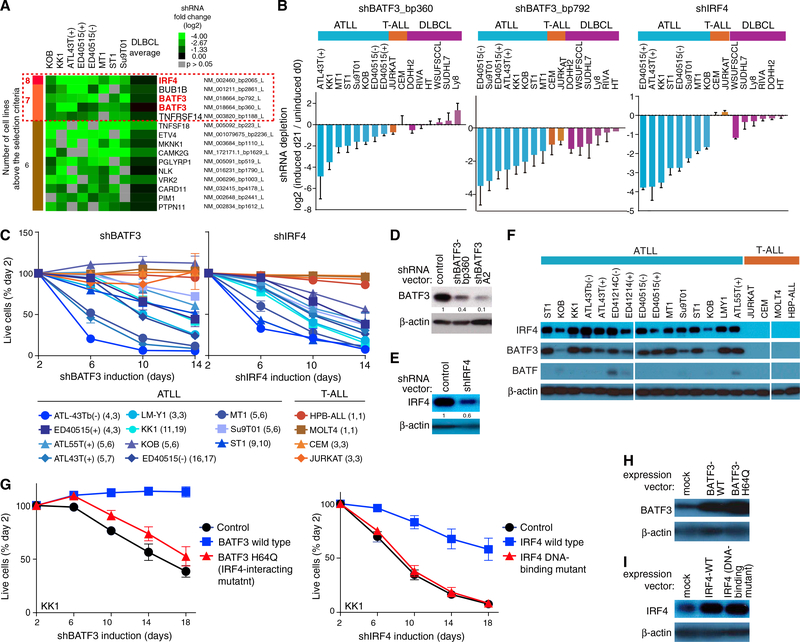
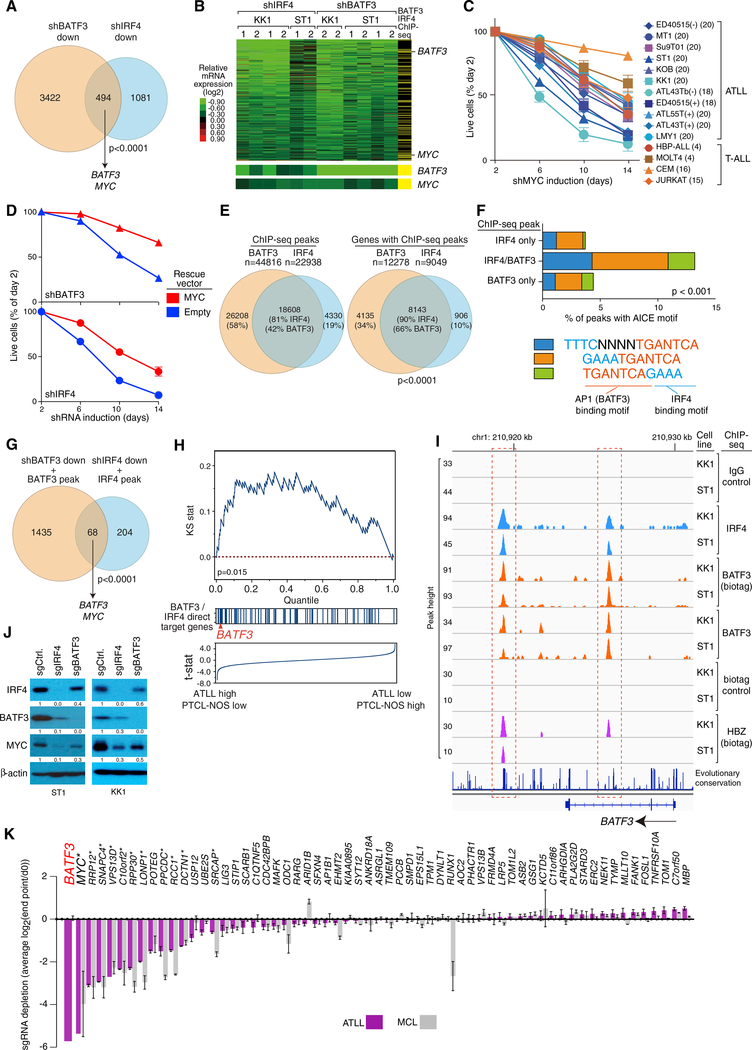
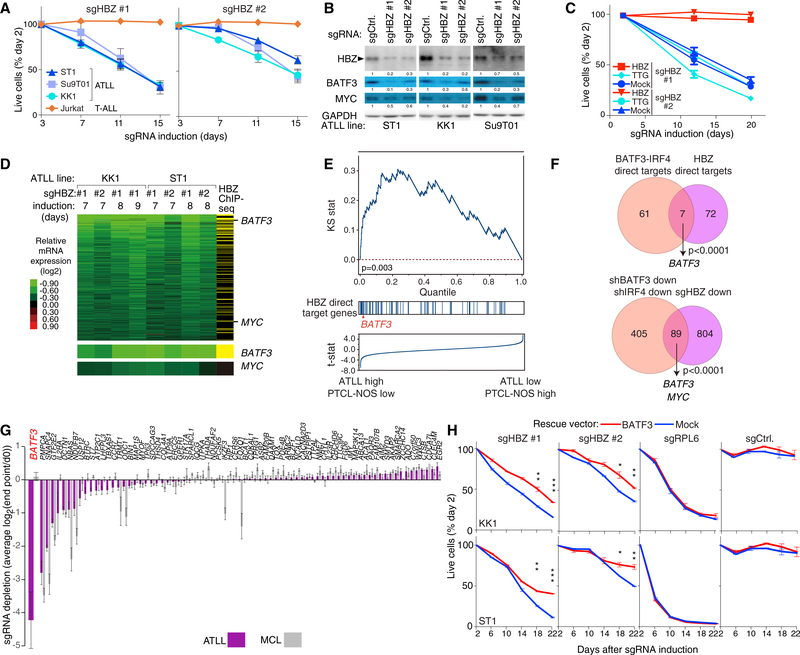
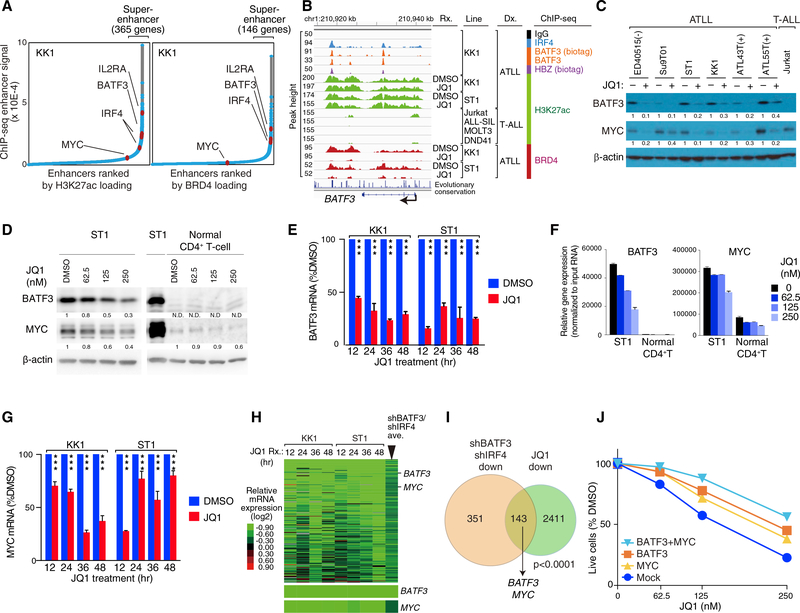
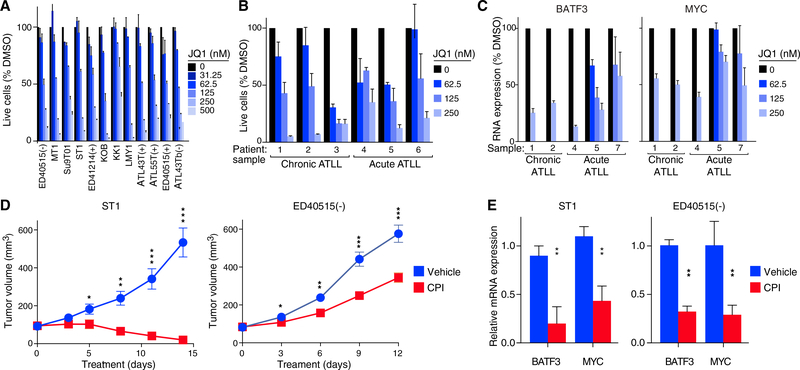
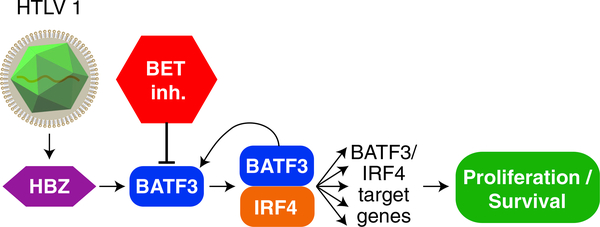
Adult T cell leukemia/lymphoma (ATLL) is a frequently incurable disease associated with the human lymphotropic virus type I (HTLV-I). RNAi screening of ATLL lines revealed that their proliferation depends on BATF3 and IRF4, which cooperatively drive ATLL-specific gene expression. HBZ, the only HTLV-I encoded transcription factor that is expressed in all ATLL cases, binds to an ATLL-specific BATF3 super-enhancer and thereby regulates the expression of BATF3 and its downstream targets, including MYC. Inhibitors of bromodomain-and-extra-terminal-domain (BET) chromatin proteins collapsed the transcriptional network directed by HBZ and BATF3, and were consequently toxic for ATLL cell lines, patient samples, and xenografts. Our study demonstrates that the HTLV-I oncogenic retrovirus exploits a regulatory module that can be attacked therapeutically with BET inhibitors.

Keywords: ATLL; BATF3; BET inhibitor; HBZ; functional genomics.


Conflict of interest statement

DECLARATION OF INTERESTS

The authors declare no competing interests.

Figures

Figure 1.
Figure 1.. BATF3 and IRF4 Are Essential Transcription Factors in ATLL
(A) Summary figure for shRNA library screening. The shRNAs showing toxicity for ATLL cell lines are listed. The red dashed box indicates the genes above the selection criteria. See STAR Methods for the selection criteria. (B) Shown are data from shRNA library screening of the indicated cell lines, in which the relative abundance of shBATF3_bp360 (left panel), shBATF3_bp792 (middle panel), and shIRF4 (right panel) is compared at day 0 and day 21 of culture. Error bars represent SEM of quadruplicates. (C) The indicated cell lines were infected with a retrovirus that expresses shBATF3_A2 or shIRF4 together with GFP. Shown is the fraction of GFP-positive cells over time relative to the GFP-positive fraction on day 2. Error bars represent the SEM of replicates. In parentheses is the number of replicates for shBATF3 followed by number of replicates of shIRF4. (D) Immunoblot analysis of BATF3 protein in shBATF3_bp360 or shBATF3_A2-transduced KK1. Quantification of BATF3 immunoblot bands, normalized to β-actin and compared with control is shown. (E) Immunoblot analysis of IRF4 protein in shIRF4-transduced KK1. Quantification of IRF4 immunoblot bands, normalized to β-actin and compared with control is shown. (F) Immunoblot analysis of BATF3, BATF and IRF4 in the ATLL and T-ALL cell lines. (G) Wild-type or Q63K BATF3 (left) or wild-type or a DNA-binding mutant IRF4 (right) were retrovirally expressed in KK1 ATLL cells. After puromycin selection of transduced cells, cells were transduced with shBATF3_A2 (left) or shIRF4 (right) and monitored as in (C). Error bars represent the SEM of duplicates. (H and I) Immunoblot analysis of BATF3 (H) and IRF4 (I) proteins in KK1 ATLL cells that were transduced with the indicated expression vectors.

See also Figure S1 and Table S1.
Figure 2.
Figure 2.. Genome-wide Landscape of BATF3/IRF4 Binding
(A) Venn diagram showing the overlap between genes downregulated by shBATF3 (A2 and bp360) or by shIRF4 in KK1 and ST1 ATLL cell lines. Included are genes with a log2 fold change in mRNA expression of less than −0.3 in more than 3 of 6 shRNA-induced KK1 and ST1 ATLL cell lines. (B) Heatmap of relative mRNA levels of the 494 genes downregulated by both shBATF3 and shIRF4 in (A), according to the color scale shown. Yellow bars in the far right column indicate genes with ChIP-seq peaks for BATF3 (biotag) and IRF4 within a promoter/gene body window, defined as −15 kb upstream of the transcription start site to +2 kb downstream of the gene body. Log2 fold changes of BATF3 and MYC mRNA expression are shown at the bottom. (C) MYC addiction in ATLL cell lines. Toxicity assay was done as in Figure 1C. Error bars represent the SEM of replicates. The number of replicates are shown in parentheses. (D) KK1 cells were transduced with MYC cDNA-expressing vector, and subsequently with vectors co-expressing GFP and either shBATF3_A2 or shIRF4. The GFP-positive cell fraction was monitored as in Figure 1C. Error bars represent the SEM of replicates. (E) Venn diagrams show overlap of biotag BATF3 ChIP-seq and IRF4 ChIP-seq data with respect to ChIP-seq peaks (left) or genes (right), within a promoter/gene body window (see B). (F) AICE motif identified within ChIP-seq peaks bound by biotagBATF3, IRF4, or both in KK1 cells and plotted as the fraction of all peaks. (G) Venn diagram showing the overlap between direct target genes of BATF3 and IRF4 in KK1 and ST1 ATLL cell lines. (H) Gene set enrichment analysis of BATF3/IRF4 direct target genes in mRNA expression data from primary T cell lymphoma biopsies. Genes were ranked according to the T statistic shown for their relative mRNA expression in ATLL and PTCL-NOS samples. The distribution of direct target genes of BATF3 and IRF4, as defined in the intersection in (G), is shown. (I) ChIP-seq tracks from KK1 and ST1 cells at the BATF3 locus for IRF4, biotagBATF3, endogenous BATF3, and HBZ. Red dashed boxes indicate regions of IRF4, BATF3 and HBZ binding. Genomic coordinates are based on the NCBI36/hg18 assembly. (J) Immunoblot analysis of the indicated proteins 6 days after induction of sgRNAs targeting BATF3 and IRF4 in Cas9-expressing ST1 or KK1 cells. Quantification of IRF4, BATF3, and MYC immunoblot bands, normalized to β-actin and compared with shCtrl, is shown. (K) CRISPR/Cas9 screening for essential BATF3/IRF4 direct target genes in ATLL cell lines. BATF3/IRF4 direct target genes were ranked based on their essentiality, which was quantified as the average log2 fold change in abundance of all sgRNAs corresponding to the indicated genes from day 0 to experimental endpoint (day 28 for ATLL lines; day 21 for MCL lines). Three ATLL cell lines (ST1, KK1, and Su9T01) and two MCL cell lines (Jeko and UPN1) were analyzed. Error bars represent the SEM of replicates. Asterisk indicates core fitness genes in all cell types. See also Figure S2 and Tables S2, S3, S4, and S5.
Figure 3.
Figure 3.. HBZ Drives BATF3 Expression in ATLL
(A) The indicated cell lines were infected with a retrovirus that expresses sgHBZ #1 or sgHBZ #2 together with GFP. Shown is the fraction of GFP-positive cells relative to the GFP-positive fraction on day 3. Error bars represent the SEM of replicates (at least three). (B) Immunoblot analysis of the indicated proteins after 6 days of induction of sgHBZ #1 or sgHBZ #2 in the indicated cell lines. Quantification of HBZ, BATF3 and MYC immunoblot bands, normalized to GAPDH and compared with shCtrl, is shown. (C) KK1 cells were transduced with retroviruses expressing an sgRNA-resistant HBZ isoform, with retroviruses expressing TTG-HBZ or with empty vector, and were subsequently transduced with retroviruses co-expressing GFP and either sgHBZ #1 or sgHBZ #2. The GFP-positive cell fraction was monitored as in Figure 1C. Error bars represent the SEM of quadruplicates. (D) Heatmap of relative mRNA expression levels of 894 genes that were downregulated by log2 fold change of less than −0.3 in more than 4 of 8 HBZ-knockout KK1 and ST1 ATLL cells, according to the color scale shown. Yellow bars in the far right column indicate genes with biotagHBZ-ChIP-seq peaks within a promoter region gene window (see Figure 2B legend). Log2 fold changes of BATF3 and MYC mRNA expression are shown at the bottom. (E) Gene set enrichment analysis of HBZ direct target genes in mRNA expression data from primary T cell lymphoma biopsies. Genes were ranked according to the T statistic shown for their relative mRNA expression in ATLL and PTCL-NOS samples. The distribution of HBZ direct target genes, as defined in (D), is shown. (F) Venn diagram of 68 direct target genes of BATF3 and IRF4 and 79 direct target genes of HBZ (top) or of genes that are downregulated following knockdown of BATF3 or IRF4 and those downregulated by HBZ inactivation in ATLL (bottom). (G) HBZ direct target genes were ranked based on their essentiality quantified as average log2 fold change (day 0/endpoint; day 21 in MCL lines, and day 28 in ATLL lines) of all replicates of all corresponding sgRNAs in CRISPR/Cas9-mediated screening. Three ATLL cell lines (ST1, KK1, and Su9T01) or two MCL cell lines (Jeko and UPN1) were analyzed. Error bars represent the SEM of replicates. (H) ATLL lines were transduced with retroviruses expressing BATF3, and subsequently with retroviruses co-expressing GFP and the indicated shRNAs. The GFP-positive cell fraction was monitored as in Figure 1C. Results are shown as means ±SEM (n = 2). *p < 0.05, **p < 0.01, ***p < 0.001. See also Figure S3 and Table S6.
Figure 4.
Figure 4.. BET Inhibitors Disrupt the BATF3/IRF4/HBZ Transcriptional Network in ATLL
(A) Enhancers were ranked based on increasing H3K27ac marks (left panel) and BRD4 loading (right panel) to identify the indicated number of genes with super-enhancers. (B) ChIP-seq tracks at the BATF3 locus for the indicated proteins and histone marks are shown for the indicated ATLL and T-ALL lines. Also shown is the effect of JQ1-treated KK1 (500 nM) and ST1 (250 nM) cells on H3K27ac and BRD4 ChIP-seq signals compared with the DMSO-treated control cells. (C) Immunoblot analysis of the indicated proteins following treatment of the indicated cell lines with JQ1 (500 nM). (D) Immunoblot analysis of BATF3 and MYC protein in JQ1-treated ST1 ATLL cells and normal CD4+ T cells. Quantification of BATF3 and MYC immunoblot bands, normalized to β-actin and compared with DMSO-treated control cells, is shown. N.D., not determined. (E) qRT-PCR to measure relative mRNA expression levels of BATF3 in the indicated ATLL lines treated with JQ1 (500 nM for KK1 and 250 nM for ST1) or DMSO as in (B) for the indicated times. Error bars represent the SEM of triplicates. ***P < 0.001. (F) BATF3 and MYC mRNA in JQ1-treated ST1 cells. Normal CD4+ T cell was also studied. mRNA expression levels of the indicated genes were measured and normalized by the amount of input RNA. Error bars represent the SEM of duplicates. (G) qRT-PCR to measure relative mRNA expression levels of MYC in the indicated ATLL lines treated with JQ1 (500 nM for KK1 and 250 nM for ST1) or DMSO as in (B) for the indicated times. Error bars represent the SEM of triplicates. ***P < 0.001. (H) Heatmap of mRNA expression changes (log2) after JQ1 treatment relative to DMSO-treated cells according the color scale shown. Genes were chosen that were downregulated by JQ1 and by both shBATF3 and shIRF4. Far right column indicates the average expression values of 12 shBATF3- and shIRF4-transduced ATLL lines. The relative mRNA levels of BATF3 and MYC are shown at the bottom. (I) Venn diagram of genes downregulated by both shBATF3 and shIRF4 induction and by JQ1 treatment in KK1 and ST1 ATLL lines. (J) ST1 cells were transduced with retroviral vectors expressing BATF3 along with GFP and/or MYC along with lyt2, and subsequently treated with JQ1. The GFP+/lyt2+ cell fraction was monitored as in Figure 1C. Error bars represent the SEM of duplicates, but they are short and obscured by the symbols. See also Figures S4 and S5; Table S7.
Figure 5.
Figure 5.. Toxicity of BET Protein Inhibitors for ATLL Cells In Vitro and In Vivo
(A) Viable cells measured by the MTS assay for the indicated ATLL cell lines treated with the indicated concentrations of JQ1 for 4 days. Error bars show the SEM of duplicates. (B) Viable cells were measured ([3H]thymidine incorporation assay) following JQ1 treatment at the indicated concentrations for 6 days (chronic subtype of ATLL) or for 3 days (acute subtype of ATLL). Error bars represent the SEM of triplicates. (C) BATF3 and MYC mRNA expression quantified by qRT-PCR, normalized to HPRT1 mRNA expression, in primary ATLL cells treated with JQ1 for 24 hr at the indicated concentrations. Error bars represent the SEM of triplicates. (D) ST1 and ED405151(−) ATLL cells were established as subcutaneous tumors (average 93 mm3 and 83 mm3) in immunodeficient mice, which were then treated daily for 14 days and 12 days, respectively, with CPI-203 (5 mg/kg/injection, twice a day) or vehicle control by intraperitoneal injection. Tumor growth was monitored as a function of tumor volume. Error bars show the SEM of 6 mice (ST1) and 7 mice (ED40515(−)) per group. (E) BATF3 and MYC mRNA expression quantified by qRT-PCR, normalized to HPRT1 expression, in ST1 and ED40515(−) ATLL xenograft tumors harvested after daily treatment for 4 days (ST1) and 9 days (ED40515(−)) with CPI-203 (5 mg/kg/injection, twice a day) or with vehicle control by intraperitoneal injection. Error bars represent the SEM of triplicates. *p < 0.05, **p < 0.01, ***p < 0.001. See also Figure S5.
Figure 6.
Figure 6.
Schematic of the Malignant HBZ/BATF3/IRF4 Transcriptional Network in ATLL

References

    1. Arnold J, Zimmerman B, Li M, Lairmore MD, and Green PL (2008). Human T-cell leukemia virus type-1 antisense-encoded gene, Hbz, promotes T-lymphocyte proliferation. Blood 112, 3788–3797. - PMC - PubMed
    1. Bohers E, Mareschal S, Bouzelfen A, Marchand V, Ruminy P, Maingonnat C, Menard AL, Etancelin P, Bertrand P, Dubois S, et al. (2014). Targetable activating mutations are very frequent in GCB and ABC diffuse large B-cell lymphoma. Genes Chromosomes Cancer 53, 144–153. - PubMed
    1. Ceribelli M, Hou ZE, Kelly PN, Huang DW, Wright G, Ganapathi K, Evbuomwan MO, Pittaluga S, Shaffer AL, Marcucci G, et al. (2016). A druggable TCF4- and BRD4-dependent transcriptional network sustains malignancy in blastic plasmacytoid dendritic cell neoplasm. Cancer Cell 30, 764–778. - PMC - PubMed
    1. Ceribelli M, Kelly PN, Shaffer AL, Wright GW, Xiao W, Yang Y, Mathews Griner LA, Guha R, Shinn P, Keller JM, et al. (2014). Blockade of oncogenic IkappaB kinase activity in diffuse large B-cell lymphoma by bromodomain and extraterminal domain protein inhibitors. Proc. Natl. Acad. Sci. USA 111, 11365–11370. - PMC - PubMed
    1. Chen J, Petrus M, Bryant BR, Phuc Nguyen V, Stamer M, Goldman CK, Bamford R, Morris JC, Janik JE, and Waldmann TA (2008). Induction of the IL-9 gene by HTLV-I Tax stimulates the spontaneous proliferation of primary adult T-cell leukemia cells by a paracrine mechanism. Blood 111, 5163–5172. - PMC - PubMed

Publication types

MeSH terms

Substances