. 2018 Aug 6;28(15):2445-2451.e3.
doi: 10.1016/j.cub.2018.06.016. Epub 2018 Jul 26.

Forebrain Control of Behaviorally Driven Social Orienting in Zebrafish

Affiliations

Forebrain Control of Behaviorally Driven Social Orienting in Zebrafish

Sarah J Stednitz et al. Curr Biol. .

Abstract

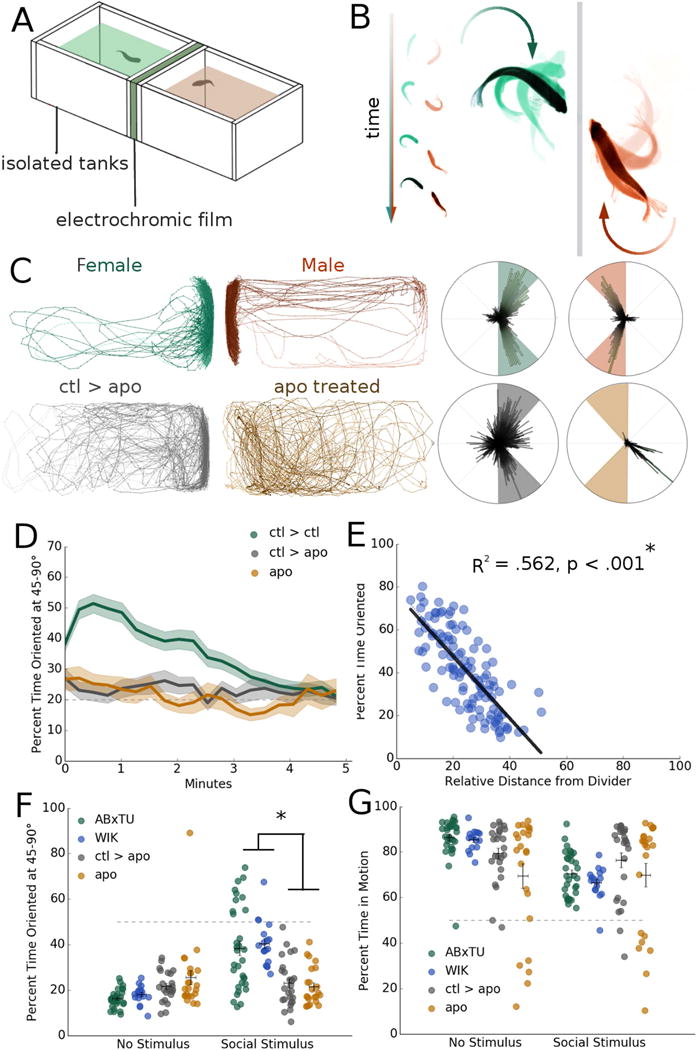
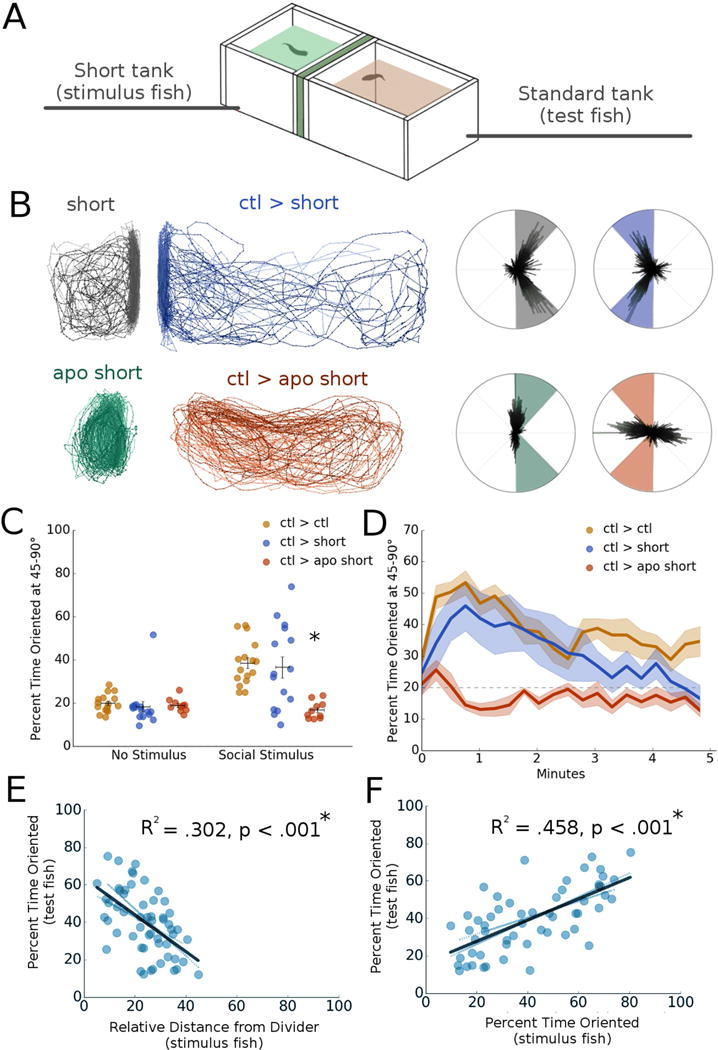
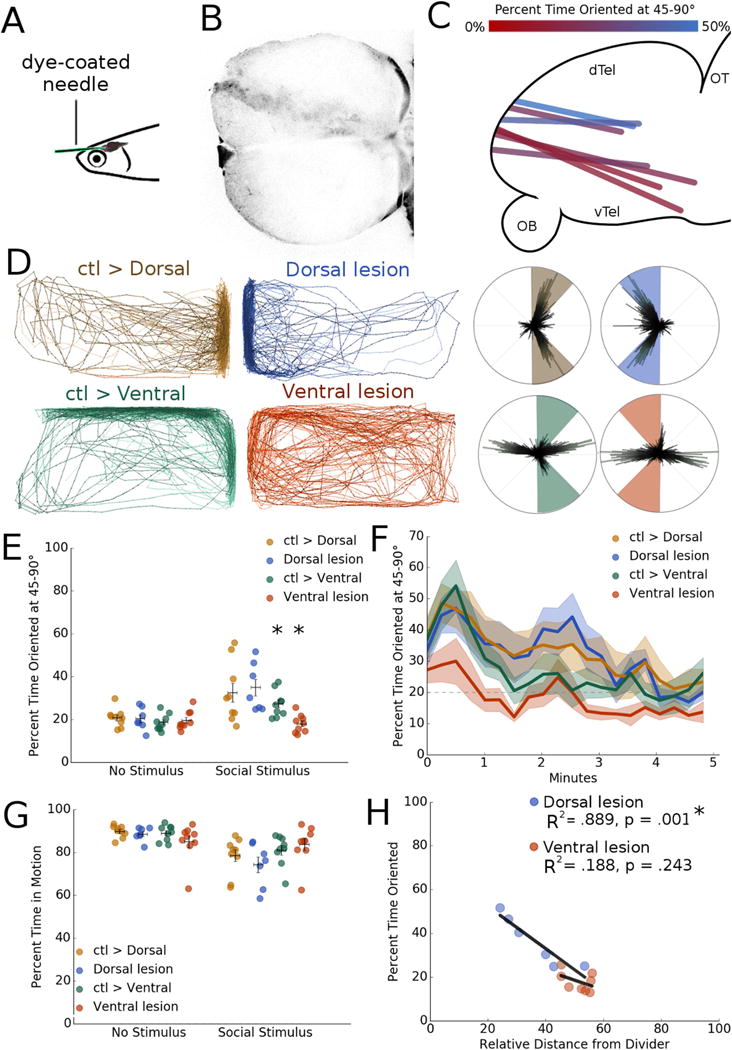
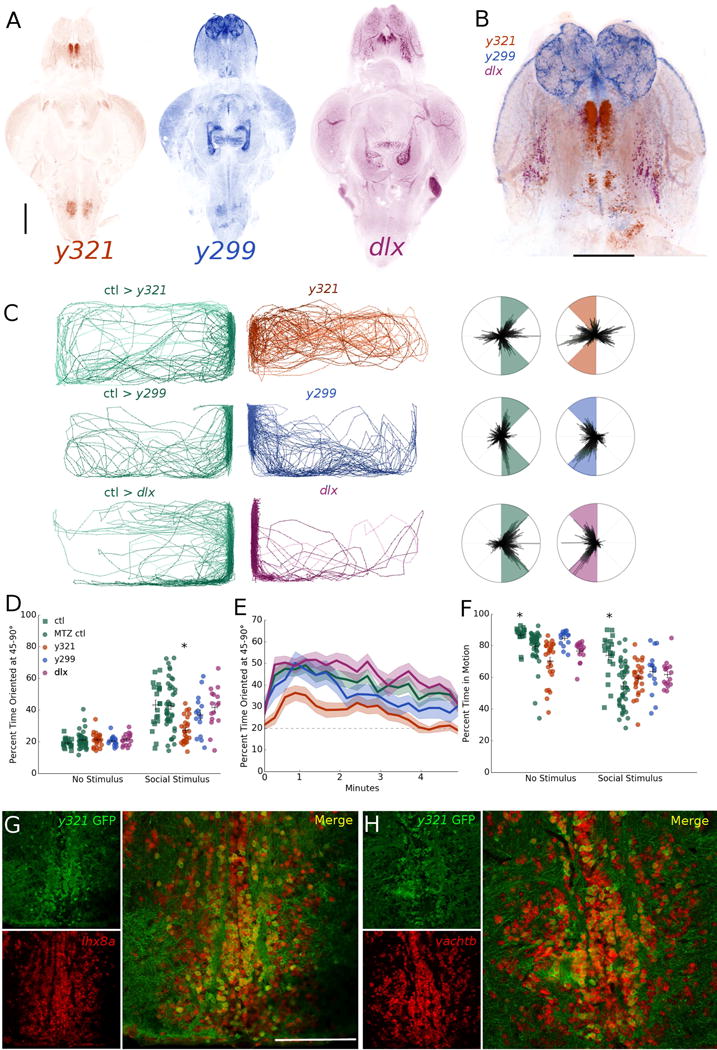
Deficits in social engagement are diagnostic of multiple neurodevelopmental disorders, including autism and schizophrenia [1]. Genetically tractable animal models like zebrafish (Danio rerio) could provide valuable insight into developmental factors underlying these social impairments, but this approach is predicated on the ability to accurately and reliably quantify subtle behavioral changes. Similarly, characterizing local molecular and morphological phenotypes requires knowledge of the neuroanatomical correlates of social behavior. We leveraged behavioral and genetic tools in zebrafish to both refine our understanding of social behavior and identify brain regions important for driving it. We characterized visual social interactions between pairs of adult zebrafish and discovered that they perform a stereotyped orienting behavior that reflects social attention [2]. Furthermore, in pairs of fish, the orienting behavior of one individual is the primary factor driving the same behavior in the other individual. We used manual and genetic lesions to investigate the forebrain contribution to this behavior and identified a population of neurons in the ventral telencephalon whose ablation suppresses social interactions, while sparing other locomotor and visual behaviors. These neurons are cholinergic and express the gene encoding the transcription factor Lhx8a, which is required for development of cholinergic neurons in the mouse forebrain [3]. The neuronal population identified in zebrafish lies in a region homologous to mammalian forebrain regions implicated in social behavior such as the lateral septum [4]. Our data suggest that an evolutionarily conserved population of neurons controls social orienting in zebrafish.

Keywords: basal telencephalon; collective behavior; lateral septum; reciprocal.


Conflict of interest statement

DECLARATION OF INTERESTS

The authors declare no competing interests.

Figures

Fig 1
Fig 1. Automated analysis of social orienting in wild-type and drug-treated zebrafish
A. Schematic of dyad assay apparatus, consisting of two isolated 7″ (length) × 3.5″ (width) × 2.5″ (depth) tanks separated by a panel of electrochromic film. B. Orienting behavior in a pair of isolated zebrafish. C. Representative traces and polar histograms for a male and female ABxTU dyad and a control (ABxTU) animal (ctl>apo) paired with an impaired apomorphine-treated zebrafish (apo treated; apo). ABxTU animals paired with one another significantly increase their orienting behavior when exposed to another fish (*p < .001, n = 112) but not when paired with an apomorphine-treated fish that serves as a suboptimal social stimulus (p = .516, n =23). D. Percent time oriented over 5 minute period for zebrafish paired with a normal social stimulus (ctl > ctl), zebrafish paired with a suboptimal stimulus (ctl > apo), and zebrafish treated with apomorphine (apo). E. Correlation between test fish’s orienting behavior and relative distance from the divider. Relative distance is expressed in terms of minimum to maximum distance, 0-100%. Orienting behavior is significantly correlated with distance from the divider. R2 = .562, *p < .001, n = 112 linear regression. F. Average percent time oriented at 45-90° for male and female ABxTU, male and female WIK pairs, ctl>apo and apo zebrafish before and after presentation of a social stimulus. *p < .05, repeated measures mixed model ANOVA with post-hoc simple effects tests. Horizontal bars: mean, vertical bars: +/− s.e.m. G. Percent time in motion for all groups before and during social stimulus presentation. Horizontal bars: mean, vertical bars: +/− s.e.m. See also Figure S1 and Video S1.
Fig 2
Fig 2. Behavioral feedback drives social orienting within a zebrafish dyad
A. Schematic of short tank dyad assay apparatus, where the stimulus fish’s tank is truncated to half size to restrict movement away from the divider. B. Representative traces and polar histograms of control fish (ctl > short) and fish exposed to a sub-optimal social stimulus (ctl > apo short). Test fish exposed to a sub-optimal stimulus had significantly suppressed orienting behavior relative to controls (*p = .009, n = 26). C. Average percent time oriented at 45-90° for shor t tank experiments before (no stimulus) and after (social stimulus) social stimulus presentation. *p < .05, repeated measures mixed model ANOVA with post-hoc simple effects tests. Horizontal bars: mean, vertical bars: +/− s.e.m. D. Percent time oriented over 5 minute period for short tank experiments. E. Correlation plot between the test fish’s percent time oriented and the stimulus fish’s relative distance from the divider (R2 = .302, *p < .001, n = 112). *p < .05, linear regression. F. Correlation plot between the test fish’s percent time oriented and the stimulus fish’s percent time oriented (R2 = .458, p < .001, n = 112) *p < .05, linear regression. See also Figure S2.
Fig 3
Fig 3. Ventral telencephalic lesions disrupt social orienting
A. Schematic of lesion technique, where a dye-coated needle is inserted into the nostril of an anesthetized zebrafish to injure the forebrain. B. Representative image of lesion track through forebrain (dorsal view). C. Lesion tracks localized from a subset of zebrafish, color-coded to indicate severity of social deficit by location (sagittal view). D. Representative traces of lesioned zebrafish and control stimulus fish. Dorsally lesioned zebrafish exhibit no social impairments relative to controls (p = .974, n = 9), however ventral injuries result in a severe reduction in both distance from the divider and orienting behavior (*p = .007, n =7). E. Average percent time oriented at 45-90° for lesi on experiments before (no stimulus) and after (social stimulus) social stimulus presentation. *p < .05, repeated measures mixed model ANOVA with post-hoc simple effects tests. Horizontal bars: mean, vertical bars: +/− s.e.m. F. Percent time oriented over 5 minute period for lesion experiments. G. Percent time in motion for all lesion groups before and after social stimulus presentation. Horizontal bars: mean, vertical bars: +/− s.e.m. H. Correlation between orienting behavior and relative distance from divider in dorsally and ventrally lesioned zebrafish. Dorsally lesioned fish retain a significant correlation between orienting and distance from the divider (R2 = .889, *p < .001), but ventrally lesioned fish lose this relationship and more closely resemble the no stimulus period (R2 = .188, p = .243). *p < .05, linear regression.
Fig 4
Fig 4. Chemo-genetic ablation of cholinergic neurons in the ventral telencephalon disrupts social orienting
A. Whole-brain z projections of transgenic expression in y321, y299, and dlx gal4 lines. Scale bar: 200 μm. B. Z-projection overlay of registered brains showing expression overlap and differences in the telencephalon. Scale bar: 200 μm. C. Representative traces and polar histograms of y321, y299, and dlx lines following nitroreductase ablation of transgene-expressing cell populations. D. Average percent time oriented at 45-90° for chem o-genetic ablation experiments before and after social stimulus presentation. *p < .05, repeated measures mixed model ANOVA with post-hoc simple effects tests. Horizontal bars: mean, vertical bars: +/− s.e.m. E. Percent time oriented over 5 minute period for chemo-genetic ablation experiments. F. Percent time in motion for all ablation groups before (no stimulus) and after (social stimulus) social stimulus presentation. *p < .05, repeated measures mixed model ANOVA with post-hoc simple effects tests. Horizontal bars: mean, vertical bars: +/− s.e.m. G. In situ hybridization images of y321:gal4;UAS:GFP neurons labeled for lhx8a transcripts. Scale bar: 100 μm. H. In situ hybridization images of y321:gal4;UAS:GFP neurons labeled for vachtb transcripts. See also Figure S3.

Comment in

References

    1. Fakhoury M. Autism spectrum disorders: A review of clinical features, theories, and diagnosis. Int J Dev Neurosci. 2015;43:70–7. - PubMed
    1. Abril-de-Abreu R, Cruz J, Oliveira RF. Social eavesdropping in zebrafish: Tuning of attention to social interactions. Scientific Reports. 2015;5 - PMC - PubMed
    1. Zhao Y, Marion O, Hermesz E, Powell A, Flames N, Palkovits M, Rubenstein JL, Westphal H. The LIM-homeobox gene Lhx8 is required for the development of many cholinergic neurons in the mouse forebrain. Proc Natl Acad Sci USA. 2003;100(15):9005–10. - PMC - PubMed
    1. Clarke A, File SE. Selective neurotoxin lesions of the lateral septum: changes in social and aggressive behaviors. Pharmacol Biochem Behav. 1982;17(4):623–8. - PubMed
    1. Suriyampola PS, Shelton DS, Shukla R, Roy T, Bhat A, Martins EP. Zebrafish social behavior in the wild. Zebrafish. 2016;13(1):1–8. - PubMed

Publication types

LinkOut - more resources