. 2018 Jul 3:2018:6972397.
doi: 10.1155/2018/6972397. eCollection 2018.

Expanding the miRNA Transcriptome of Human Kidney and Renal Cell Carcinoma

Affiliations

Expanding the miRNA Transcriptome of Human Kidney and Renal Cell Carcinoma

Adam P Sage et al. Int J Genomics. .

Abstract

Despite advancements in therapeutic strategies, diagnostic and prognostic molecular markers of kidney cancer remain scarce, particularly in patients who do not harbour well-defined driver mutations. Recent evidence suggests that a large proportion of the human noncoding transcriptome has escaped detection in early genomic explorations. Here, we undertake a large-scale analysis of small RNA-sequencing data from both clear cell renal cell carcinoma (ccRCC) and nonmalignant samples to generate a robust set of miRNAs that remain unannotated in kidney tissues. We find that these novel kidney miRNAs are also expressed in renal cancer cell lines. Moreover, these sequences are differentially expressed between ccRCC and matched nonmalignant tissues, implicating their involvement in ccRCC biology and potential utility as tumour-specific markers of disease. Indeed, we find some of these miRNAs to be significantly associated with patient survival. Finally, target prediction and subsequent pathway analysis reveals that miRNAs previously unannotated in kidney tissues may target genes involved in ccRCC tumourigenesis and disease biology. Taken together, our results represent a new resource for the study of kidney cancer and underscore the need to characterize the unexplored areas of the transcriptome.


Figures

Figure 1
Figure 1
Experimental analysis pipeline. Detailed diagram of the analyses used to generate predicted and validated miRNA sequences previously unannotated in kidney tissues, along with subsequent explorations into their biological relevance.
Figure 2
Figure 2
Differential expression of previously unannotated miRNAs between nonmalignant and ccRCC samples. (a) Pie chart representing the proportion of miRNAs that are significantly differentially expressed between the samples. (b) Normalized expression of the previously unannotated miRNA Knm3_1968 in individual nonmalignant (green) and ccRCC samples (purple). (c) Normalized expression of Knm22_2209 in individual nonmalignant (green) and ccRCC samples (purple). (d) Normalized expression of Knm17_1130 in individual nonmalignant (green) and ccRCC samples (purple). (e) Summary of differential expression results for each previously unannotated miRNA. BHC-p represents the corrected p value for the differential expression calculated using Student's t-test and Benjamini-Hochberg multiple correction analysis.
Figure 3
Figure 3
ccRCC patient overall survival predicted by previously unannotated miRNAs. Red lines represent patients with expression of the miRNA in the lower tertile of expression, while blue lines represent the upper tertile of expression. Calculation of p values for Knm22_2209 (a) and Knm6_2419 (b) was performed using the Gehan-Breslow-Wilcoxon test.
Figure 4
Figure 4
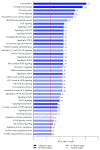
Pathways significantly enriched in protein-coding gene targets of previously unannotated miRNAs. Pathways are plotted according to the significance value associated with their enrichment in predicted miRNA gene targets. Individual genes in each pathway are predicted to be targeted by at least 10% of the previously unannotated miRNAs. Bars are coloured by the number of predicted gene targets involved in the pathway, with the total number of gene targets displayed on top of each bar. The orange dashed line represents the significance cutoff of BH-p = 0.05.

References

    1. Canadian Cancer Statistics Advisory Committee. Canadian Cancer Statistics 2018. Toronto, ON, Canada: Canadian Cancer Society; 2018.
    1. Chow W. H., Dong L. M., Devesa S. S. Epidemiology and risk factors for kidney cancer. Nature Reviews Urology. 2010;7(5):245–257. doi: 10.1038/nrurol.2010.46. - DOI - PMC - PubMed
    1. Riazalhosseini Y., Lathrop M. Precision medicine from the renal cancer genome. Nature Reviews Urology. 2016;12(11):655–666. doi: 10.1038/nrneph.2016.133. - DOI - PubMed
    1. Linehan W. M., Srinivasan R., Schmidt L. S. The genetic basis of kidney cancer: a metabolic disease. Nature Reviews Urology. 2010;7(5):277–285. doi: 10.1038/nrurol.2010.47. - DOI - PMC - PubMed
    1. The Cancer Genome Atlas Research Network. Comprehensive molecular characterization of clear cell renal cell carcinoma. Nature. 2013;499(7456):43–49. doi: 10.1038/nature12222. - DOI - PMC - PubMed

LinkOut - more resources