. 2019 Jan;81(1):234-246.
doi: 10.1002/mrm.27373. Epub 2018 Jul 29.

Dynamic off-resonance correction for spiral real-time MRI of speech

Affiliations

Dynamic off-resonance correction for spiral real-time MRI of speech

Yongwan Lim et al. Magn Reson Med. 2019 Jan.

Abstract

Purpose: To improve the depiction and tracking of vocal tract articulators in spiral real-time MRI (RT-MRI) of speech production by estimating and correcting for dynamic changes in off-resonance.

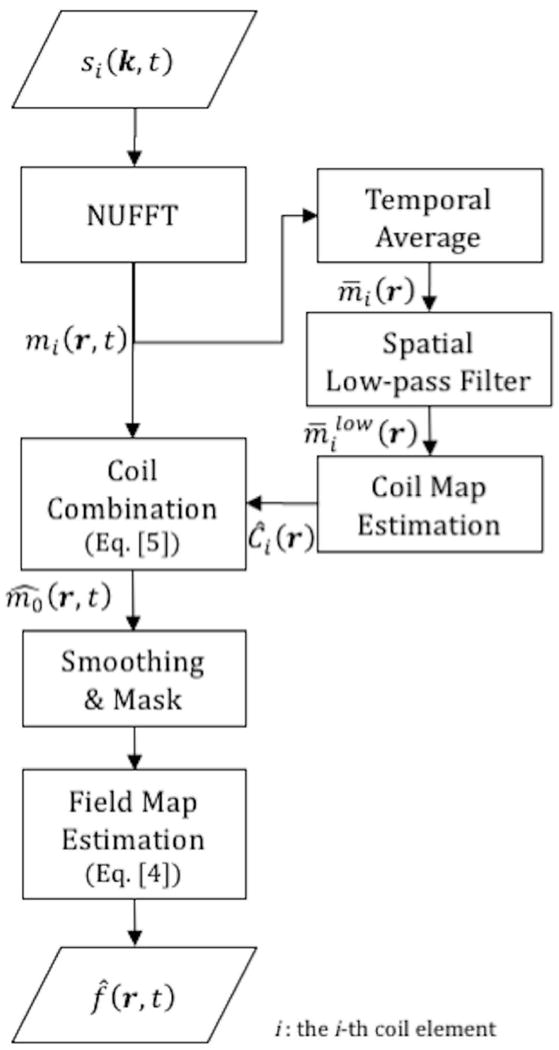
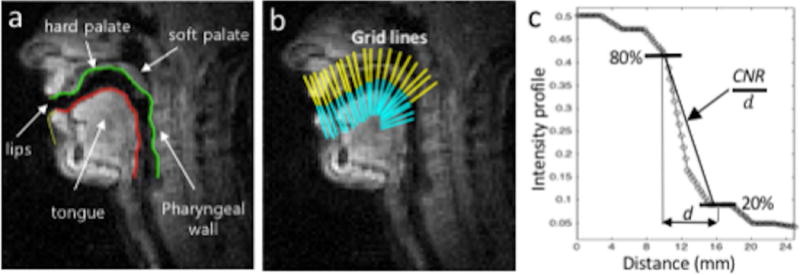
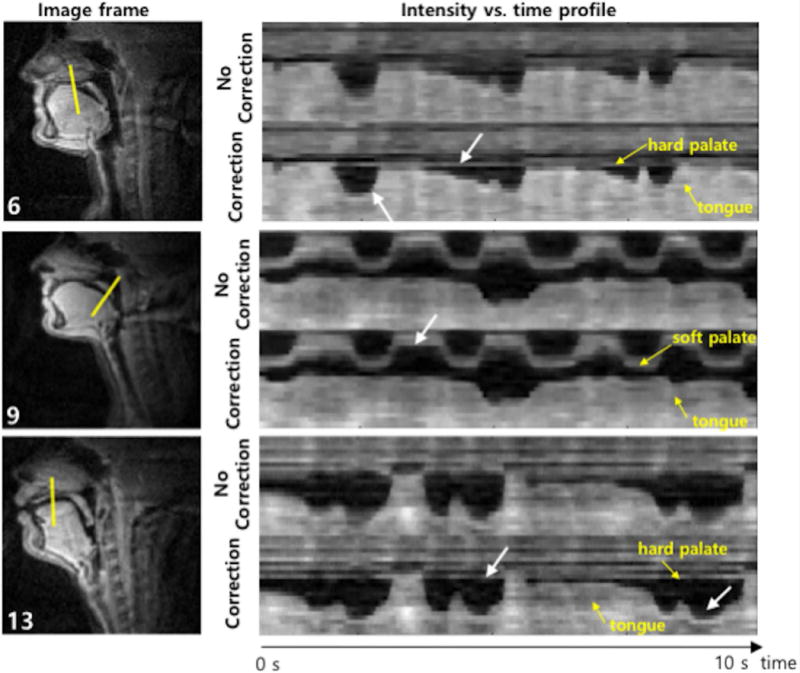
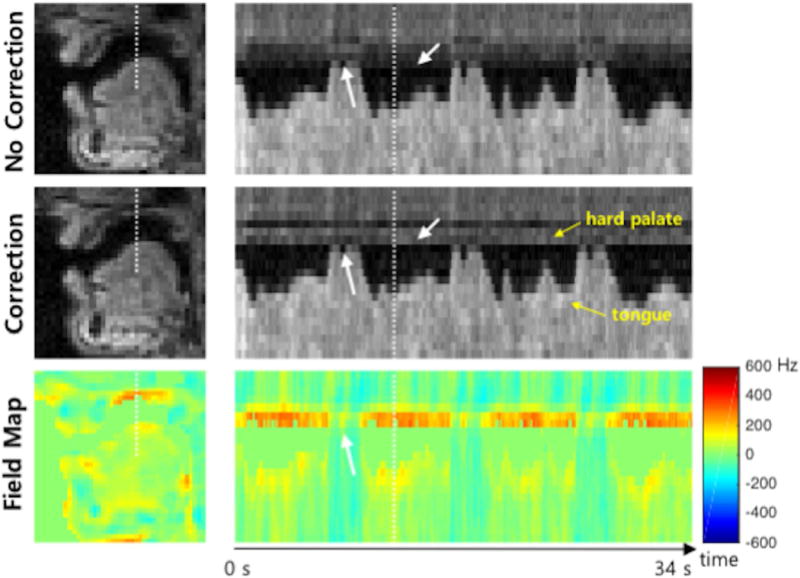
Methods: The proposed method computes a dynamic field map from the phase of single-TE dynamic images after a coil phase compensation where complex coil sensitivity maps are estimated from the single-TE dynamic scan itself. This method is tested using simulations and in vivo data. The depiction of air-tissue boundaries is evaluated quantitatively using a sharpness metric and visual inspection.

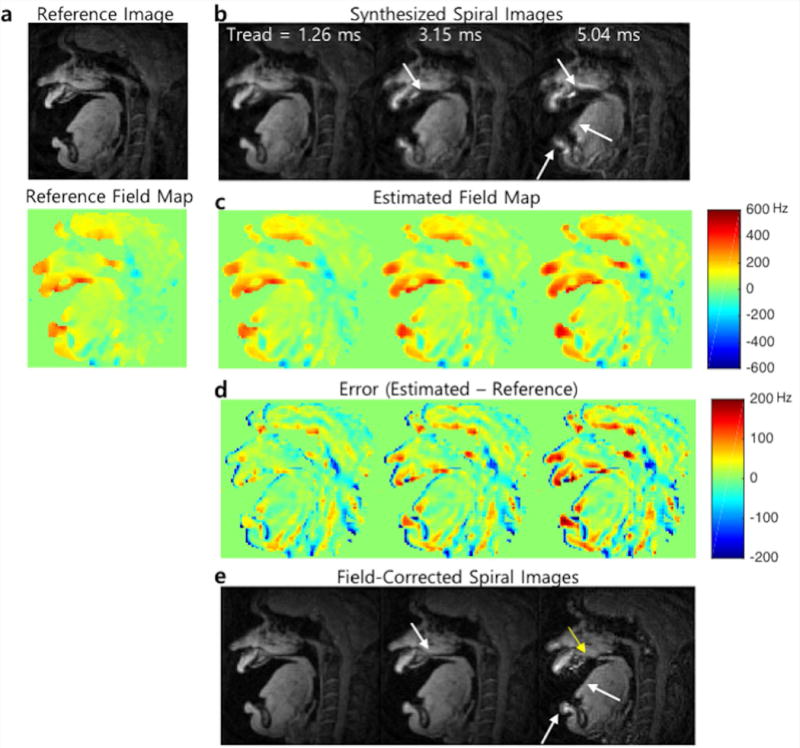
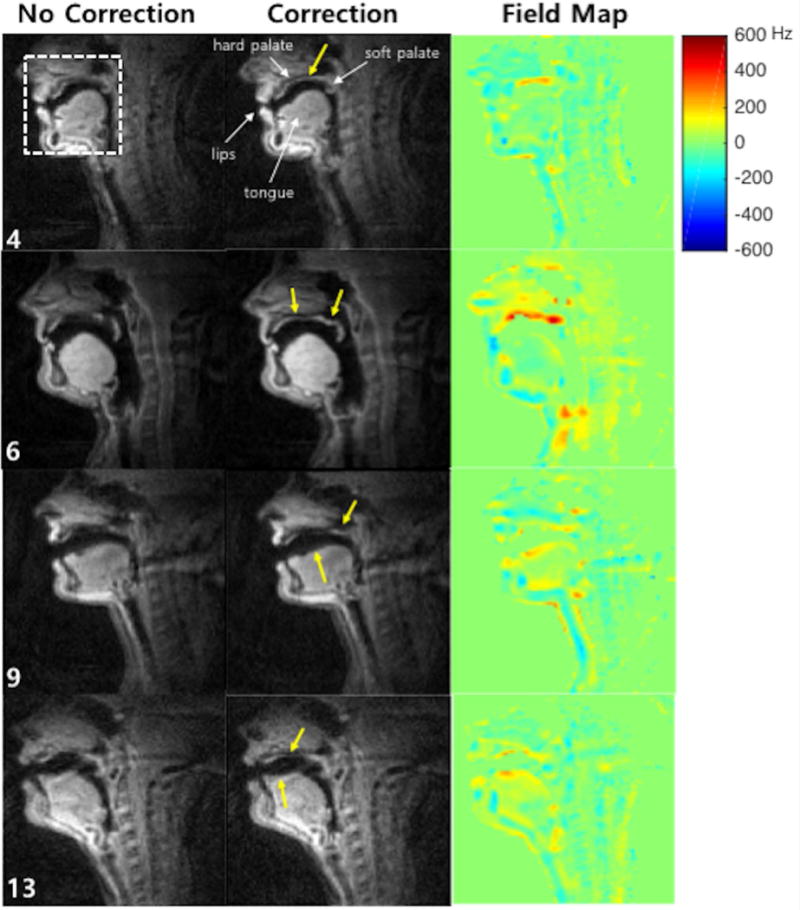
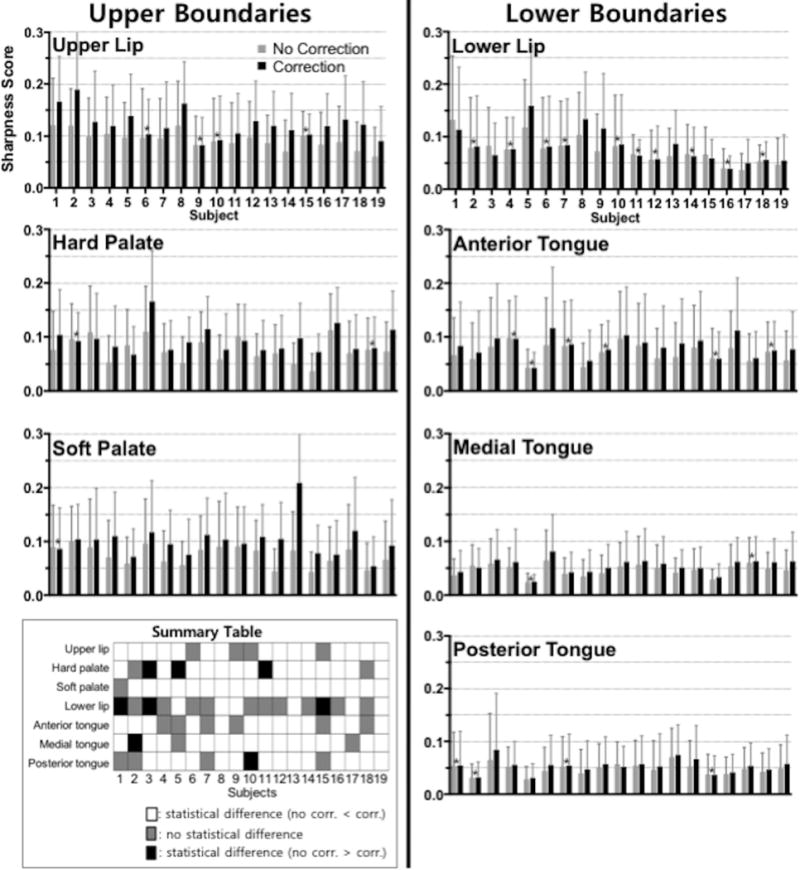
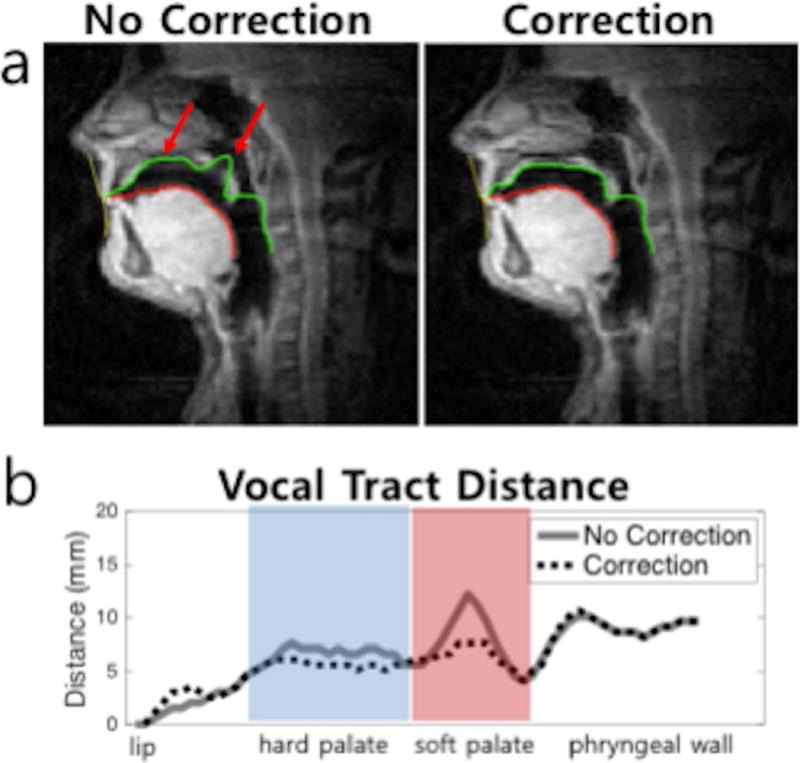
Results: Simulations demonstrate that the proposed method provides robust off-resonance correction for spiral readout durations up to 5 ms at 1.5T. In -vivo experiments during human speech production demonstrate that image sharpness is improved in a majority of data sets at air-tissue boundaries including the upper lip, hard palate, soft palate, and tongue boundaries, whereas the lower lip shows little improvement in the edge sharpness after correction.

Conclusion: Dynamic off-resonance correction is feasible from single-TE spiral RT-MRI data, and provides a practical performance improvement in articulator sharpness when applied to speech production imaging.

Keywords: off-resonance correction; real-time MRI; speech production; spiral.


Figures

Figure 1
Figure 1
Flow-chart illustrating the proposed field map estimation method. The raw image frames from individual coils are first reconstructed from the raw k-space data using view-sharing with NUFFT. The coil sensitivity maps are estimated from the multi-coil image frames after temporal average and spatial low-pass filter. The multi-coil image frames are then merged into composite image frames using the complex coil maps by Eq. [5]. The composite images are smoothed and masked and a dynamic field map is estimated from the phase of the resulting image frames by Eq. [4].
Figure 2
Figure 2
Representative simulation results. (a) A magnitude image and reference field map acquired from Cartesian dual-TE acquisition. (b) Synthesized spiral images using the magnitude image and reference field map with different readout durations (1.26, 3.15, and 5.04 ms). Off-resonance blurring is most apparent near the lips, hard palate, and tongue boundary and becomes worse with the longer readouts. (c) Field maps (Unit: Hz) estimated from phase of the spiral complex images shown in (b). (d) Estimation errors in the field map (error maps amplified by a factor of 3 for better visualization). (e) Spiral images after correction for off-resonance based on the estimated field map represented in (c).
Figure 3
Figure 3
Illustration of articulator boundary identification and sharpness score evaluation. (a) Airway boundary segmentation with the upper (superior-posterior) boundary (green, color online) and the lower (inferior-anterior) boundary (red, color online). (b) Gridlines of the upper (yellow) and lower boundaries (cyan) at several locations along the airway are chosen to obtain intensity profiles. (c) Intensity profile of the gridline is plotted where a sharpness metric is measured as a slope between the points of 80% and 20% of the maximum intensity values (CNR/d).
Figure 4
Figure 4
Representative mid-sagittal image frames of vocal tracts for four subjects, which, on visual assessment, presented the most significant blurring artifacts and were selected among the twenty subjects. The first and the second columns show images reconstructed with no correction and with correction, respectively. The last column shows the estimated field maps corresponding to those image time frames. Yellow arrows point out the regions that are most affected by off-resonance blurring, and corrected by the proposed method. (Video file is also available online as a supporting material.)
Figure 5
Figure 5
Sharpness without and with correction at different articulator boundary locations. Sharpness scores are measured at the upper boundaries (upper lip, hard palate, and soft palate) and lower boundaries (lower lip, anterior-, medial-, and posterior-tongue) along time. The mean and the standard deviation of the sharpness scores over time are shown here where the nineteen subjects are presented in descending order of average uncorrected sharpness score. A paired t-test was performed at each articulator boundary for each individual subject to test for the significance of the sharpness difference. The sharpness scores marked with an asterisk (*) were not found to be statistically different. All remaining scores were found to have significant mean differences (P < 0.001). Summary table in the bottom left panel summarizes the significance of mean sharpness score difference between no correction and correction in three different categories: (white) no correction < correction, (gray) no significant difference between no correction and correction, and (black) no correction > correction.
Figure 6
Figure 6
Illustration of improved sharpness of articulator boundaries. The first column shows an example frame for three different subjects and the second column shows intensity vs. time profiles marked by the solid lines in the first column images where each of the solid lines corresponds to one of the gridlines shown in Figure 3. For all subjects, the intensity time profiles from image sequences reconstructed with correction exhibit sharper boundary between tongue and air than that from image sequences with no correction. For Subject 9, the intensity profile from the correction provides a clear delineation of the soft palate movements. For Subjects 6 and 13, the correction method provides more constant intensity in the hard palate along time than image sequence with no correction.
Figure 7
Figure 7
Illustration of the estimated field map over time. The first column shows example frames of reconstructed images and field map corresponding to the white dot box shown in Figure 4. The second column shows intensity vs. time profiles marked by the dot lines in the first column images. In the estimated field map, high off-resonance frequency values are shown at the hard palate (400 Hz) and tongue (200 Hz) boundaries over time except when the tongue contacts the hard palate. This is because when the tongue touches the hard palate, there is neither air and susceptibility difference between them. (Video file is available online as a supporting material.)
Figure 8
Figure 8
Representative illustration of airway boundary segmentation results on images without and with correction from Subject 6. (a) Airway boundary segmentation with a same initialization was performed on images without and with correction, to extract the upper and lower boundaries (green and red contours). As indicated by red arrows, the un-corrected image shows segmentation errors at the hard palate and soft palate due to off-resonance-induced blurring. (b) Vocal tract distance, defined as the distance between the upper and lower boundaries, is plotted. Discernible errors are observed around the hard palate and soft palate in the un-corrected data.

References

    1. Lingala SG, Sutton BP, Miquel ME, Nayak KS. Recommendations for real-time speech MRI. J Magn Reson Imag. 2016;43:28–44. - PMC - PubMed
    1. Bresch E, Kim YC, Nayak KS, Byrd D, Narayanan SS. Seeing speech: Capturing vocal tract shaping using real-time magnetic resonance imaging. IEEE Signal Process Mag. 2008;25:123–129.
    1. Scott AD, Wylezinska M, Birch MJ, Miquel ME. Speech MRI: Morphology and function. Phys Med. 2014;30:604–618. - PubMed
    1. Westbury JR. The significance and measurement of head position during speech production experiments using the x-ray microbeam system. J Acoust Soc Am. 1991;89:1782–1791. - PubMed
    1. Perkell JS, Cohen MH, Svirsky MA, Matthies ML, Garabieta I, Jackson MT. Electromagnetic midsagittal articulometer systems for transducing speech articulatory movements. J Acoust Soc Am. 1992;92:3078–3096. - PubMed

Publication types