

Rheological determinants for simultaneous staging of hepatic fibrosis and inflammation in patients with chronic liver disease
- PMID: 30059174
- PMCID: PMC6141320
- DOI: 10.1002/nbm.3956
Rheological determinants for simultaneous staging of hepatic fibrosis and inflammation in patients with chronic liver disease
Abstract
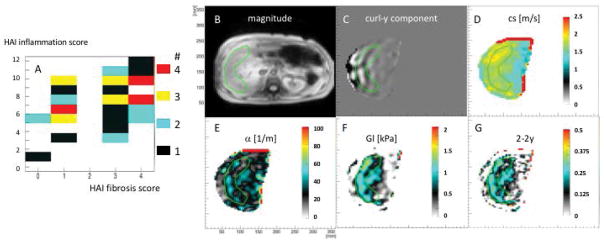
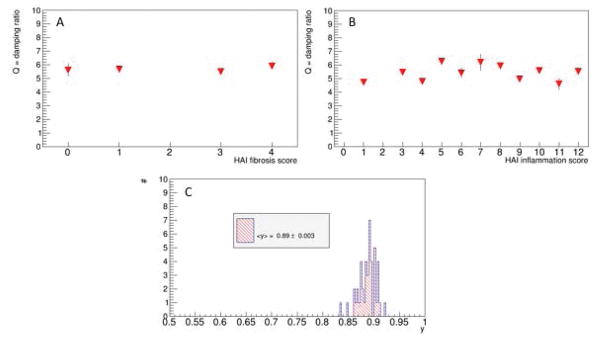
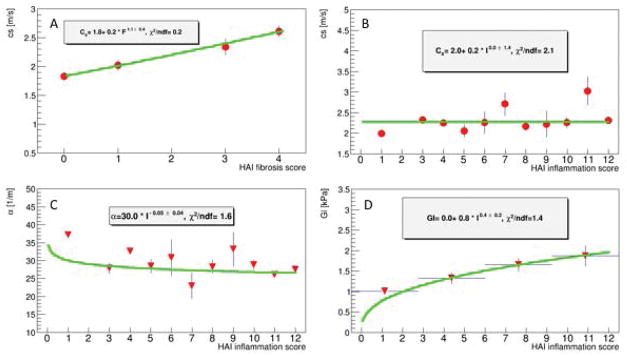
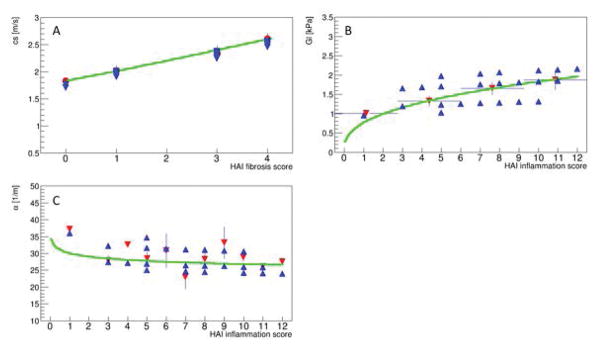
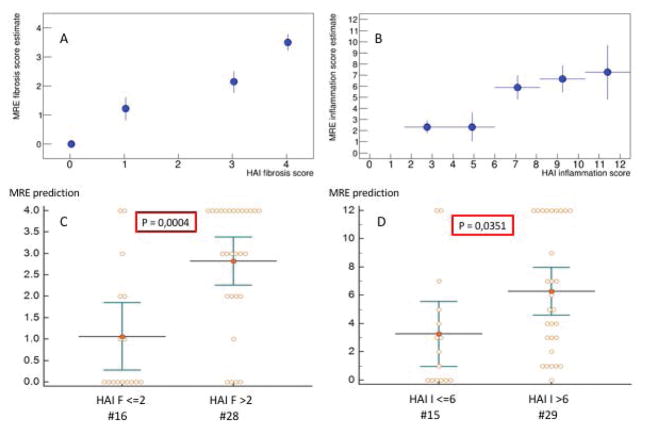
The purpose of this study is to investigate the use of fundamental rheological parameters as quantified by MR elastography (MRE) to measure liver fibrosis and inflammation simultaneously in humans. MRE was performed on 45 patients at 3 T using a vibration frequency of 56 Hz. Fibrosis and inflammation scores were obtained from liver biopsies. Biomechanical properties were quantified in terms of complex shear modulus G* as well as shear wave phase velocity c and shear wave attenuation α. A rheological fractional derivative order model was used to investigate the linear dependence of the free model parameters (dispersion slope y, intrinsic speed c0 , and intrinsic relaxation time τ) on histopathology. Leave-one-out cross-validation was then utilized to demonstrate the effectiveness of the model. The intrinsic speed c0 increases with hepatic fibrosis, while an increased relaxation time τ is reflective of more inflammation of the liver parenchyma. The dispersion slope y does not depend either on fibrosis or on inflammation. The proposed rheological model, given this specific parameterization, establishes the functional dependences of biomechanical parameters on histological fibrosis and inflammation. The leave-one-out cross-validation demonstrates that the model allows identification, from the MRE measurements, of the histology scores when grouped into low-/high-grade fibrosis and low-/high-grade inflammation with significance levels of P = 0.0004 (fibrosis) and P = 0.035 (inflammation). The functional dependences of intrinsic speed and relaxation time on fibrosis and inflammation, respectively, shed new light onto the impact hepatic pathological changes on liver tissue biomechanics in humans. The dispersion slope y appears to represent a structural parameter of liver parenchyma not impacted by the severity of fibrosis/inflammation present in this patient cohort. This specific parametrization of the well-established rheological fractional order model is valuable for the clinical assessment of both fibrosis and inflammation scores, going beyond the capability of the plain shear modulus measurement commonly used for MRE.
Keywords: MR elastography; chronic liver disease; fibrosis; hepatitis; inflammation; liver biopsy; rheological model; viscosity.
© 2018 John Wiley & Sons, Ltd.
Figures
References
-
- Hernandez-Gea V, Friedman SL. Pathogenesis of liver fibrosis. Annu Rev Pathol. 2011;6:425–456. - PubMed
-
- Cobbold JF, Patel D, Taylor-Robinson SD. Assessment of inflammation and fibrosis in non-alcoholic fatty liver disease by imaging-based techniques. Journal of gastroenterology and hepatology. 2012;27:1281–1292. - PubMed
-
- Van Beers BE, Daire J-L, Garteiser P. New imaging techniques for liver diseases. Journal of Hepatology - PubMed
-
- Huwart L, Sempoux C, Vicaut E, et al. Magnetic resonance elastography for the noninvasive staging of liver fibrosis. Gastroenterology. 2008;135:32–40. - PubMed
Publication types
MeSH terms
Grants and funding
- WT 203148/Z/16/Z/The Wellcome/EPSRC Centre for Medical Engineering/International
- Z99 DK999999/ImNIH/Intramural NIH HHS/United States
- National Institutes of Health, National Institute of Diabetes and Digestive and Kidney Diseases, Intramural Program, USA/International
- ZIA DK075083/ImNIH/Intramural NIH HHS/United States
- 668039/The European Union's Horizon 2020 research and Innovation program/International
LinkOut - more resources
Full Text Sources
Other Literature Sources
Medical
