. 2018 Jul 30;14(7):e1007541.
doi: 10.1371/journal.pgen.1007541. eCollection 2018 Jul.

DNA replication stress triggers rapid DNA replication fork breakage by Artemis and XPF

Affiliations

DNA replication stress triggers rapid DNA replication fork breakage by Artemis and XPF

Rémy Bétous et al. PLoS Genet. .

Abstract

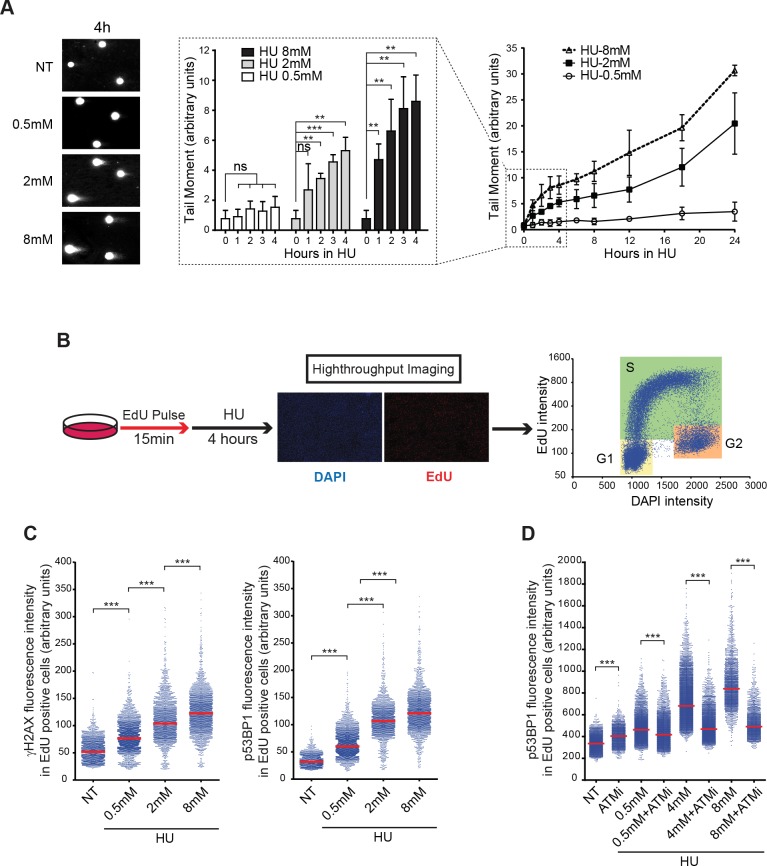
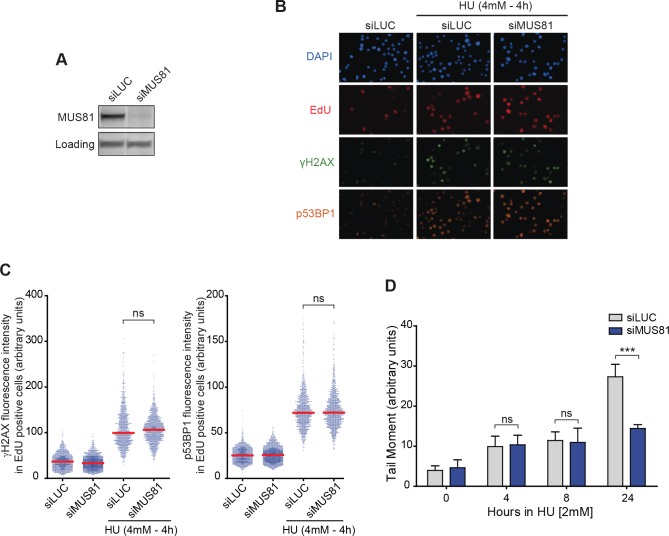
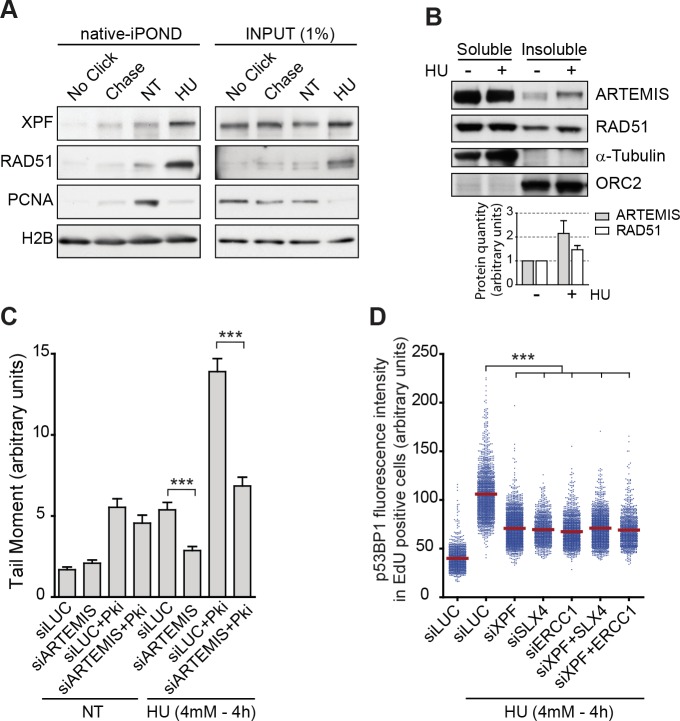
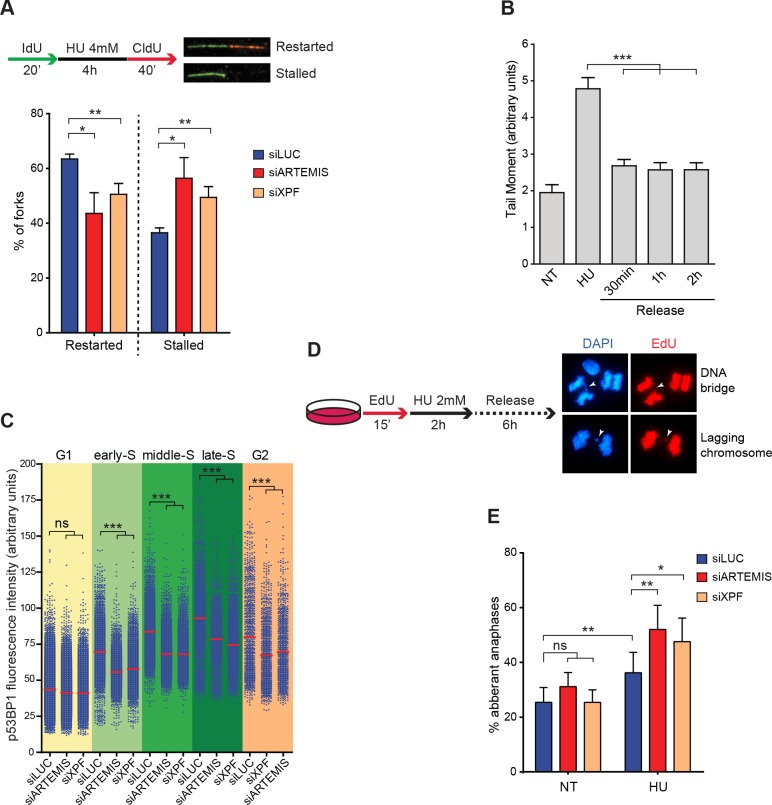
DNA replication stress (DRS) leads to the accumulation of stalled DNA replication forks leaving a fraction of genomic loci incompletely replicated, a source of chromosomal rearrangements during their partition in mitosis. MUS81 is known to limit the occurrence of chromosomal instability by processing these unresolved loci during mitosis. Here, we unveil that the endonucleases ARTEMIS and XPF-ERCC1 can also induce stalled DNA replication forks cleavage through non-epistatic pathways all along S and G2 phases of the cell cycle. We also showed that both nucleases are recruited to chromatin to promote replication fork restart. Finally, we found that rapid chromosomal breakage controlled by ARTEMIS and XPF is important to prevent mitotic segregation defects. Collectively, these results reveal that Rapid Replication Fork Breakage (RRFB) mediated by ARTEMIS and XPF in response to DRS contributes to DNA replication efficiency and limit chromosomal instability.


Conflict of interest statement

The authors have declared that no competing interests exist.

Figures

Fig 1
Fig 1. Brief replication stress results in rapid replication fork breakage.
(A) Quantification by neutral comet assay of DSBs induced, in response to treatment with various doses of HU for up to 24 hours. Representative images of cells treated for 4 hours are shown. Each data point corresponds to the mean tail moment (% DNA in tail x tail length) and error bars represent standard deviations from 3 independent experiments in which at least 150 comets were scored. (B) Schematic representation of quantitative image-based cytometry (QIBC). (C) Quantification of nuclear γH2AX (left) or p53BP1 (right) fluorescence intensity by QIBC in >2500 S-phase cells treated with the indicated doses of HU for 4 hours. ***p < 0.0001 (Mann-Whitney test). (D) Quantification of nuclear p53BP1 fluorescence intensity by QIBC in > 2000 S-phase cells either untreated (NT) or pretreated for 1 hour with an ATM inhibitor (ATMi; KU55933 10μM) and then treated with the indicated concentrations of HU for 4 hours in the presence or absence of the ATM inhibitor. ***p < 0.0001 (Mann-Whitney test).
Fig 2
Fig 2. Rapid replication fork breakage (RRFB) is independent of MUS81.
(A) Western blot of whole cell extracts of RKO cells showing depletion of Mus81 by siMus81 compared to a control, siLUC. Loading: nonspecific band. (B) Representative fields of QIBC images after MUS81 depletion and treatment with 4 mM HU for 4 hours. (C) Quantification of nuclear γH2AX (left) or p53BP1 (right) fluorescence intensity by QIBC in >1500 S-phase cells depleted of MUS81 (siMUS81) or depleted with a control siRNA (siLUC) and either treated or not treated with 4mM for 4 hours. ns: not significant (Mann–Whitney test). (D) Quantification of DSBs in cells depleted of MUS81 (siMUS81; blue) or depleted with a control siRNA (siLUC; gray) by neutral comet assay. Bars correspond to the median tail moment (% DNA in tail x tail length). Error bars represent standard deviations from 3 independent experiments in which at least 150 comets were scored. ns: not significant, ***p < 0.001 (Student’s T test).
Fig 3
Fig 3. ARTEMIS and XPF are involved in RRFB.
(A) Quantification by neutral comet assay of DSBs induced in response to treatment with 4 mM HU for 4 hours in control cells (siLUC) and in cells depleted of one of various endonucleases. The plot shows mean tail moment (% DNA in tail x tail length). Error bars represent SEMs. At least 150 comets were scored. *p < 0.05, ***p < 0.0001 (Mann–Whitney test). (B) Western blots of whole cell extracts of RKO cells showing depletion of Artemis (siARTEMIS), XPF (siXPF) and both (siXPF + ARTEMIS). (C) Quantification of nuclear p53BP1 fluorescence intensity by QIBC in >1500 S-phase RKO cells depleted of XPF and/or ARTEMIS and either untreated (NT) or treated with 4 mM of HU for 4 hours, as indicated. ***p < 0.0001 (Mann–Whitney test). (D) Quantification of nuclear p53BP1 fluorescence intensity by QIBC in Artemis-deficient RS-SCID patient cells (Guetel cells) and in XPF-deficient XP patient cells (XP fibroblasts group F) compared to WT primary fibroblasts. Mean fold change compared to untreated cells is shown. Error bars represent standard deviations from 3 independent experiments. *p < 0.05 (Student’s T test). (E) Quantification by neutral comet assay of DSBs in untreated RKO cells (NT) and in cells treated with 4 mM HU for 4 hours after depletion of XPF and/or ARTEMIS, as indicated. The plot shows mean tail moment (% DNA in tail x tail length). Error bars represent SEMs. At least 150 comets were scored. ***p < 0.0001 (Mann–Whitney test).
Fig 4
Fig 4. Regulation of ARTEMIS and XPF dependent RRFB.
(A) Purification of fork-associated proteins by native-iPOND in response to HU (4mM– 4hours). No Click, negative control; Chase, chromatin behind the forks. (B) Western blots of the soluble and insoluble fractions of RKO cells either untreated (-) or treated with 4 mM HU for 4 hours (+). Bar graph shows Image-J quantifications of ARTEMIS and RAD51 bands normalized to ORC2 intensity. (C) Quantification by neutral comet assay of DSBs in control cells (siLUC) and in cells depleted of ARTEMIS (siARTEMIS) and treated or not for 4 hours with 4mM of HU and/or 2.5μM of DNA-PK inhibitor (NU7441). The plot shows mean tail moment (% DNA in tail x tail length). Error bars represent SEMs. At least 250 comets were scored. ***p < 0.0001 (Mann–Whitney test). (D) Quantification of nuclear p53BP1 fluorescence intensity by QIBC in >1500 S-phase RKO cells depleted of XPF, SLX4 and/or ERCC1 and treated with 4 mM of HU for 4 hours. ***p < 0.0001 (Mann–Whitney test).
Fig 5
Fig 5. ARTEMIS and XPF promote efficient replication restart and prevent chromosome segregation defects.
(A) Schematic representation of the DNA fiber assay with images of typical restarted or stalled forks (top). Means and standard deviations of the percentages of restarted or stalled forks were derived from three independent experiments. *p < 0.05, **p < 0.01 (Student’s T test). (B) RKO cells treated for 4 hours with 4mM HU and released into fresh media for the indicated times were subjected to comet assay to quantify DSBs. The plot shows mean tail moment (% DNA in tail x tail length). Error bars represent SEMs. At least 250 comets were scored. ***p < 0.0001 (Mann–Whitney test). (C) Quantification of nuclear p53BP1 fluorescence intensity by QIBC in >7500 cells depleted of Artemis (siARTEMISs) or XPF (siXPF) or treated with a control siRNA (siLUC) and treated with with 4mM HU for 4 hours. The cells were sorted into the five indicated phases of the cell cycle based on their EdU and DAPI content. ns: not significant, ***p < 0.0001 (Mann–Whitney test). (D) Schematic representation of the experiment performed to quantify aberrant anaphases in cells treated with HU and typical images of DNA bridges and lagging chromosomes in anaphase cells. (E) Quantification of aberrant anaphases in untreated (NT) or HU-treated cells depleted of ARTEMIS or XPF. Error bars represent standard deviations from 3 independent experiments. *p < 0.05, **p < 0.01 (Student’s T test).

References

    1. Zeman MK, Cimprich KA. Causes and consequences of replication stress. Nat Cell Biol. 2014;16(1):2–9. 10.1038/ncb2897 . - DOI - PMC - PubMed
    1. Macheret M, Halazonetis TD. DNA replication stress as a hallmark of cancer. Annu Rev Pathol. 2015;10:425–48. 10.1146/annurev-pathol-012414-040424 . - DOI - PubMed
    1. Saldivar JC, Cortez D, Cimprich KA. The essential kinase ATR: ensuring faithful duplication of a challenging genome. Nat Rev Mol Cell Biol. 2017. 10.1038/nrm.2017.67 . - DOI - PMC - PubMed
    1. Petermann E, Orta ML, Issaeva N, Schultz N, Helleday T. Hydroxyurea-stalled replication forks become progressively inactivated and require two different RAD51-mediated pathways for restart and repair. Mol Cell. 2010;37(4):492–502. Epub 2010/03/02. 10.1016/j.molcel.2010.01.021 ; PubMed Central PMCID: PMC2958316. - DOI - PMC - PubMed
    1. Hanada K, Budzowska M, Davies SL, van Drunen E, Onizawa H, Beverloo HB, et al. The structure-specific endonuclease Mus81 contributes to replication restart by generating double-strand DNA breaks. Nat Struct Mol Biol. 2007;14(11):1096–104. 10.1038/nsmb1313 . - DOI - PubMed

Publication types

MeSH terms