Comparative Study
. 2018 Jul 30;13(7):e0200653.
doi: 10.1371/journal.pone.0200653. eCollection 2018.

Cryopreservation of human mucosal tissues

Affiliations
Comparative Study

Cryopreservation of human mucosal tissues

Sean M Hughes et al. PLoS One. .

Abstract

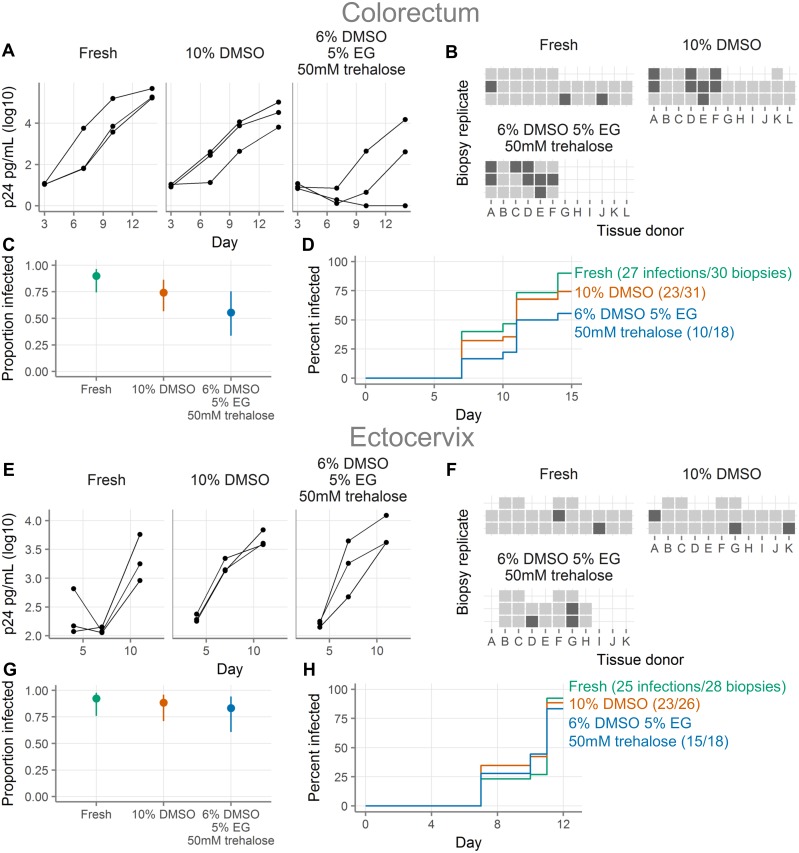
Background: Cryopreservation of leukocytes isolated from the cervicovaginal and colorectal mucosa is useful for the study of cellular immunity (see Hughes SM et al. PLOS ONE 2016). However, some questions about mucosal biology and sexually transmitted infections are better addressed with intact mucosal tissue, for which there is no standard cryopreservation protocol.

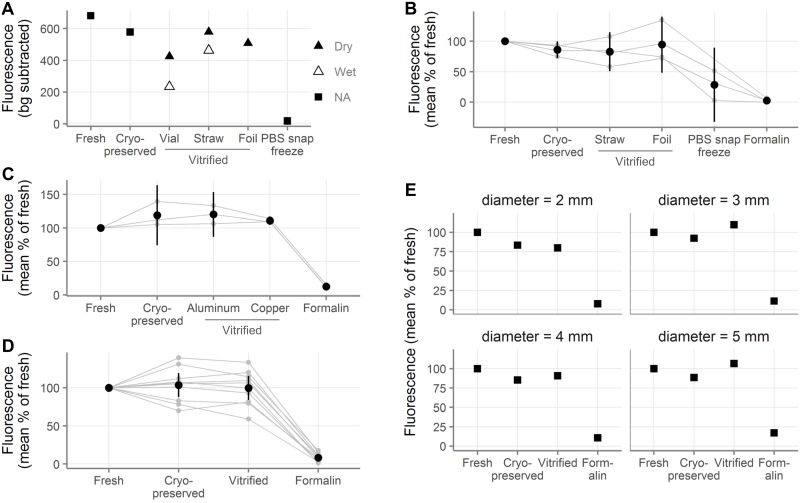
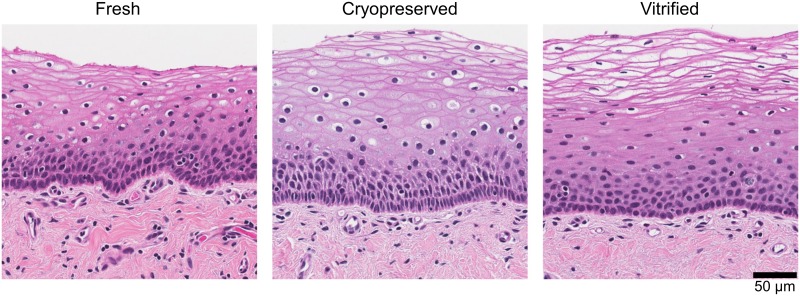
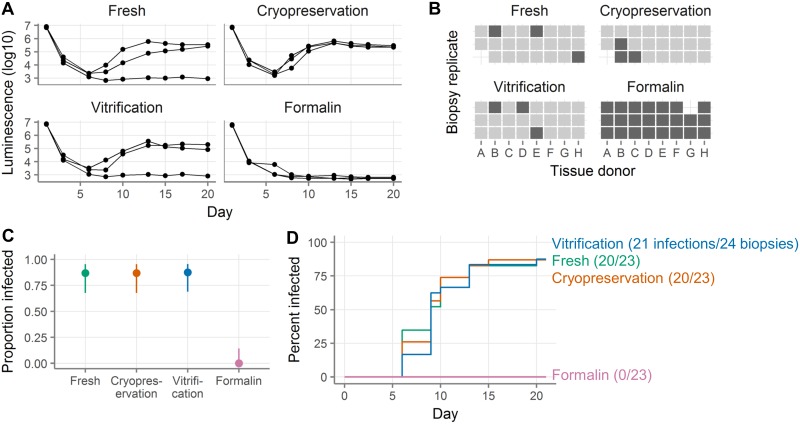
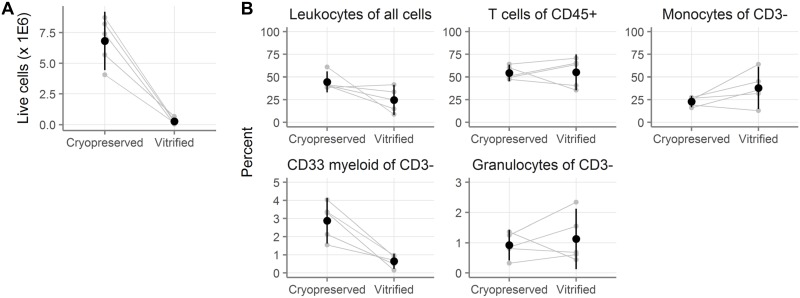
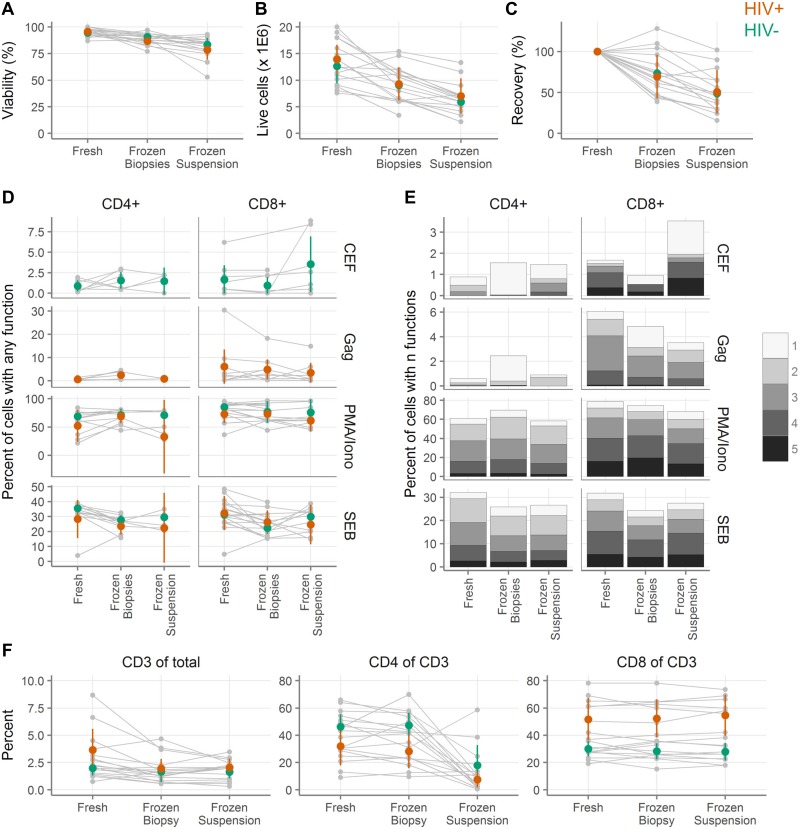
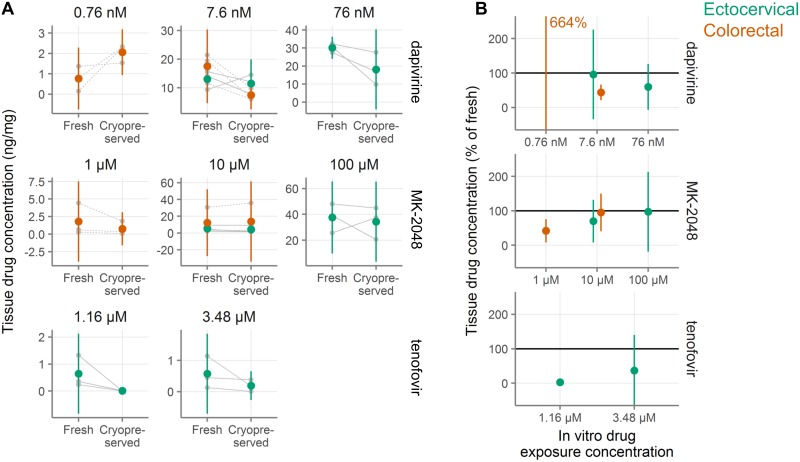
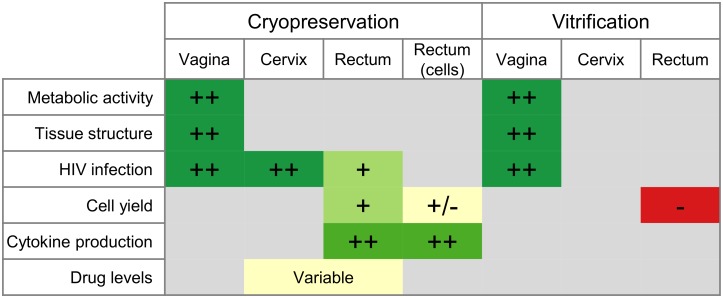
Methods and findings: To find an optimal preservation protocol for mucosal tissues, we tested slow cooling (1°C/min) with 10% dimethylsulfoxide (designated "cryopreservation") and fast cooling (plunge in liquid nitrogen) with 20% dimethylsulfoxide and 20% ethylene glycol ("vitrification"). We compared fresh and preserved human cervicovaginal and colorectal tissues in a range of assays, including metabolic activity, human immunodeficiency virus infection, cell phenotype, tissue structure by hematoxylin-and-eosin staining, cell number and viability, production of cytokines, and microbicide drug concentrations. Metabolic activity, HIV infectability, and tissue structure were similar in cryopreserved and vitrified vaginal tissues. However, vitrification led to poor cell recovery from the colorectal mucosa, with 90% fewer cells recovered after isolation from vitrified colorectal tissues than from cryopreserved. HIV infection rates were similar for fresh and cryopreserved ectocervical tissues, whereas cryopreserved colorectal tissues were less easily infected than fresh tissues (hazard ratio 0.7 [95% confidence interval 0.4, 1.2]). Finally, we compared isolation of cells before and after cryopreservation. Cell recoveries were higher when cells were isolated after freezing and thawing (71% [59-84%]) than before (50% [38-62%]). Cellular function was similar to fresh tissue in both cases. Microbicide drug concentrations were lower in cryopreserved explants compared to fresh ones.

Conclusions: Cryopreservation of intact cervicovaginal and colorectal tissues with dimethylsulfoxide works well in a range of assays, while the utility of vitrification is more limited. Cell yields are higher from cryopreserved intact tissue pieces than from thawed cryopreserved single cell suspensions isolated before freezing, but T cell functions are similar.


Conflict of interest statement

Merck & Co., Inc., Kenilworth, NJ USA provided MK-2018 for use in this study. The authors declare that no other competing interests exist and confirm that this does not alter our adherence to PLOS ONE policies on sharing data and materials.

Figures

Fig 1
Fig 1. Cryopreserved and vitrified vaginal explants show similar levels of metabolic activity to fresh explants.
A, Background-subtracted alamar blue fluorescence of vaginal explants after 5h of culture following cryopreservation and vitrification. “Wet” explants were immersed in vitrification medium during freezing and “dry” explants were blotted dry before freezing (n = 1 tissue donor). “NA” stands for “not applicable” and indicates non-vitrification conditions; “PBS”, “phosphate buffered saline”; “bg”, “background.” B, Normalized alamar blue fluorescence of vaginal explants (expressed as percent of the fluorescence measured in the fresh explants from the same donor). Promising conditions from A were repeated with explants from 3 tissue donors, which are shown together with the data from the first tissue donor in A. C, Normalized alamar blue fluorescence of vaginal explants comparing vitrification with aluminum or copper foil (n = 3 tissue donors). D, Summary of experiments comparing cell metabolic activity after cryopreservation and vitrification (aluminum foil) in vaginal explants (n = 10 tissue donors). E, Effect of tissue size on cell metabolic activity after cryopreservation or vitrification (aluminum foil). Here fluorescence was normalized to the fresh explants of the same diameter (n = 1 tissue donor; “mm”, millimeter). In A and E, symbols indicate the average of two to three explants. In B-D, smaller gray points indicate the average of duplicate explants, with gray lines indicating samples from the same tissue donor. Black points show the mean across all tissue donors and black vertical lines show the 95% confidence interval of the mean.
Fig 2
Fig 2. Cryopreserved and vitrified vaginal explants maintain similar tissue structure to fresh explants.
Example images from one tissue donor of hematoxylin-and-eosin-stained sections of vaginal tissue after no treatment (left), cryopreservation (middle), and vitrification (right) (total n = 5 tissue donors). Scale bar indicates size (“μm”, micrometer).
Fig 3
Fig 3. Cryopreserved and vitrified vaginal explants are similarly susceptible to HIV infection as fresh explants.
A, HIV challenge curves showing nanoluciferase luminescence from a single tissue donor. Each line represents a single explant and points represent supernatant collections. The left-most point shows the viral inoculum and the next point shows the level of residual nanoluciferase after virus wash-off. All three explants come from the same donor. B, Summary of HIV challenge experiments. Explants are defined as infected on the first day after day 5 where the luminescence exceeds 1E4. Each square represents a single explant, with each column representing a different donor (total n = 8 donors with 2–3 explants per donor per condition). Light squares indicate explants that became infected and dark squares explants that did not. Missing squares indicate cases where there was inadequate tissue available to have three explants in all conditions or where an explant was lost by experimental error. C, Proportion of explants that became infected. Points show the proportion of all challenged explants that became infected. Lines show the 95% binomial proportion confidence intervals. D, Survival curves indicating cumulative HIV infection for all explants tested in each condition. Fresh explants are shown in green, cryopreserved in orange, vitrified in blue, and formalin-fixed in pink.
Fig 4
Fig 4. Ten-fold more cells are recovered after cryopreservation than vitrification of colorectal biopsies.
A, Number of live cells recovered after digestion of colorectal biopsies that had been cryopreserved or vitrified (n = 5 donors with 15 biopsies per donor per condition). B, Cell phenotypes as measured by flow cytometry. Leukocytes are defined as CD45+. T cells are CD45+CD3+. Monocytes are CD45+CD3-CD13+. CD33 myeloid are CD45+CD3-CD33+. Granulocytes are CD45+CD3-CD66b+. Small gray symbols indicate the number (A) or percent (B) from fifteen colorectal biopsies, with gray lines indicating samples from the same tissue donor. Black symbols show the mean across all tissue donors and black vertical lines show the 95% confidence interval of the mean.
Fig 5
Fig 5. Cryopreserved colorectal explants are somewhat less susceptible to HIV infection than fresh colorectal explants, while cryopreserved and fresh ectocervical explants are similarly susceptible.
A, HIV challenge curves for colorectal tissue showing HIV p24 concentrations (picograms/milliliter) from a single tissue donor either fresh or after cryopreservation with the indicated cryopreservation media. Each line represents a single explant and points represent supernatant collections. All three explants come from the same donor. “DMSO”, dimethylsulfoxide; “EG”, “ethylene glycol”; “mM”, “millimolar”. B, Summary of HIV challenge experiments for colorectal tissues. Each square represents a single explant, with each column representing a different donor (total n = 12 donors with 2–3 explants per donor per condition, as shown). Light squares indicate explants that became infected and dark squares explants that did not. Missing squares indicate cases where there was inadequate tissue available to have three explants in all conditions or where an explant was lost by experimental error. Explants are defined as infected on the first day after day 5 where the p24 concentration exceeds 250 pg/mL. C, Proportion of colorectal explants that became infected. Points show the proportion of all challenged explants that became infected. Lines show the 95% binomial proportion confidence intervals. D, Survival curves indicating cumulative HIV infection for all colorectal explants tested in each condition. Fresh explants are shown in green, cryopreserved with 10% DMSO in orange, and cryopreserved with 6% DMSO, 5% EG, and 50 mM trehalose in blue. E, HIV challenge curves for ectocervical tissue, as in A. F, Summary of HIV challenge experiments for ectocervical tissue, as in B, with a threshold of infection of 500 pg/mL (total n = 11 donors with 2–3 explants per donor per condition, as shown). G, Proportion of ectocervical explants that became infected, as in C. H, Survival curves for HIV infection of ectocervical explants, as in D.
Fig 6
Fig 6. Cryopreservation of intact colorectal tissue leads to greater cell numbers than cryopreservation of cell suspensions, while cellular functionality is similar.
A, Viability by trypan blue exclusion of colorectal cells digested from biopsies either fresh, cryopreserved as biopsies, or cryopreserved after digestion (n = 18 tissue donors). B, Live cell yield by trypan blue exclusion. C, Recovery of live cells after cryopreservation relative to fresh samples from the same donor. D, Background-subtracted cytokine production from colorectal T cells after stimulation with cytomegalovirus, Epstein-Barr virus and influenza virus peptides (CEF); HIV Gag peptides (Gag); phorbol 12-myristate 13-acetate and ionomycin (PMA/Iono); or staphylococcal enterotoxin B (SEB). Small gray symbols indicate individual samples, with gray lines connecting samples from the same tissue donors. Colored symbols show the mean across all samples from HIV+ (orange) and HIV- (green) donors, with vertical lines showing the 95% confidence interval of the mean. E, Polyfunctionality of colorectal responses to stimulation. Each sub-bar corresponds to the percent of cells with the indicated number of functions, averaged across the donors. Total bar height indicates the total percent of cells with one or more functions.
Fig 7
Fig 7. Retention of antiretroviral drugs in ectocervical and colorectal tissue after cryopreservation.
A, Concentration of drug measured in tissues either fresh or after cryopreservation (n = 3 tissue donors per condition with two explants per donor per condition). Explants were exposed in vitro to antiretroviral drugs at the concentrations indicated above each plot. After drug exposure and cryopreservation, drug levels were measured in the tissues. Small gray symbols indicate the average of two explants and gray lines connect samples from the same tissue donor (dashed indicates colorectal, solid indicates ectocervical). Large symbols indicate the mean for that tissue type (orange indicates colorectal, green indicates ectocervical). Vertical green and orange lines show 95% confidence intervals. B, Normalized drug concentration expressed as percent of drug concentration in fresh samples from the same tissue donor. Colored symbols show the mean across all tissue donors and colored vertical lines show the 95% confidence interval of the mean. The mean recovery for dapivirine in colorectal tissue is off-scale and the value is indicated in text.
Fig 8
Fig 8. Summary of all cryopreservation and vitrification experiments and tissue types.
Signs indicate performance of each tissue type in each assay, relative to the performance of the fresh tissue. ++ indicates equivalence to fresh, + indicates a reduction but probably acceptable, +/- indicates marginal performance, and—indicates inadequate. Colors also indicate performance, with red to yellow to green representing worse to better performance, as compared to fresh tissue. Gray squares indicate that the assay was not performed for that combination of sample type and preservation type.

References

    1. Hughes SM, Shu Z, Levy CN, Ferre AL, Hartig H, Fang C, et al. Cryopreservation of Human Mucosal Leukocytes. PLoS One. 2016;11: e0156293 10.1371/journal.pone.0156293 - DOI - PMC - PubMed
    1. McGowan I, Tanner K, Elliott J, Ibarrondo J, Khanukhova E, McDonald C, et al. Nonreproducibility of “Snap-Frozen” Rectal Biopsies for Later Use in Ex Vivo Explant Infectibility Studies. AIDS Res Hum Retroviruses. 2012;28: 1509–1512. 10.1089/AID.2012.0062 - DOI - PMC - PubMed
    1. Fox JM, Wiggins RC, Moore JWJ, Brewer C, Andrew AC, Martin F. Methodology for reliable and reproducible cryopreservation of human cervical tissue. Cryobiology. Elsevier Ltd; 2017;77: 14–18. 10.1016/j.cryobiol.2017.06.004 - DOI - PMC - PubMed
    1. Dezzutti CS, Richardson-Harman N, Rohan LC, Marzinke MA, Hoesley CJ, Panther L, et al. Pharmacodynamic correlations using fresh and cryopreserved tissue following use of vaginal rings containing dapivirine and/or maraviroc in a randomized, placebo controlled trial. Medicine (Baltimore). 2016;95: e4174 10.1097/MD.0000000000004174 - DOI - PMC - PubMed
    1. Gupta P, Ratner D, Patterson BK, Kulka K, Rohan LC, Parniak M a, et al. Use of frozen-thawed cervical tissues in the organ culture system to measure anti-HIV activities of candidate microbicides. AIDS Res Hum Retroviruses. 2006;22: 419–24. 10.1089/aid.2006.22.419 - DOI - PubMed

Publication types

LinkOut - more resources