. 2018 Jul 30;13(7):e0201529.
doi: 10.1371/journal.pone.0201529. eCollection 2018.

A radial calibration window for analytical ultracentrifugation

Affiliations

A radial calibration window for analytical ultracentrifugation

Thomas LeBrun et al. PLoS One. .

Abstract

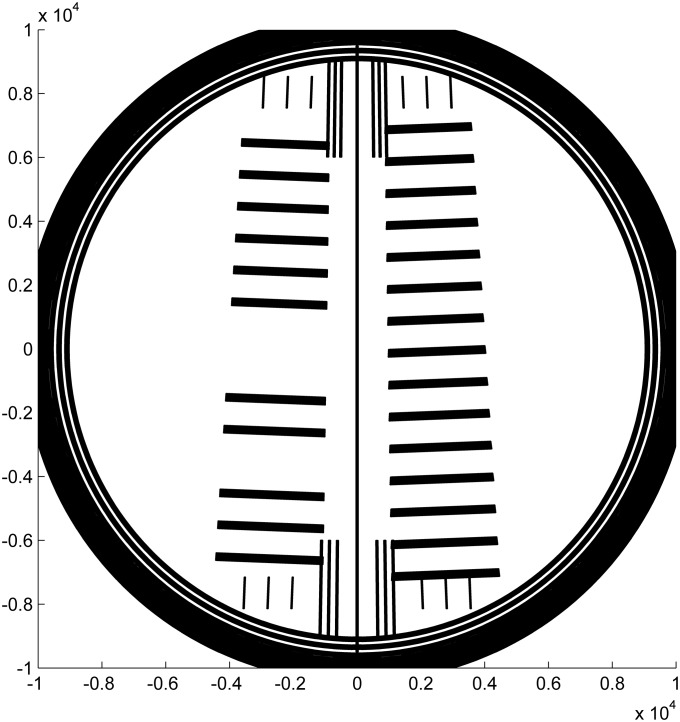
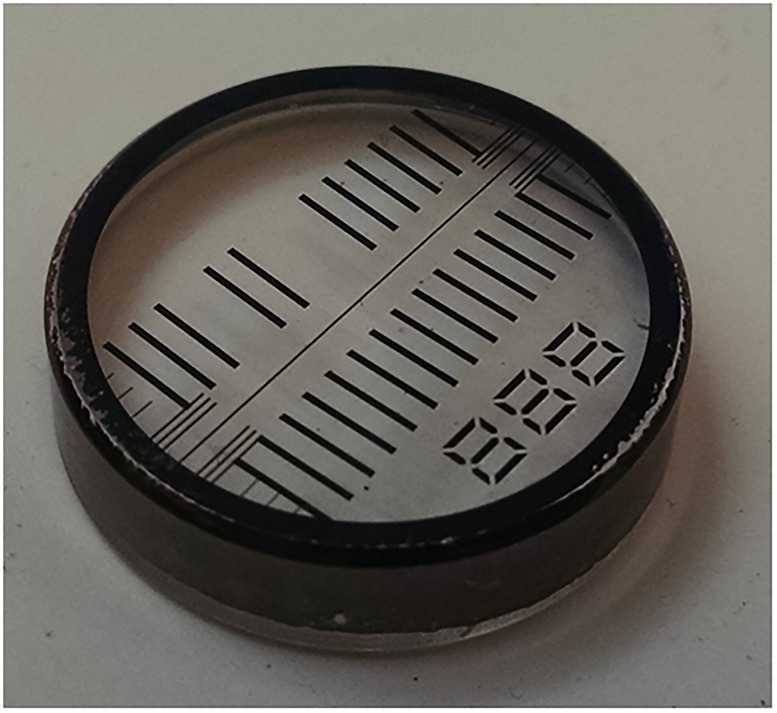
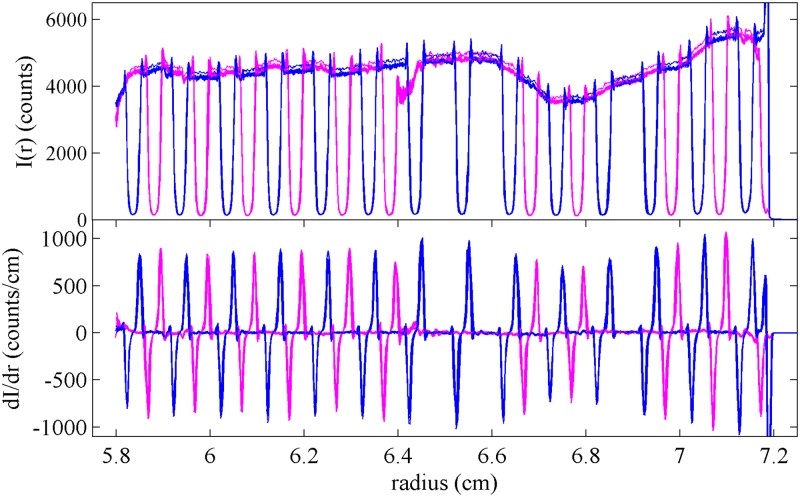
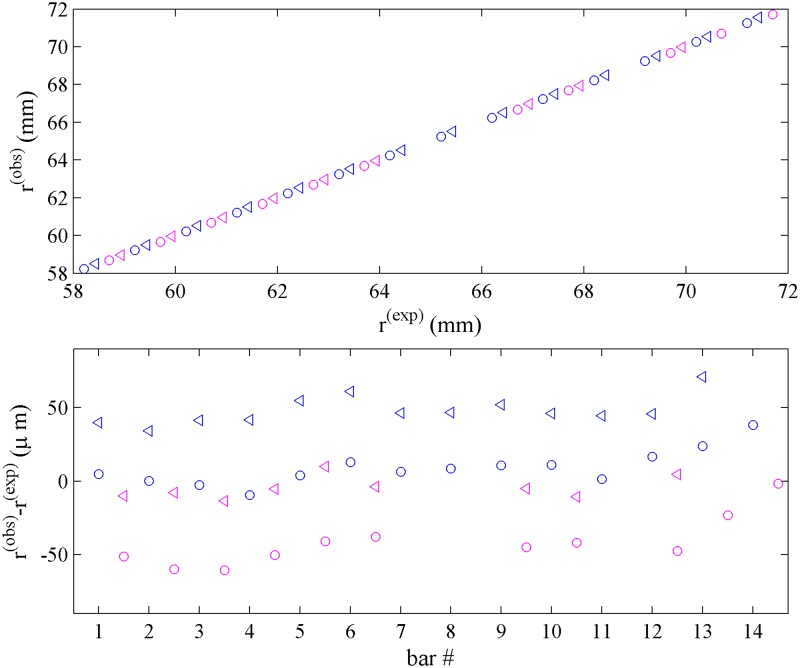
Analytical ultracentrifugation (AUC) is a first-principles based method for studying macromolecules and particles in solution by monitoring the evolution of their radial concentration distribution as a function of time in the presence of a high centrifugal field. In sedimentation velocity experiments, hydrodynamic properties relating to size, shape, density, and solvation of particles can be measured, at a high hydrodynamic resolution, on polydisperse samples. In a recent multilaboratory benchmark study including data from commercial analytical ultracentrifuges in 67 laboratories, the calibration accuracy of the radial dimension was found to be one of the dominant factors limiting the accuracy of AUC. In the present work, we develop an artifact consisting of an accurately calibrated reflective pattern lithographically deposited onto an AUC window. It serves as a reticle when scanned in AUC control experiments for absolute calibration of radial magnification. After analysis of the pitch between landmarks in scans using different optical systems, we estimate that the residual uncertainty in radial magnification after external calibration with the radial scale artifact is ≈0.2 %, of similar magnitude to other important contributions after external calibration such as the uncertainty in temperature and time. The previous multilaboratory study had found many instruments with errors in radial measurements of 1 % to 2 %, and a few instruments with errors in excess of 15 %, meaning that the use of the artifact developed here could reduce errors by 5-to 10-fold or more. Adoption of external radial calibration is thus an important factor for assuring accuracy in studies related to molecular hydrodynamics and particle size measurements by AUC.


Conflict of interest statement

The authors have declared that no competing interests exist.

Figures

Fig 1
Fig 1. Drawing of the mask design.
Two scales (series of lines) are perpendicular to the radius from the center of rotation once placed in the rotor hole of the analytical ultracentrifuge. The sample side (right) and reference side (left) have the same pitch of 1 mm, but are shifted by half the pitch. A long central line and 12 short lines near the center are added as a visual guide for mounting the window into the cell assembly, to facilitate angular alignment relative to the middle divider of a centerpiece. Three short lines above and below each scale are features recognized when calibrating the artifacts for certification and encompass the angular range over which the scale pitch is determined. The units of the axis drawn are micrometers.
Fig 2
Fig 2. Picture of the radial scale artifact.
The artifact is comprised of a lithographic chrome mask deposited on a sapphire substrate (a standard 3/4 inch diameter AUC window). The average pitch was measured to be 0.999748 mm.
Fig 3
Fig 3. Radial scans of transmitted intensities.
Superposition of 10 intensity scans of the artifact using the absorbance optics at 280 nm in stepping mode with radial resolution of 0.001 cm, showing the signal of the sample side (blue) and reference side (magenta). The top panel shows the raw data, and the bottom panel shows a derivative plot (calculated with Savitzky-Golay filter [29] with frame length of 7 and polynomial order of 2). The intensity of the transmitted light varies slightly and with low spatial frequency due to variations of the local photocathode sensitivity.
Fig 4
Fig 4. Analysis of the intensity profiles of Fig 3.
Top: Points of maximum slope in the transmitted signal for light-to-shadow transitions (circle) and shadow-to-light transition (triangle) of each bar in the sample side (blue) and reference side (magenta), r(obs), plotted against the ideally expected position of the line edges, r(exp), given the known pitch of p0 = 0.999748 mm and known line width of 0.228 mm. Due to the unknown overall radial position of the mask, the expected positions have the same arbitrary offset. Bottom: Difference between the radii of the measured transitions and the expected location of the edges of the mask. Slopes in this plot visually highlight differences in the pitch. Irrespective of the pitch, for a mask with perfect rotational alignment, the difference between measured and ideally expected edge positions would be the same for corresponding edges in the reference and sample side, i.e., equivalent blue and magenta symbols would not be offset. The observed (≈50 μm) displacement between sample and reference transitions seen from the vertical shift between blue and magenta symbols in the bottom panel reveal rotational misalignment, here corresponding to 0.51°. This rotation will also change the measured pitch along the line of measurement very slightly, making it larger by p0/cos(α) − p0, which here amounts to 0.04 μm. The displacement between triangles and circles reflects the difference between observed and designed linewidth, a feature not utilized in the analysis due to its susceptibility to optical misalignment and the detailed shape of the measured transitions.
Fig 5
Fig 5. Intensity profiles of a rotated artifact.
Intensity profiles acquired in the absorbance optics after intentional rotation of the artifact by 5.7°. Due to the rotation, the pattern from the sample sector (blue) and the reference sector (magenta) almost superimpose, rather than showing the half pitch offset expected at perfect rotational alignment.
Fig 6
Fig 6. Calibration data in the Rayleigh interference optical system.
(A) Screenshot of the AUC interference camera image from the artifact (expanded to the same radial scale as in B). Due to diffraction effects in this instrument, the regions of the bars are still illuminated with strongly sloping fringe shifts at each edge, forming a maximum or minimum for sample or reference side, respectively. (B) Overlay of 5 fringe shift profiles produced by the instrument software from the camera data, sequentially acquired in the same run. The discontinuity of fringes at the center of each bar can cause integral fringe shifts in the reported data. Peak locations were taken as landmark for the determination of pitch. (C) Difference between landmarks for each bar of the mask in the sample (blue circles) and reference sectors (magenta circles), and the calculated position based on the known pitch of the artifact. Best-fit linear regressions are shown as solid lines; their average slope corresponds to the instrument calibration errors of the fringe shift data, and their displacement reveals rotational misalignment of the artifact.
Fig 7
Fig 7. Fluorescence data using the artifact.
Superposition of fluorescence scans taken with the lithography pattern facing the centerpiece containing a fluorescein solution. (Top) Shown are scans from sample sector at focal depth of 3955 μm (black), 2697 μm (green), 2196 μm (blue, superposition of 4 replicates), and 1695 μm (cyan), and from the reference sector at focal depth of 2196 μm (magenta, superposition of 4 replicates). (Bottom) Superposition of derivatives of all traces acquired at a focal depth of 2196 μm for sample (blue) and reference sector (magenta).

References

    1. Svedberg T, Pedersen KO. The Ultracentrifuge. London: Oxford University Press; 1940.
    1. Schuck P, Zhao H, Brautigam CA, Ghirlando R. Basic Principles of Analytical Ultracentrifugation. Boca Raton, FL: CRC Press; 2015.
    1. Mächtle W. High-resolution, submicron particle size distribution analysis using gravitational-sweep sedimentation. Biophys J. 1999;76(2):1080–1091. 10.1016/S0006-3495(99)77273-5 - DOI - PMC - PubMed
    1. Ma J, Zhao H, Sandmaier J, Liddle JA, Schuck P. Variable-field analytical ultracentrifugation: II. Gravitational sweep sedimentation. Biophys J. 2016;110(1):103–112. 10.1016/j.bpj.2015.11.027 - DOI - PMC - PubMed
    1. Errington N, Rowe AJ. Probing conformation and conformational change in proteins is optimally undertaken in relative mode. Eur Biophys J. 2003;32(5):511–517. 10.1007/s00249-003-0315-x - DOI - PubMed

Publication types

MeSH terms

LinkOut - more resources