. 2018 Jul 30;13(7):e0199794.
doi: 10.1371/journal.pone.0199794. eCollection 2018.

Manipulating graded exercise test variables affects the validity of the lactate threshold and V ˙ O 2 peak

Affiliations

Manipulating graded exercise test variables affects the validity of the lactate threshold and V ˙ O 2 peak

Nicholas A Jamnick et al. PLoS One. .

Abstract

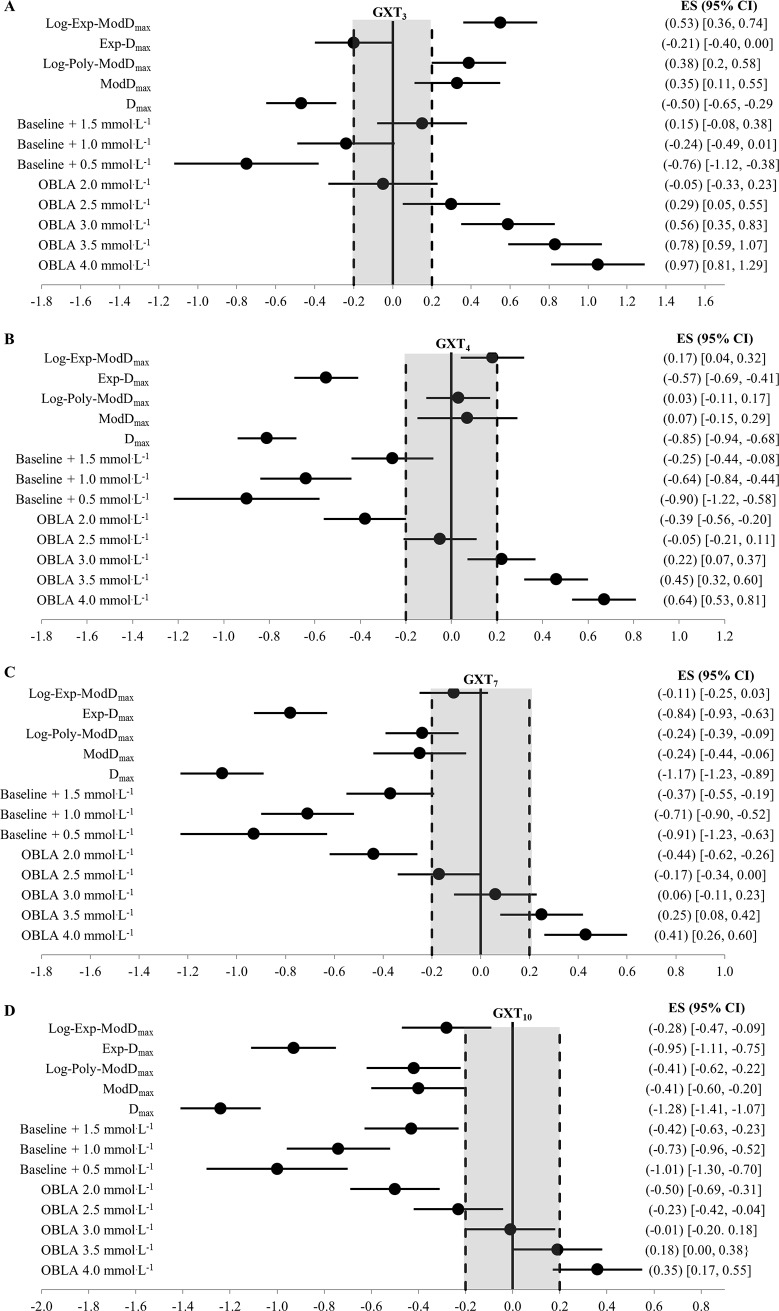
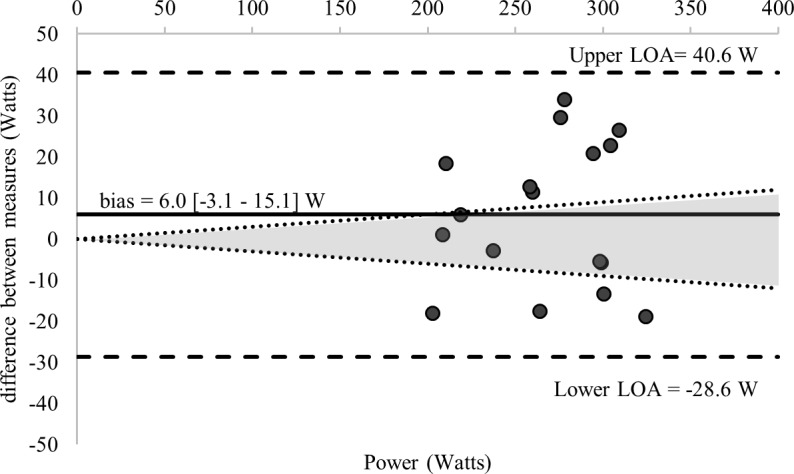
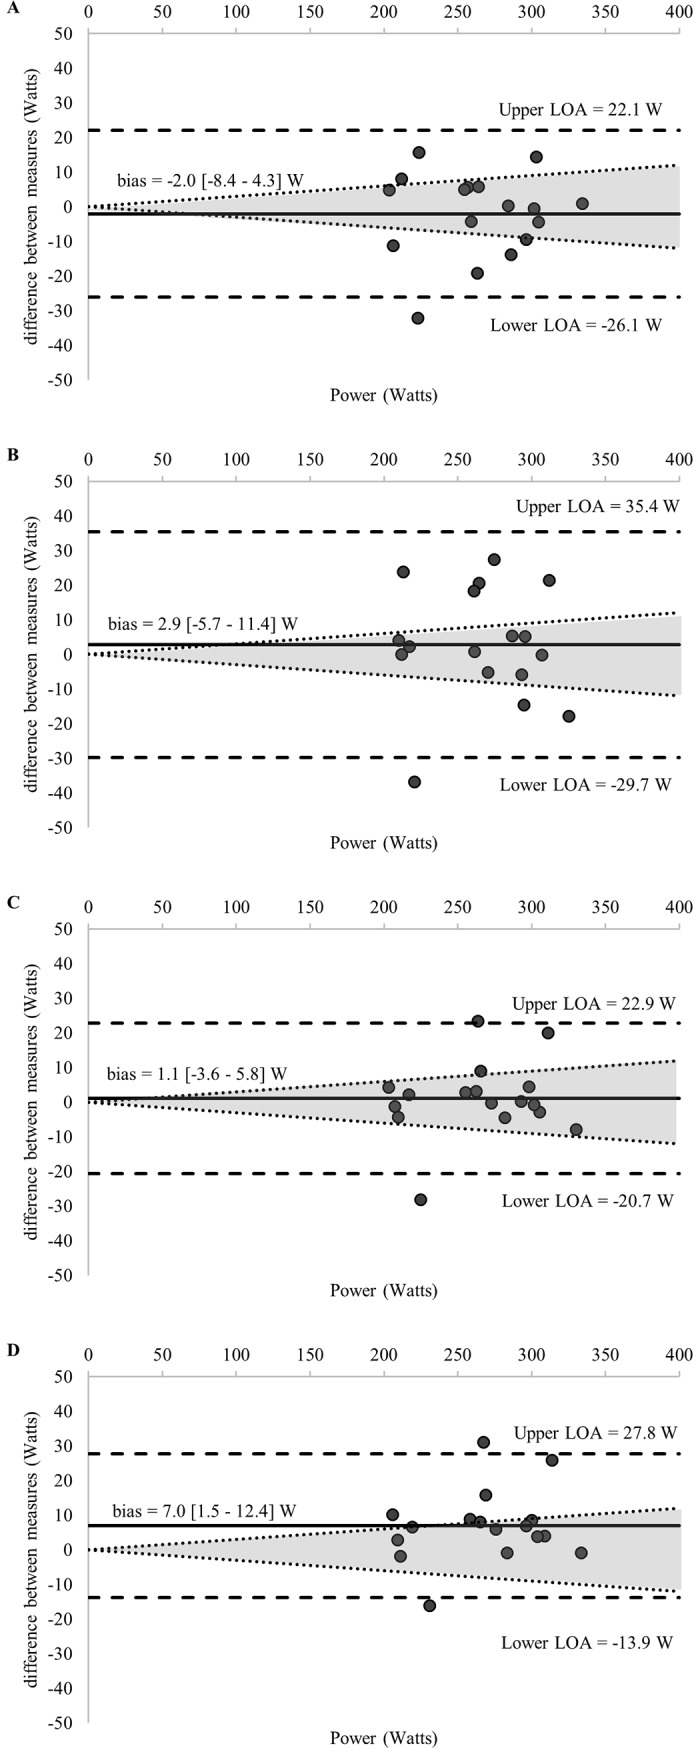
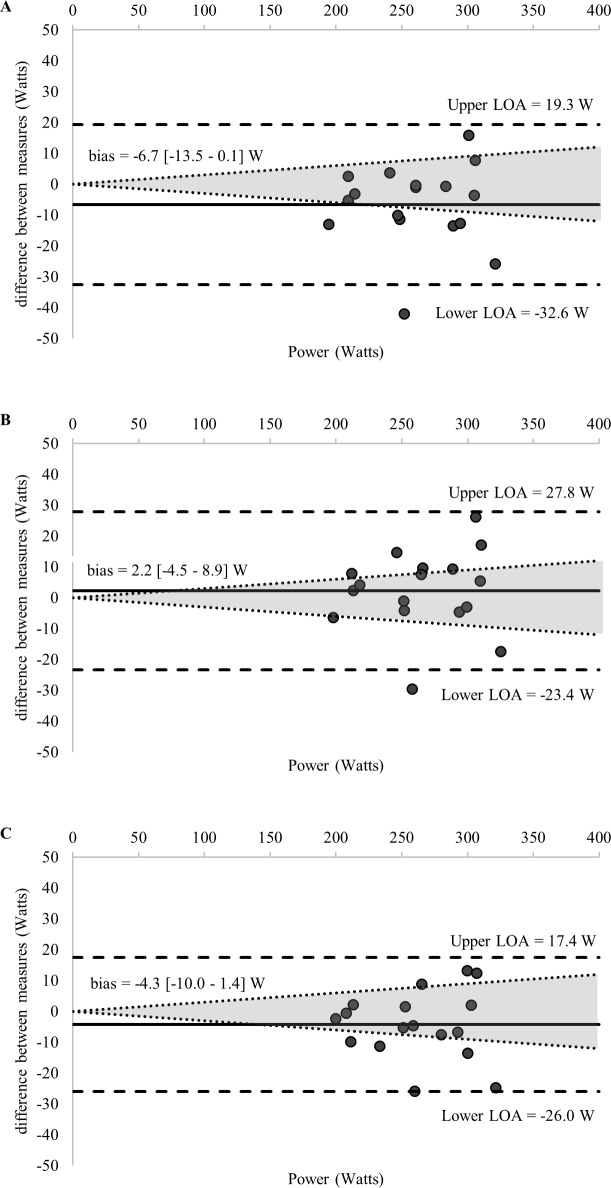
Background: To determine the validity of the lactate threshold (LT) and maximal oxygen uptake ( V ˙ O 2 max ) determined during graded exercise test (GXT) of different durations and using different LT calculations. Trained male cyclists (n = 17) completed five GXTs of varying stage length (1, 3, 4, 7 and 10 min) to establish the LT, and a series of 30-min constant power bouts to establish the maximal lactate steady state (MLSS). V ˙ O 2 was assessed during each GXT and a subsequent verification exhaustive bout (VEB), and 14 different LTs were calculated from four of the GXTs (3, 4, 7 and 10 min)-yielding a total 56 LTs. Agreement was assessed between the highest V ˙ O 2 measured during each GXT ( V ˙ O 2 peak ) as well as between each LT and MLSS. V ˙ O 2 peak and LT data were analysed using mean difference (MD) and intraclass correlation (ICC).

Results: The V ˙ O 2 peak value from GXT1 was 61.0 ± 5.3 mL.kg-1.min-1 and the peak power 420 ± 55 W (mean ± SD). The power at the MLSS was 264 ± 39 W. V ˙ O 2 peak from GXT3, 4, 7, 10 underestimated V ˙ O 2 peak by ~1-5 mL.kg-1.min-1. Many of the traditional LT methods were not valid and a newly developed Modified Dmax method derived from GXT4 provided the most valid estimate of the MLSS (MD = 1.1 W; ICC = 0.96).

Conclusion: The data highlight how GXT protocol design and data analysis influence the determination of both V ˙ O 2 peak and LT. It is also apparent that V ˙ O 2 max and LT cannot be determined in a single GXT, even with the inclusion of a VEB.


Conflict of interest statement

The authors have declared that no competing interests exist.

Figures

Fig 1
Fig 1. Representative blood lactate curve with 14 LTs calculated from GXT4 (participant #9).
The power of the MLSS was 302 W and the blood lactate concentration was 2.85 mmol.L-1. Log-log = power at the intersection of two linear lines with the lowest residual sum of squares; log = using the log-log method as the point of the initial data point when calculating the Dmax or Modified Dmax; poly = Modified Dmax method calculated using a third order polynomial regression equation; exp = Modified Dmax method calculated using a constant plus exponential regression equation; OBLA = onset of blood lactate accumulation; B + absolute value = the intensity where blood lactate increases above baseline.
Fig 2
Fig 2
(A-D) Forrest Plots of the difference (ES ± 95% CI) between the MLSS and the power calculated from the 13 lactate thresholds derived from (A) GXT3, (B) GXT4, (C) GXT7 and (D) GXT10 (52 in total and excluding log-log). The solid vertical bar represents no difference from the MLSS and the dashed vertical bars represents the threshold between a trivial and small difference (ES = 0.2) established by Cohen (50) and Hopkins (49). log = using the log-log method as the initial data point when calculating the Dmax or Modified Dmax; poly = Modified Dmax method calculated using a third order polynomial regression equation; exp = Modified Dmax method calculated using a constant plus exponential regression equation; OBLA = onset of blood lactate accumulation.
Fig 3
Fig 3. Bland-Altman plots displaying agreement between measures of the power associated with the RCP regression equation (RCPMLSS) calculated from GXT1 and the MLSS.
The differences between measures (y-axis) are plotted as a function of the mean of the two measures (x-axis) in power (Watts). The horizontal solid line represents the mean difference between the two measures (i.e., bias). The two horizontal dashed lines represent the limits of agreement (1.96 x standard deviation of the mean difference between the estimated lactate threshold via the RCPMLSS and the maximal lactate steady state). The dotted diagonal lines represent the boundaries of the 95% CI for MLSS reliability (CV = 3.0%; 95%; CI = 3.8%) calculated from Hauser et al., 2014) (RCP = respiratory compensation point).
Fig 4
Fig 4. Bland-Altman plots displaying agreement between measures of the power associated with the baseline plus 1.5 mmol.L-1 calculated from GXT3 and the MLSS.
The differences between measures (y-axis) are plotted as a function of the mean of the two measures (x-axis) in power (Watts). The horizontal solid line represents the mean difference between the two measures (i.e., bias). The two horizontal dashed lines represent the limits of agreement (1.96 x standard deviation of the mean difference between the lactate threshold and the maximal lactate steady state). The dotted diagonal lines represent the boundaries of the 95% CI for MLSS reliability (CV = 3.0%; 95%; CI = 3.8%) calculated from Hauser et al., 2014).
Fig 5
Fig 5
(A-D) Bland-Altman plots displaying agreement between measures of the power associated with the (A) OBLA 2.5 mmol.L-1, (B) Modified Dmax, (C) Log-Poly-Modified Dmax, (D) Log-Exp-Modified Dmax calculated from GXT4 and the MLSS. The differences between measures (y-axis) are plotted as a function of the mean of the two measures (x-axis) in power (Watts). The horizontal solid line represents the mean difference between the two measures (i.e., bias). The two horizontal dashed lines represent the limits of agreement (1.96 x standard deviation of the mean difference between the lactate threshold and the maximal lactate steady state). The dotted diagonal lines represent the boundaries of the 95% CI for MLSS reliability (CV = 3.0%; 95%; CI = 3.8%) calculated from Hauser et al., 2014) (log = Modified Dmax method using the log-log method as the point of the initial lactate point; poly = Modified Dmax method calculated using a third order polynomial regression equation; exp = Modified Dmax method calculated using a constant plus exponential regression equation; OBLA = onset of blood lactate accumulation.).
Fig 6
Fig 6
(A-C) Bland-Altman plots displaying agreement between measures of the power associated with the (A) OBLA 2.5 mmol.L-1 (GXT7), (B) OBLA 3.0 mmol.L-1 (GXT7), (C) Log-Exp-Modified Dmax calculated from GXT7 and the MLSS. The differences between measures (y-axis) are plotted as a function of the mean of the two measures (x-axis) in power (Watts). The horizontal solid line represents the mean difference between the two measures (i.e., bias). The two horizontal dashed lines represent the limits of agreement (1.96 x standard deviation of the mean difference between the lactate threshold and the maximal lactate steady state). The dotted diagonal lines represent the boundaries of the 95% CI for MLSS reliability (CV = 3.0%; 95%; CI = 3.8%) calculated from Hauser et al., 2014) (log = Modified Dmax method using the log-log method as the point of the initial lactate point; exp = Modified Dmax method calculated using a constant plus exponential regression equation; OBLA = onset of blood lactate accumulation.).
Fig 7
Fig 7
(A-B) Bland-Altman plots displaying agreement between measures of the power associated with the (A) OBLA 3.0 mmol.L-1, (B) OBLA 3.5 mmol.L-1 calculated from GXT10 and the MLSS. The differences between measures (y-axis) are plotted as a function of the mean of the two measures (x-axis) in power (Watts). The horizontal solid line represents the mean difference between the two measures (i.e., bias). The two horizontal dashed lines represent the limits of agreement (1.96 x standard deviation of the mean difference between the lactate threshold and the maximal lactate steady state). The dotted diagonal lines represent the boundaries of the 95% CI for MLSS reliability (CV = 3.0%; 95%; CI = 3.8%) calculated from Hauser et al., 2014) (OBLA = onset of blood lactate accumulation.).

References

    1. Skinner JS, McLellan TH. The transition from aerobic to anaerobic metabolism. Research Quarterly for Exercise and Sport. 1980;51(1):234–48. 10.1080/02701367.1980.10609285 - DOI - PubMed
    1. Londeree BR. Effect of training on lactate/ventilatory thresholds: a meta-analysis. Medicine and Science in Sport and Exercise. 1997;29(6):837–43. - PubMed
    1. Wenger HA, Bell GJ. The interactions of intensity, frequency and duration of exercise training in altering cardiorespiratory fitness. Sports Medicine. 1986;3(5):346–56. - PubMed
    1. Mann T, Lamberts RP, Lambert MI. Methods of prescribing relative exercise intensity: physiological and practical considerations. Sports Medicine. 2013;43(7):613–25. 10.1007/s40279-013-0045-x - DOI - PubMed
    1. Coen B, Schwarz L, Urhausen A, Kindermann W. Control of training in middle-and long-distance running by means of the individual anaerobic threshold. International Journal of Sports Medicine. 1991;12(06):519–24. - PubMed

Publication types