. 2018 Dec:183:698-715.
doi: 10.1016/j.neuroimage.2018.07.056. Epub 2018 Jul 27.

Hierarchical multiscale Bayesian algorithm for robust MEG/EEG source reconstruction

Affiliations

Hierarchical multiscale Bayesian algorithm for robust MEG/EEG source reconstruction

Chang Cai et al. Neuroimage. 2018 Dec.

Abstract

In this paper, we present a novel hierarchical multiscale Bayesian algorithm for electromagnetic brain imaging using magnetoencephalography (MEG) and electroencephalography (EEG). In particular, we present a solution to the source reconstruction problem for sources that vary in spatial extent. We define sensor data measurements using a generative probabilistic graphical model that is hierarchical across spatial scales of brain regions and voxels. We then derive a novel Bayesian algorithm for probabilistic inference with this graphical model. This algorithm enables robust reconstruction of sources that have different spatial extent, from spatially contiguous clusters of dipoles to isolated dipolar sources. We compare the new algorithm with several representative benchmarks on both simulated and real brain activities. The source locations and the correct estimation of source time courses used for the simulated data are chosen to test the performance on challenging source configurations. In simulations, performance of the novel algorithm shows superiority to several existing benchmark algorithms. We also demonstrate that the new algorithm is more robust to correlated brain activity present in real MEG and EEG data and is able to resolve distinct and functionally relevant brain areas with real MEG and EEG datasets.

Keywords: Bayesian; Brain mapping; Electroencephalography; Magnetoencephalography.


Figures

Figure 1:
Figure 1:
Graphical models for (a) BMN, (b) Champagne, (c) Tree_Champagne. Variables dependent on time are inside dotted box; Variables independent of time are outside botted box. Variables in circles are unknown and learned from the model, and Variables in squares are known. N is the number of voxels, si denotes the ith voxel time course, si,j is the jth voxel’s time course in ith region
Figure 2:
Figure 2:
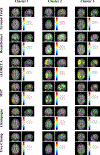
Example of the localization results for simulated MEG data with 3 clusters at SNIR=10. The activity power is normalized by the lead-field value at each voxel. The ground truth is shown for comparison.
Figure 3:
Figure 3:
Example of the localization results for simulated MEG data with 3 regions active at 10 dB. The activity power is normalized by the lead-field value at each voxel. The ground truth is shown for comparison.
Figure 4:
Figure 4:
Example of the Aggregate Performance metric calculation with increasing correlation in clusters from 0.1 to 1 at 10 dB for 50 simulations: (A) Averaged Hit Rate for all algorithms; (B) Averaged False Rate for all algorithms; (C) Averaged correlations for all hit sources; (D) Averaged Aggregate Performance scores for all algorithms.
Figure 5:
Figure 5:
Simulation results of Aggregate Performance with four different configurations at 10 dB and 0 dB: (A) and (B) show results for increasing dipoles time courses correlation from the same cluster; (C) and (D) show results for increasing correlation between clusters; (E) and (F) show results for increasing the number of clusters; (G) and (H) show results for variations in the sizes of the clusters.
Figure 6:
Figure 6:
Aggregate Performance with three different configurations: (A) and (B) show results for increasing the brain’s regions at 10 dB and 0 dB; (C) and (D) show the performance of all algorithms with fixed 5 dipoles while increasing the number of clusters at 10 dB and 0 dB; (E) and (F) show results with fixed 5 clusters but increasing the number of dipoles at 10 dB and 0 dB.
Figure 7:
Figure 7:
Example of the localization results for 2 clusters and 2 dipoles at SNIR = 10 dB. The activity power is normalized by the lead-field value at each voxel. The ground truth is shown for comparison.
Figure 8:
Figure 8:
EEG simulation results of the A Prime Metric (left column) and Aggregate Performance (right column) with three different configurations at 10 dB: (A) and (B) show results for increasing number of clusters; (C) and (D) show results with fixed 5 clusters and increasing the number of dipoles; (E) and (F) show results with fixed 5 dipoles while increasing the number of clusters.
Figure 9:
Figure 9:
Averaged Radius of Clusters with EEG simulations for Champagne, tree_Champagne. The Ground Truth is shown for comparison.
Figure 10:
Figure 10:
Sensory Evoked Field localization results. The activity power is normalized by the lead-field value at each voxel. All six algorithms localize to somatosensory cortical areas, where Champagne and tree_Champagne are the most focal. BMN sLORETA also performs well on the localization. Here we set the threshold for tree_Champagne and Champagne much lower than other benchmarks.
Figure 11:
Figure 11:
Auditory Evoked Field results for three subjects. The activity power is normalized by the lead-field value at each voxel. The results from both Champagne and tree_Champagne are shown in the last two columns, which outperform the other benchmark algorithms shown in the first to three columns.
Figure 12:
Figure 12:
Audio-Visual data localization results from tree_Champagne. The activity power is normalized by the lead-field value at each voxel. Tree_Champagne is able to localize a bilateral auditory response at 100 ms after the simultaneous presentation of tones and a visual stimulus. For bilateral auditory activity, the results of locations and time courses are shown in (A), (B). Tree Champagne can localize an early visual response at 150 ms after the simultaneous presentation of tones and visual stimulus shown in (C) and (D).
Figure 13:
Figure 13:
Face-processing task (MEG) localization results for tree_Champagne. The activity power is normalized by the lead-field value at each voxel. Tree Champagne can localize an early visual response around 100 ms after the presentation of a face stimulus, results with time courses shown in subplot (A). A later visual response around 200 ms after the presentation of a face stimulus are shown in subplot (B). The novel algorithm can localize the bilateral activation in fusiform gyrus that is thought to be in FFA, shown in (C) and (D). The peak for the brain activity is around 170 ms after the presentation of a face stimulus, and the time courses are shown next to brain activity figures in subplots (C) and (D).
Figure 14:
Figure 14:
Results for face processing (EEG) from novel algorithm and benchmarks. The first row is the average power mapping from 0 ms to 400 ms, the second and third rows are for peak power activity at 100 ms and 170 ms separately. Thresholds is 1% of the maximum activation of the image for tree_Chamapgne and 10% of the maximum activation of the image for benchmarks. The activity power is normalized by the lead-field value at each voxel.
Figure 15:
Figure 15:
Epilepsy Spikes results for 7 subjects. The results of best time point dipole fitting are shown in the left-most column, the results of benchmarks are shown from second to forth columns, the novel algorithm’s results are shown in the last column. The activity power is normalized by the lead-field value at each voxel.

References

    1. Sekihara K and Nagarajan SS. Adaptive spatial filters for electromagnetic brain imaging. Springer-Verlag, Berlin, Heidelber, 2008.
    1. Sekihara Kensuke and Nagarajan Srikatan S. Electromagnetic brain imaging: A Bayesian perspective. Springer-Verlag, Berlin, Heidelber, 2015.
    1. Wu Wei, Nagarajan Srikantan, and Chen Zhe. Bayesian machine learning: EEG/MEG signal processing measurements. IEEE Signal Processing Magazine, 33(1):14–36, 2016.
    1. Wipf David and Nagarajan Srikantan. A unified bayesian framework for MEG/EEG source imaging. NeuroImage, 44(3):947–966, 2009. - PMC - PubMed
    1. H¨am¨al¨ainen MS and Ilmoniemi RJ. Interpreting measured magnetic fields of the brain: Estimates of current distributions Technical Report TKK-F-A559, Helsinki University of Technology, 1984.

Publication types