

Integrating genetic and protein-protein interaction networks maps a functional wiring diagram of a cell
- PMID: 30059827
- PMCID: PMC6295359
- DOI: 10.1016/j.mib.2018.06.004
Integrating genetic and protein-protein interaction networks maps a functional wiring diagram of a cell
Abstract
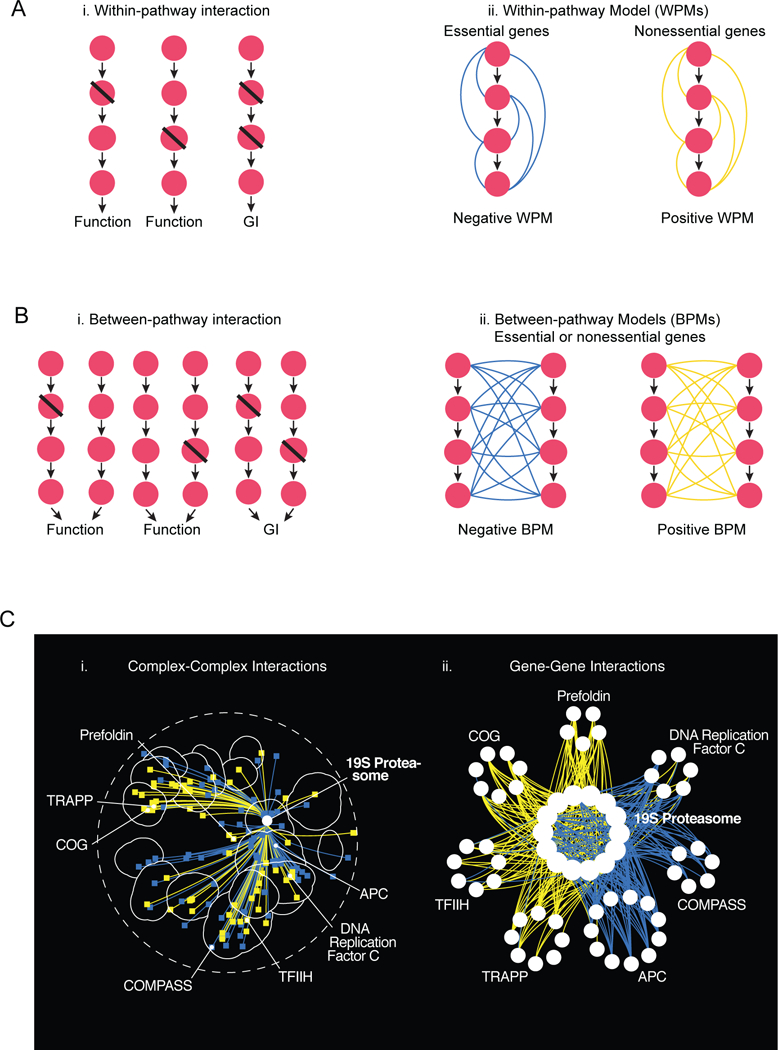
Systematic experimental approaches have led to construction of comprehensive genetic and protein-protein interaction networks for the budding yeast, Saccharomyces cerevisiae. Genetic interactions capture functional relationships between genes using phenotypic readouts, while protein-protein interactions identify physical connections between gene products. These complementary, and largely non-overlapping, networks provide a global view of the functional architecture of a cell, revealing general organizing principles, many of which appear to be evolutionarily conserved. Here, we focus on insights derived from the integration of large-scale genetic and protein-protein interaction networks, highlighting principles that apply to both unicellular and more complex systems, including human cells. Network integration reveals fundamental connections involving key functional modules of eukaryotic cells, defining a core network of cellular function, which could be elaborated to explore cell-type specificity in metazoans.
Copyright © 2018. Published by Elsevier Ltd.
Figures
Similar articles
-
A global genetic interaction network maps a wiring diagram of cellular function.Science. 2016 Sep 23;353(6306):aaf1420. doi: 10.1126/science.aaf1420. Science. 2016. PMID: 27708008 Free PMC article.
-
Computational Analysis of the Chaperone Interaction Networks.Methods Mol Biol. 2018;1709:275-291. doi: 10.1007/978-1-4939-7477-1_20. Methods Mol Biol. 2018. PMID: 29177666
-
From E-MAPs to module maps: dissecting quantitative genetic interactions using physical interactions.Mol Syst Biol. 2008;4:209. doi: 10.1038/msb.2008.42. Epub 2008 Jul 15. Mol Syst Biol. 2008. PMID: 18628749 Free PMC article.
-
Exploring genetic interactions and networks with yeast.Nat Rev Genet. 2007 Jun;8(6):437-49. doi: 10.1038/nrg2085. Nat Rev Genet. 2007. PMID: 17510664 Review.
-
Interaction networks: lessons from large-scale studies in yeast.Proteomics. 2009 Oct;9(20):4799-811. doi: 10.1002/pmic.200900177. Proteomics. 2009. PMID: 19743423 Review.
Cited by
-
Truncating the spliceosomal 'rope protein' Prp45 results in Htz1 dependent phenotypes.RNA Biol. 2024 Jan;21(1):1-17. doi: 10.1080/15476286.2024.2348896. Epub 2024 May 6. RNA Biol. 2024. PMID: 38711165 Free PMC article.
-
Functional network motifs defined through integration of protein-protein and genetic interactions.PeerJ. 2022 Feb 22;10:e13016. doi: 10.7717/peerj.13016. eCollection 2022. PeerJ. 2022. PMID: 35223214 Free PMC article.
-
A Multipronged Unbiased Strategy Guides the Development of an Anti-EGFR/EPHA2-Bispecific Antibody for Combination Cancer Therapy.Clin Cancer Res. 2023 Jul 14;29(14):2686-2701. doi: 10.1158/1078-0432.CCR-22-2535. Clin Cancer Res. 2023. PMID: 36976175 Free PMC article.
-
In Silico Analysis of Protein-Protein Interactions of Putative Endoplasmic Reticulum Metallopeptidase 1 in Schizosaccharomyces pombe.Curr Issues Mol Biol. 2024 May 12;46(5):4609-4629. doi: 10.3390/cimb46050280. Curr Issues Mol Biol. 2024. PMID: 38785548 Free PMC article.
-
Identifying Hepatocellular Carcinoma Driver Genes by Integrative Pathway Crosstalk and Protein Interaction Network.DNA Cell Biol. 2019 Oct;38(10):1112-1124. doi: 10.1089/dna.2019.4869. Epub 2019 Aug 29. DNA Cell Biol. 2019. PMID: 31464520 Free PMC article.
References
-
-
Forsberg SK, Bloom JS, Sadhu MJ, Kruglyak L, Carlborg O: Accounting for genetic interactions improves modeling of individual quantitative trait phenotypes in yeast. Nat Genet 2017, 49:497–503.
*This study shows that genetic interactions contribute to many quantitative traits in yeast.
-
-
- Baryshnikova A, Costanzo M, Myers CL, Andrews B, Boone C: Genetic interaction networks: toward an understanding of heritability. Annu Rev Genomics Hum Genet 2013, 14:111–133. - PubMed
-
- Butland G, Babu M, Diaz-Mejia JJ, Bohdana F, Phanse S, Gold B, Yang W, Li J, Gagarinova AG, Pogoutse O, et al.: eSGA: E. coli synthetic genetic array analysis. Nat Methods 2008, 5:789–795. - PubMed
Publication types
MeSH terms
Substances
Grants and funding
LinkOut - more resources
Full Text Sources
Other Literature Sources
Molecular Biology Databases
