. 2018 Oct 1;28(10):3673-3684.
doi: 10.1093/cercor/bhy159.

A Quantitative Study on the Distribution of Mitochondria in the Neuropil of the Juvenile Rat Somatosensory Cortex

Affiliations

A Quantitative Study on the Distribution of Mitochondria in the Neuropil of the Juvenile Rat Somatosensory Cortex

A Santuy et al. Cereb Cortex. .

Abstract

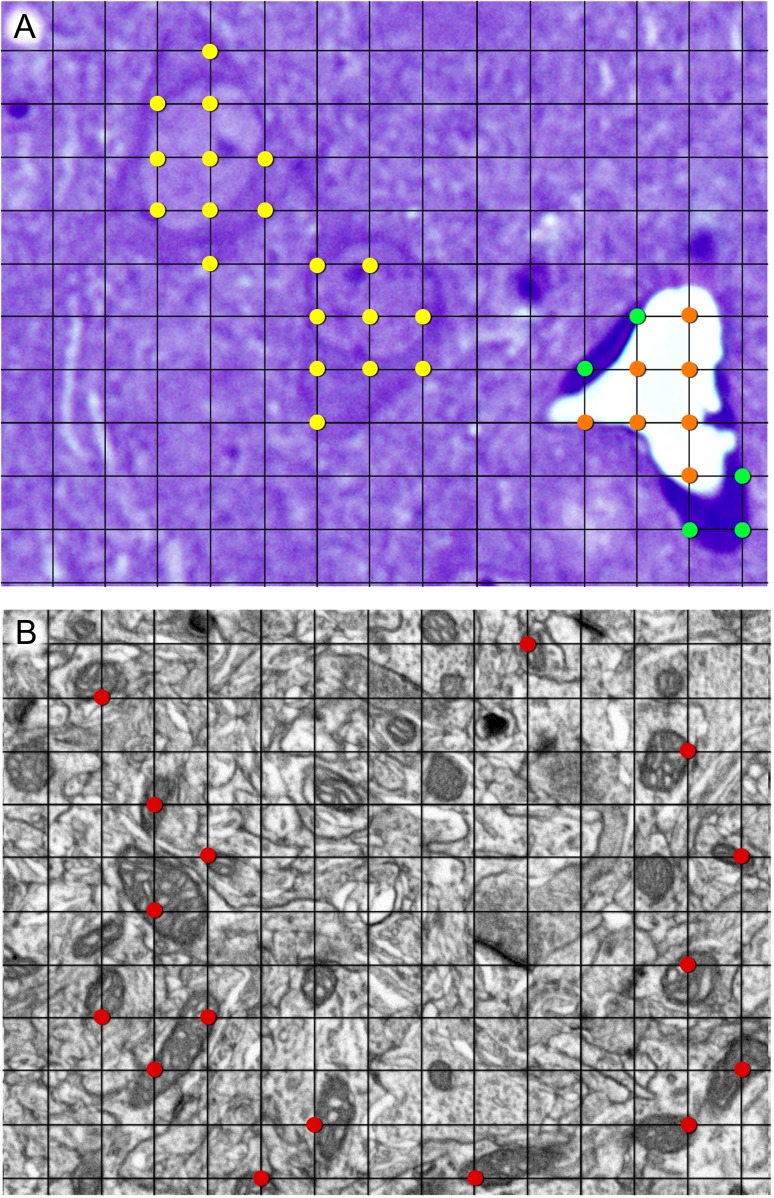
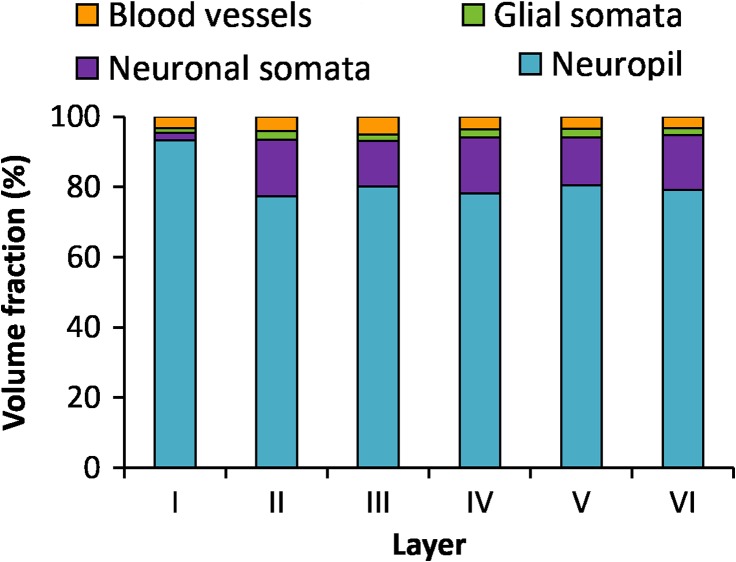
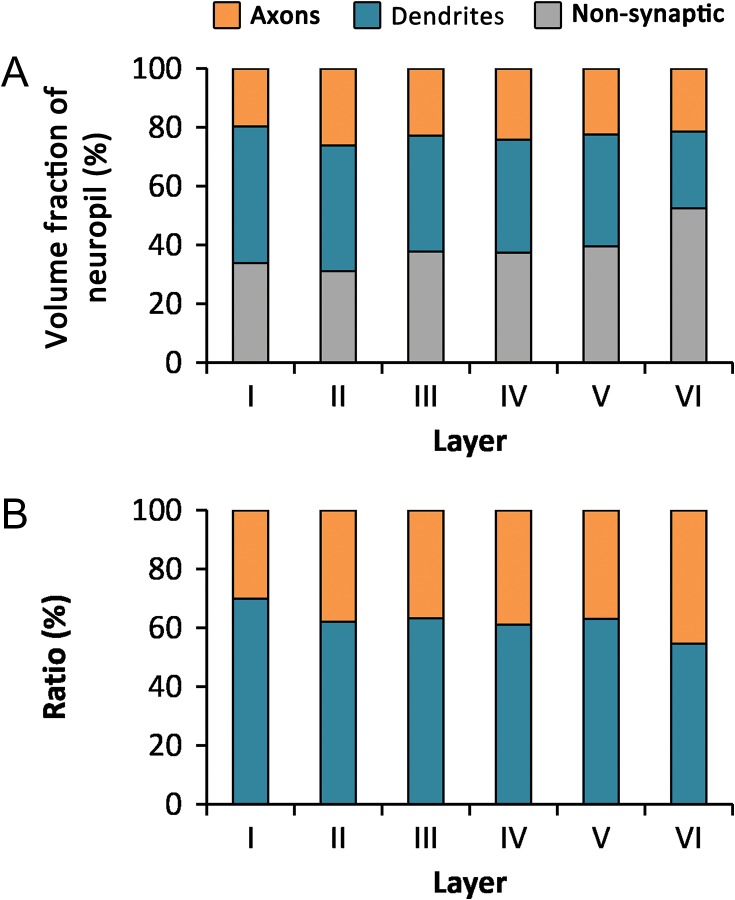
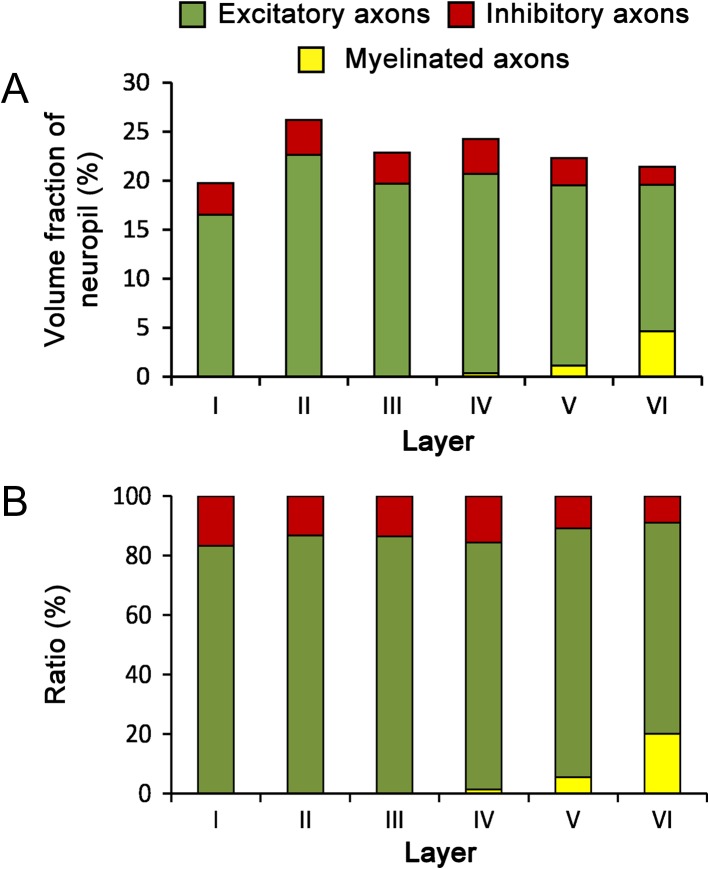
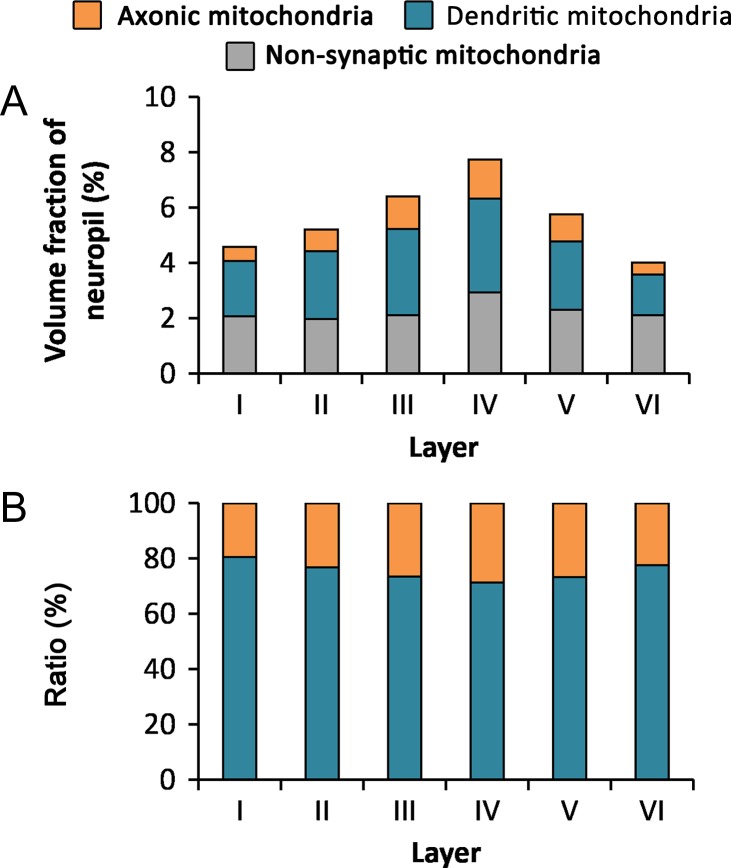
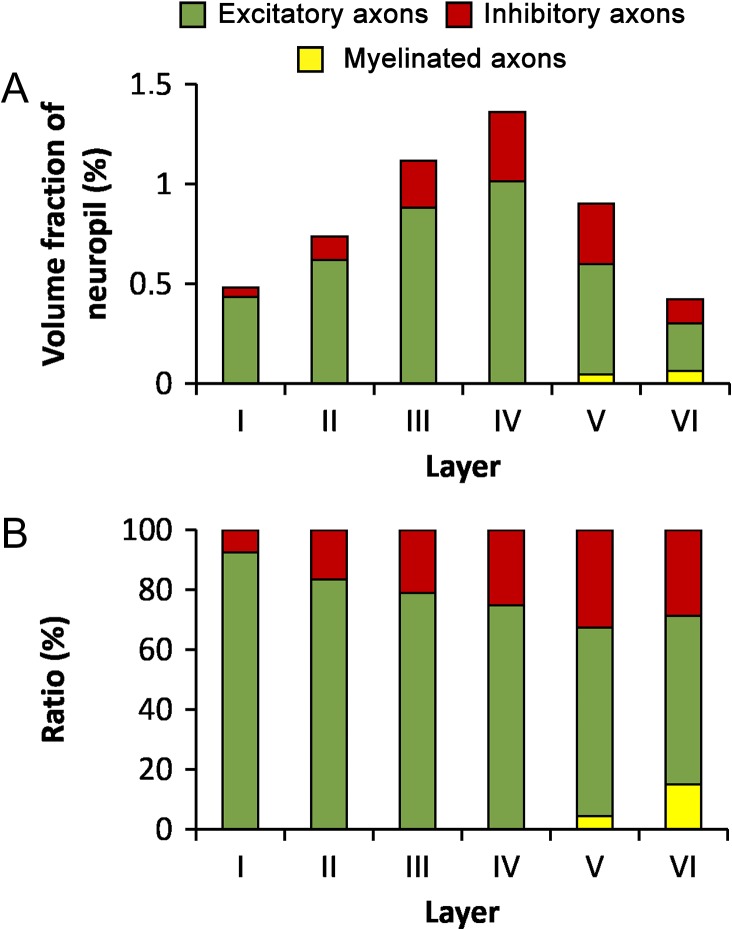
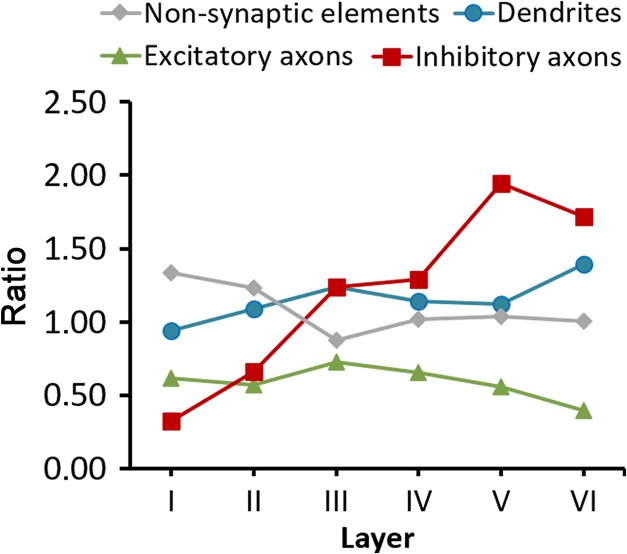
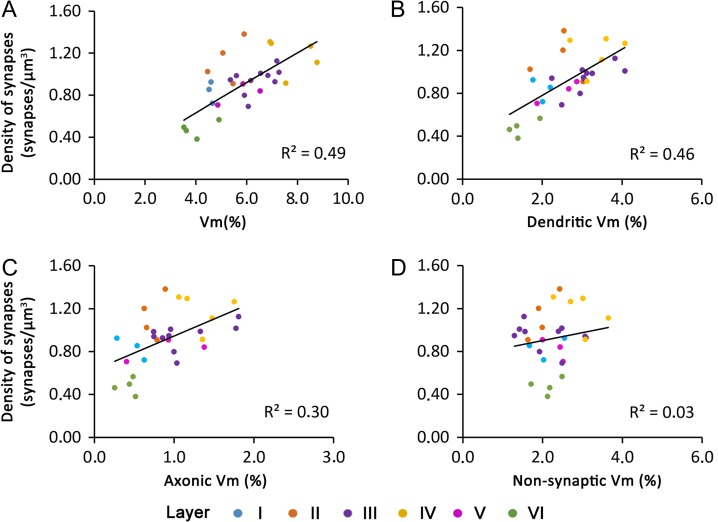
Mitochondria play a key role in energy production and calcium buffering, among many other functions. They provide most of the energy required by neurons, and they are transported along axons and dendrites to the regions of higher energy demands. We have used focused ion beam milling and scanning electron microscopy (FIB/SEM) to obtain stacks of serial sections from the somatosensory cortex of the juvenile rat. We have estimated the volume fraction occupied by mitochondria and their distribution between dendritic, axonal, and nonsynaptic processes. The volume fraction of mitochondria increased from layer I (4.59%) to reach its maximum in layer IV (7.74%) and decreased to its minimum in layer VI (4.03%). On average, 44% of mitochondrial volume was located in dendrites, 15% in axons and 41% in nonsynaptic elements. Given that dendrites, axons, and nonsynaptic elements occupied 38%, 23%, and 39% of the neuropil, respectively, it can be concluded that dendrites are proportionally richer in mitochondria with respect to axons, supporting the notion that most energy consumption takes place at the postsynaptic side. We also found a positive correlation between the volume fraction of mitochondria located in neuronal processes and the density of synapses.


Figures

Figure 1.
Figure 1.
Stereological grids used for the estimation of the volume fraction of different compartments at the light (A) and electron microscopic (B) levels, using the Cavalieri method. (A) Example of the estimation of the volume fraction of neuropil, cell somata, and blood vessels at the light microscopic level. Points hitting cell somata, blood vessel lumen, and blood vessel endothelium have been highlighted in yellow, orange, and green, respectively. The remaining points hit the neuropil, although they have not been highlighted for the sake of clarity. (B) Example of one stereological grid used for the estimation of the volume fraction of mitochondria at the electron microscopic level. Points hitting mitochondria have been highlighted in red. The ratio of grid points hitting any compartment to points hitting the reference area is proportional to the volume fraction occupied by that compartment (see Materials and Methods for details). The thickness of grid lines and the size of marked points have been exaggerated for clarity. Grid size is 4 × 4 μm2 in (A) and 500 × 500 nm2 in (B).
Figure 2.
Figure 2.
An example of the use of a semithin section to locate the region of interest. (A) Semithin section of the somatosensory cortex stained with toluidine blue and photographed with an optical microscope. This section is immediately adjacent to the block face that was later photographed with the SEM. Cortical layers (I–VI) and white matter (WM) can be identified. Blood vessel profiles can be used as reference points to locate the region of interest. In this particular example, a vascular profile (arrow) is located approximately in the boundary between layers I and II. (B) Low power electron micrograph acquired with the SEM from the block surface. The same vascular profile that was previously identified in the semithin section is also visible on the block face (arrow). (C) The same block after a series of images has been acquired with the FIB/SEM. The reference blood vessel (arrow) was used to locate layer I. First, a large trench (asterisk) was excavated with the FIB in order to have visual access to the tissue below the block surface. Then, a smaller trench (arrow head) was sequentially milled with the FIB and photographed with the SEM at intervals of 20 nm, thus obtaining a series of images. A similar procedure was used to locate the regions of interest in all other cortical layers. Scale bar = 300, 150, and 80 μm in (A), (B), and (C), respectively. See also Supplementary Video 1.
Figure 3.
Figure 3.
Volume fraction of neuropil, cell somata, and blood vessels in the 6 layers of the cortex. Volume fraction of neuropil (blue), neuronal somata (purple), glial somata (green), blood vessels (lumen and endothelium, orange) in the 6 layers of the cortex.
Figure 4.
Figure 4.
Electron micrographs of the neocortical neuropil obtained by FIB/SEM. These examples belong to 2 series of images that were acquired from layer III (A) and layer VI (B). Mitochondria of different sizes and shapes are scattered throughout the field of view. Synapses are also visible; some of them have been pointed by arrow heads. A myelinated axon (ma) appears in the image corresponding to layer VI. In this particular example, the myelinated axonal segment does not contain any mitochondria. Scale bar = 1 μm. See also Supplementary Video 1.
Figure 5.
Figure 5.
Volume fraction of axons, dendrites, and nonsynaptic elements in the neuropil. (A) Volume fraction of axons (orange), dendrites (blue), and nonsynaptic elements (gray) in the neuropil of the 6 layers of the cortex. (B) Ratio between the axonal (orange) and dendritic (blue) compartments in the neuropil.
Figure 6.
Figure 6.
Volume fraction of excitatory and inhibitory axons. (A) Volume fraction of excitatory (green), inhibitory (red), and myelinated axons (yellow) in the neuropil of the 6 cortical layers. (B) Ratio between the volumes of excitatory, inhibitory, and myelinated axons in the neuropil of the 6 cortical layers.
Figure 7.
Figure 7.
Volume fraction of mitochondria located in axons, dendrites, and nonsynaptic elements in the neuropil. (A) Volume fraction of mitochondria located in axons (orange), dendrites (blue), and nonsynaptic elements (gray) in the 6 layers of the cortex. (B) Ratio between mitochondrial volume located in axonal (orange) and dendritic (blue) elements in the 6 layers of the cortex. See also Table 3.
Figure 8.
Figure 8.
Volume fraction of mitochondria located in axons. (A) Volume fraction of mitochondria located in excitatory (green), inhibitory (red), and myelinated (yellow) axons in the 6 cortical layers. (B) Ratio between the volumes of mitochondria located in excitatory, inhibitory and myelinated axons in the neuropil of the 6 cortical layers. See also Table 3.
Figure 9.
Figure 9.
Ratios between the proportion of mitochondria located in different subcellular compartments, and the proportions of these compartments in the neuropil. Ratios have been calculated for the 6 cortical layers from data shown in Tables 2 and 3. A value of 1.00 would indicate that the proportion of mitochondria located in this compartment corresponds to the proportion of this compartment in the neuropil. Values over or under 1.00 indicate that mitochondria are relatively more or less abundant in that compartment, respectively.
Figure 10.
Figure 10.
Correlation between the density of synapses and the volume fraction of mitochondria located in different subcellular compartments. Correlation between the density of synapses in the neuropil and the volume fraction of mitochondria (Vm) (A), the volume fraction of mitochondria located in dendrites (B), the volume fraction of mitochondria located in axons (C), and the volume fraction of mitochondria located in nonsynaptic elements (D). Data from the 6 cortical layers have been color-coded according to the legend in A.

Similar articles

Cited by

References

    1. Alonso-Nanclares L, Gonzalez-Soriano J, Rodriguez JR, DeFelipe J. 2008. Gender differences in human cortical synaptic density. Proc Natl Acad Sci USA. 105:14615–14619. - PMC - PubMed
    1. Anderson JC, Kevan ACM, Picanco-Diniz CW. 1992. The neurons in layer 1 of cat visual cortex. Proc Biol Sci. 248:27–33. - PubMed
    1. Anton-Sanchez L, Bielza C, Merchan-Perez A, Rodriguez JR, DeFelipe J, Larranaga P. 2014. Three-dimensional distribution of cortical synapses: a replicated point pattern-based analysis. Front Neuroanat. 8:85. - PMC - PubMed
    1. Ascoli GA, Alonso-Nanclares L, Anderson SA, Barrionuevo G, Benavides-Piccione R, Burkhalter A, Buzsaki G, Cauli B, Defelipe J, Fairen A, et al. . 2008. Petilla terminology: nomenclature of features of GABAergic interneurons of the cerebral cortex. Nat Rev Neurosci. 9:557–568. - PMC - PubMed
    1. Attwell D, Laughlin SB. 2001. An energy budget for signaling in the grey matter of the brain. J Cereb Blood Flow Metab. 21:1133–1145. - PubMed

Publication types