. 2019 Mar 5;68(6):984-992.
doi: 10.1093/cid/ciy595.

Immune Responses to Middle East Respiratory Syndrome Coronavirus During the Acute and Convalescent Phases of Human Infection

Affiliations

Immune Responses to Middle East Respiratory Syndrome Coronavirus During the Acute and Convalescent Phases of Human Infection

Hyoung-Shik Shin et al. Clin Infect Dis. .

Abstract

Background: An understanding of immune responses against the Middle East respiratory syndrome (MERS) is important for the development of treatments and preventive measures. Here, we investigated the spectrum of immune responses occurring in patients with MERS during the early period of infection.

Methods: We obtained peripheral blood samples from 27 hospitalized patients recruited during the epidemic that occurred in 2015 in South Korea. Plasma cytokines/chemokines and antibodies were quantified. Virus-specific T cells were examined by intracellular cytokine staining after stimulation of peripheral blood mononuclear cells with overlapping peptides spanning whole virus structural proteins.

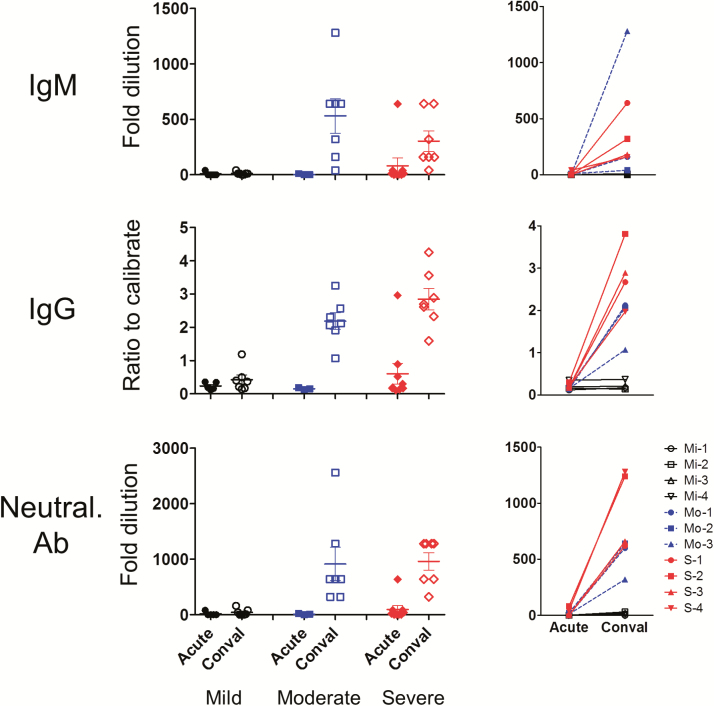
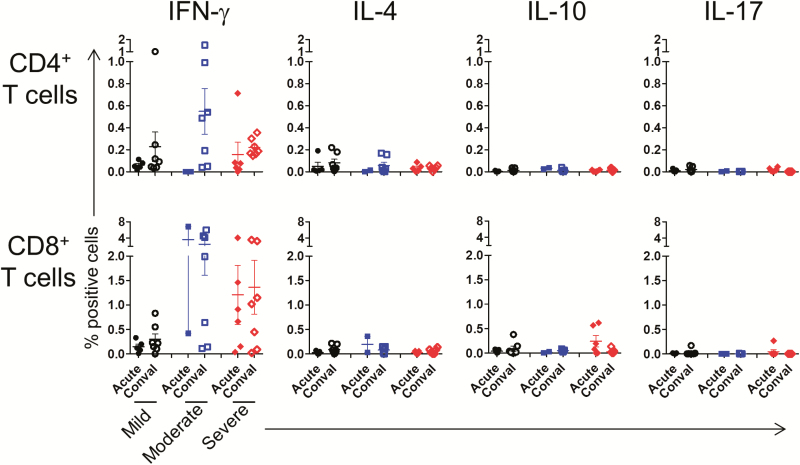
Results: At the acute phase of infection, elevated levels of plasma proinflammatory cytokines/chemokines were detected in proportion to the severity of the disease. Distinctively high frequencies of MERS coronavirus-reactive CD8+ T cells were also observed in patients with severe/moderate illness, whereas antibody and CD4+ T-cell responses were minimally detected at this stage. At the convalescent phase, disease severity-dependent antibody responses emerged and antigen-reactive cells were identified in both T-cell subsets. These T cells belonged to the T-helper 1 or type 1 cytotoxic T cell subtypes. While CD8+ T cells responded preferentially to the viral S protein compared with E/M/N proteins, especially at the acute stage, slightly more CD4+ T cells recognized E/M/N proteins compared with S protein at the convalescent phase.

Conclusions: Our findings show an association between the early CD8+ T-cell response and the severity of the infection, and also provide basic information that may help to prepare effective control strategies for MERS in humans.

Keywords: MERS coronavirus; T lymphocytes; acute phase of infection; immune response.


Figures

Figure 1.
Figure 1.
Plasma cytokine/chemokine levels of patients at the acute and convalescent phases of Middle East respiratory syndrome coronavirus infection. Interferon α was measured by enzyme-linked immunosorbent assay, and the others by cytometric bead arrays. Each dot represents an individual patient and the lines indicate paired samples from the same patient. Abbreviations: Conval, convalescent; IFN, interferon; IL, interleukin; IP, interferon gamma-induced protein; MCP, monocyte chemoattractant protein; MIP, macrophage inflammatory protein; RANTES, regulated on activation, normal T cell expressed and secreted; TNF, tumor necrosis factor.
Figure 2.
Figure 2.
Middle East respiratory syndrome coronavirus (MERS-CoV)–specific antibody responses in patients at the acute and convalescent phases of infection. The magnitude of MERS-CoV–specific immunoglobulin M (IgM), immunoglobulin G (IgG), and neutralizing antibody responses was measured in patient plasma samples collected at the acute and convalescent phases of infection by immunofluorescence assay, enzyme-linked immunosorbent assay, and pseudotype retrovirus-based neutralization assay, respectively. Fold dilutions ≥10 for IgM and neutralizing Ab, and ratio to calibrate ≥1.1 for IgG were considered to be positive. Each dot shown in the graphs at left represents an individual patient and the lines in the graphs at right indicate paired samples from the same patient. Abbreviations: Conval, convalescent; Mi, mild; Mo, moderate; Neutral. Ab, neutralizing antibody; S, severe.
Figure 3.
Figure 3.
T-cell responses to Middle East respiratory syndrome coronavirus (MERS-CoV) structural protein antigens in patients at the acute and convalescent phases of infection. Peripheral blood mononuclear cells from patients were stimulated with MERS-CoV structural protein-peptide pools, and virus-reactive T cells were examined by intracellular cytokine staining. A, Staining profiles of T cells from a representative patient (at the acute stage of infection) and a healthy donor. B, Frequency of interferon γ–producing T cells in response to 3 pools of viral peptides. C, Summary of T-cell responses producing T-helper 1– or type 1 cytotoxic T cell–type cytokines and molecules against all 3 peptide pools. Each dot represents an individual patient and the lines indicate paired samples from the same patient. Abbreviations: Conval, convalescent; IFN, interferon; IL, interleukin; MERS, Middle East respiratory syndrome; TNF, tumor necrosis factor.
Figure 4.
Figure 4.
Frequency of various functional T-cell subsets responding to Middle East respiratory syndrome coronavirus (MERS-CoV) antigens in patients with MERS-CoV. Peripheral blood mononuclear cells from patients were stimulated with MERS-CoV structural protein-peptide pools, and the frequency of T cells secreting interferon γ, interleukin 4, interleukin 10, or interleukin 17 was measured by intracellular cytokine staining. Each dot represents an individual patient. Abbreviations: Conval, convalescent; IFN, interferon; IL, interleukin.
Figure 5.
Figure 5.
Reactivity of T cells to different viral proteins in individual patients. Lines indicate the paired frequencies of interferon γ–producing T cells responding to the S1 or S2 pool of peptides and the E/M/N peptide pool in individual patients. The 2-tailed Wilcoxon signed-rank test was used to compare the paired samples.
Figure 6.
Figure 6.
Correlation between T cells and antibody responses. Plasma immunoglobulin G titers and the frequencies of interferon γ–producing CD4+ and CD8+ T cells in the same patients were plotted. Spearman rank correlation coefficient, the corresponding P value, and the line of best fit are shown. Abbreviation: IgG, immunoglobulin G.

References

    1. Fehr AR, Channappanavar R, Perlman S. Middle East respiratory syndrome: emergence of a pathogenic human coronavirus. Annu Rev Med 2017; 68:387–99. - PMC - PubMed
    1. Zumla A, Hui DS, Perlman S. Middle East respiratory syndrome. Lancet 2015; 386:995–1007. - PMC - PubMed
    1. Park WB, Perera RA, Choe PG, et al. . Kinetics of serologic responses to MERS coronavirus infection in humans, South Korea. Emerg Infect Dis 2015; 21:2186–9. - PMC - PubMed
    1. Corman VM, Albarrak AM, Omrani AS, et al. . Viral shedding and antibody response in 37 patients with Middle East respiratory syndrome coronavirus infection. Clin Infect Dis 2016; 62:477–83. - PMC - PubMed
    1. Faure E, Poissy J, Goffard A, et al. . Distinct immune response in two MERS-CoV-infected patients: can we go from bench to bedside?PLoS One 2014; 9:e88716. - PMC - PubMed

Publication types