. 2018 Jul 29;19(8):2215.
doi: 10.3390/ijms19082215.

Novel Neohesperidin Dihydrochalcone Analogue Inhibits Adipogenic Differentiation of Human Adipose-Derived Stem Cells through the Nrf2 Pathway

Affiliations

Novel Neohesperidin Dihydrochalcone Analogue Inhibits Adipogenic Differentiation of Human Adipose-Derived Stem Cells through the Nrf2 Pathway

Ga Eun Han et al. Int J Mol Sci. .

Abstract

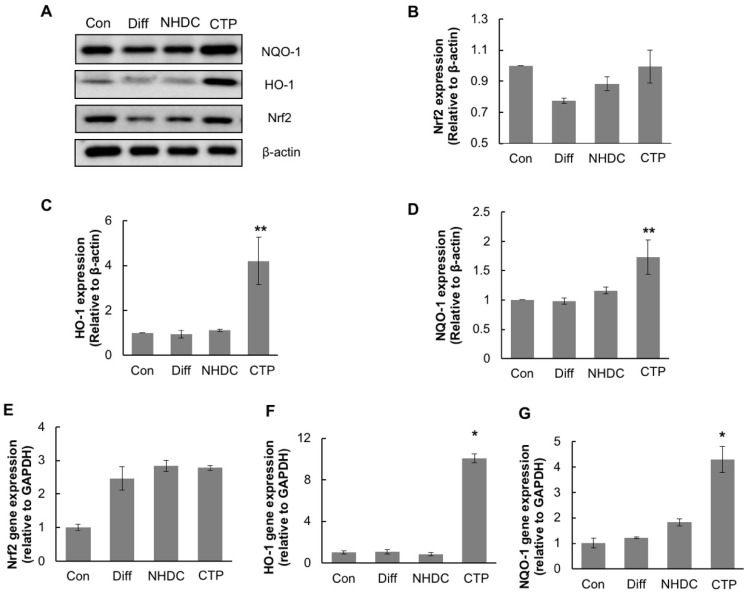
Obesity, characterized by excess lipid accumulation, has emerged as a leading public health problem. Excessive, adipocyte-induced lipid accumulation raises the risk of metabolic disorders. Adipose-derived stem cells (ASCs) are mesenchymal stem cells (MSCs) that can be obtained from abundant adipose tissue. High fat mass could be caused by an increase in the size (hypertrophy) and number (hyperplasia) of adipocytes. Reactive oxygen species (ROS) are involved in the adipogenic differentiation of human adipose-derived stem cells (hASCs). Lowering the level of ROS is important to blocking or retarding the adipogenic differentiation of hASCs. Nuclear factor erythroid 2-related factor-2 (Nrf2) is a transcription factor that mediates various antioxidant enzymes and regulates cellular ROS levels. Neohesperidin dihydrochalcone (NHDC), widely used as artificial sweetener, has been shown to have significant free radical scavenging activity. In the present study, (E)-3-(4-chlorophenyl)-1-(2,4,6-trimethoxyphenyl)prop-2-en-1-one (CTP), a novel NHDC analogue, was synthesized and examined to determine whether it could inhibit adipogenic differentiation. The inhibition of adipogenic differentiation in hASCs was tested using NHDC and CTP. In the CTP group, reduced Oil Red O staining was observed compared with the differentiation group. CTP treatment also downregulated the expression of PPAR-γ and C/EBP-α, adipogenic differentiation markers in hASCs, compared to the adipogenic differentiation group. The expression of FAS and SREBP-1 decreased in the CTP group, along with the fluorescent intensity (amount) of ROS. Expression of the Nrf2 protein was slightly decreased in the differentiation group. Meanwhile, in both the NHDC and CTP groups, Nrf2 expression was restored to the level of the control group. Moreover, the expression of HO-1 and NQO-1 increased significantly in the CTP group. Taken together, these results suggest that CTP treatment suppresses the adipogenic differentiation of hASCs by decreasing intracellular ROS, possibly through activation of the Nrf2 cytoprotective pathway. Thus, the use of bioactive substances such as CTP, which activates Nrf2 to reduce the cellular level of ROS and inhibit the adipogenic differentiation of hASCs, could be a new strategy for overcoming obesity.

Keywords: Nrf2; adipogenic differentiation; adipose stem cells; neohesperidin dihydrochalcone; reactive oxygen species.


Conflict of interest statement

The authors declare no conflicts of interest.

Figures

Figure 1
Figure 1
Structures of (E)-3-(4-chlorophenyl)-1-(2,4,6-trimethoxyphenyl)prop-2-en-1-one (CTP) (A) and neohesperidin dihydrochalcone (NHDC) aglycone (B) and a synthetic scheme of CTP (C).
Figure 2
Figure 2
Viability of human adipose-derived stem cells (hASC) in the presence of NHDC and its analogue. Human adipose-derived stem cells (hASCs) were seeded onto a 96-well plate, and the cells were treated with different concentrations (5, 10, 20, and 40 μM) of NHDC and CTP for 5 days. The cell viability was measured by MTS assay. The results are expressed as the mean values ± SD (n = 3); * p < 0.01, ** p < 0.05 as compared to non-treated group (0 μM).
Figure 3
Figure 3
Effect of NHDC and CTP on adipogenic differentiation. Cells were seeded on 12-well plate and cultured for 14 days with or without differentiation medium and compounds. 14 days after culturing in adipogenic differentiation medium or Differentiated hASCs were stained with Oil Red O as described in Materials and Methods (A). Lipid accumulation was quantified by Oil Red O uptake and the amount of eluted dye was measured at the absorbance of 510 nm (B). Through Western Blotting assay of PPAR-γ and C/EBP-α (C) and its quantification, Bands’ densities were analyzed by using ImageJ software (http://rsbweb.nih.gov/ij) (D). Quantitative RT-PCR results of PPAR-γ and C/EBP-α were evaluated (E). The results are expressed as the mean values ± SD (n = 3); * p < 0.01, ** p < 0.05 as compared to the differentiation group. Con, control group cultured in growth medium only; Diff, differentiation group cultured in adipogenic differentiation medium.
Figure 4
Figure 4
Changes in expression of lipogenic markers over time. The expression of fatty acid synthase (FAS) and SREBP-1, markers for lipogenesis, were measured by Western Blotting at two-time points. To see the lipogenesis in early stage of adipogenic differentiation, hASCs were harvested at 6 days after adipogenic induction. Meanwhile, the lipogenesis in late stage of adipogenic differentiation was investigated at 9 days after adipogenic induction (A). Bands were densitometrically analyzed by using ImageJ software (http://rsbweb.nih.gov/ij) (B,C). The results are expressed as the mean values ± SD (n = 3); ** p < 0.05 as compared to the control group (day1); day 1, hASCs were cultured in growth medium only; day 6 and day 9, hASCs were cultured in adipogenic differentiation medium for 6 or 9 days, respectively.
Figure 5
Figure 5
Effect of NHDC analogue on lipogenesis during the adipogenic differentiation. hASCs were treated with NHDC or its analogue along with the adipogenic differentiation medium for 14 days. Western Blotting was performed against lipogenic markers including FAS and SREBP-1 (A). Densitometric analysis of Western Blotting of FAS (B) and SREBP-1 (C). Bands were densitometric analyzed by using ImageJ software. The results are expressed as the mean values ± SD (n = 3); * p < 0.01, ** p < 0.05 as compared to the differentiation group. Con, control group cultured in growth medium only; Diff, differentiation group cultured in adipogenic differentiation medium.
Figure 6
Figure 6
ROS-mediated adipogenic differentiation in hASCs. hASCs were treated with normal growth medium for 5 days and then treated with adipogenic differentiation medium with NHDC or its analogue for 14 days. Meanwhile, the control group was treated with growth medium for 5 days. Intracellular ROS levels were estimated by flow cytometric analysis of DCF fluorescence after staining cells with DCFH-DA. Flow cytometric distribution of DCFDA stained hASCs. (A). Flow cytometric distribution among all experimental groups was merged to see the cellular ROS level (B). Cell granularity of DCF-fluorescence was evaluated (C). The results are expressed as the mean values ± SD (n = 3); * p < 0.01 as compared to the differentiation group (Diff). Con, control group cultured in growth medium only; Diff, differentiation group cultured in adipogenic differentiation medium.
Figure 7
Figure 7
Activation of Nrf2 pathway by NHDC and CTP in hASCs. hASCs, except the control group, were treated with differentiation medium and NHDC and CTP (4μM). The cells were harvested at 14 days after adipogenic induction to examine the expression of Nrf2 and downstream enzymes. Western Blotting was performed against Nrf2 and its downstream antioxidant enzymes (A). Quantitative values of the protein expression of Nrf2, HO-1, and NQO-1 were calculated by normalization with β-actin (B), (C), and (D) respectively. mRNA levels of Nrf2 and its downstream enzymes using quantitative RT-PCR were evaluated (E), (F), and (G). The results are expressed as the mean ± SD (n = 3); * p < 0.01, ** p < 0.05 as compared to the differentiation group (Diff). Con, control group cultured in growth medium only; Diff, differentiation group cultured in adipogenic differentiation medium.

References

    1. Bianchini F., Kaaks R., Vainio H. Overweight, obesity, and cancer risk. Lancet Oncol. 2002;3:565–574. doi: 10.1016/S1470-2045(02)00849-5. - DOI - PubMed
    1. Janssen I. The public health burden of obesity in canada. Can. J. Diabetes. 2013;37:90–96. doi: 10.1016/j.jcjd.2013.02.059. - DOI - PubMed
    1. Wang Y., Chen X., Song Y., Caballero B., Cheskin L. Association between obesity and kidney disease: A systematic review and meta-analysis. Kidney Int. 2008;73:19–33. doi: 10.1038/sj.ki.5002586. - DOI - PubMed
    1. Flegal K.M., Carroll M.D., Kit B.K., Ogden C.L. Prevalence of obesity and trends in the distribution of body mass index among us adults, 1999–2010. JAMA. 2012;307:491–497. doi: 10.1001/jama.2012.39. - DOI - PubMed
    1. Shin H.-Y., Kang H.-T. Recent trends in the prevalence of underweight, overweight, and obesity in korean adults: The korean national health and nutrition examination survey from 1998 to 2014. J. Epidemiol. 2017;27:413–419. doi: 10.1016/j.je.2016.08.014. - DOI - PMC - PubMed