. 2018 Aug 14;115(33):E7728-E7737.
doi: 10.1073/pnas.1803303115. Epub 2018 Jul 30.

Central role of autophagic UVRAG in melanogenesis and the suntan response

Affiliations

Central role of autophagic UVRAG in melanogenesis and the suntan response

Yongfei Yang et al. Proc Natl Acad Sci U S A. .

Abstract

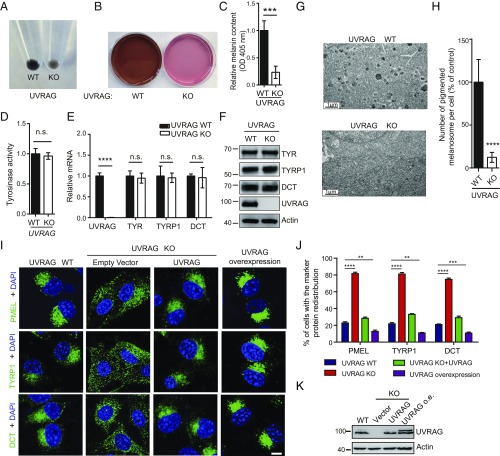
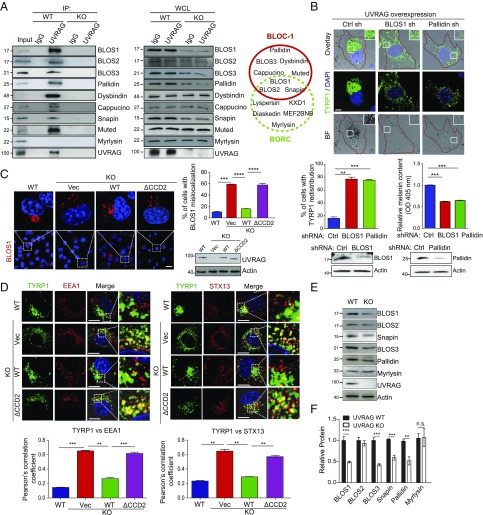
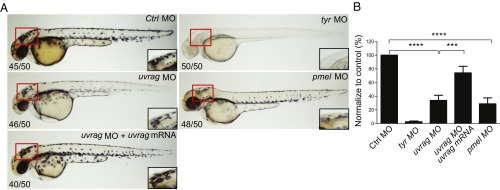
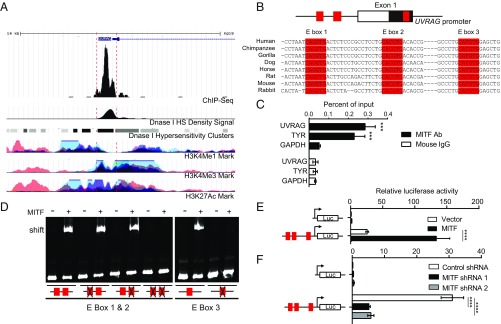
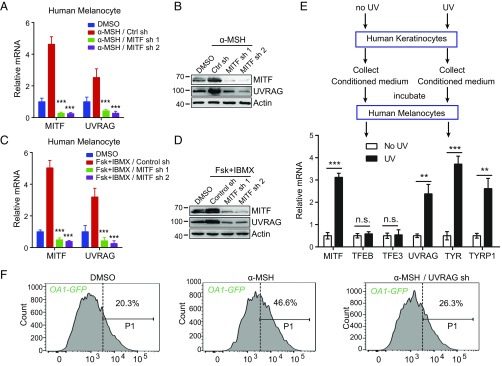
UV-induced cell pigmentation represents an important mechanism against skin cancers. Sun-exposed skin secretes α-MSH, which induces the lineage-specific transcriptional factor MITF and activates melanogenesis in melanocytes. Here, we show that the autophagic tumor suppressor UVRAG plays an integral role in melanogenesis by interaction with the biogenesis of lysosome-related organelles complex 1 (BLOC-1). This interaction is required for BLOC-1 stability and for BLOC-1-mediated cargo sorting and delivery to melanosomes. Absence of UVRAG dispersed BLOC-1 distribution and activity, resulting in impaired melanogenesis in vitro and defective melanocyte development in zebrafish in vivo. Furthermore, our results establish UVRAG as an important effector for melanocytes' response to α-MSH signaling as a direct target of MITF and reveal the molecular basis underlying the association between oncogenic BRAF and compromised UV protection in melanoma.

Keywords: BLOC-1; BRAF; MITF; UVRAG; melanosome.


Conflict of interest statement

Conflict of interest: The authors declare no conflict of interest.

Figures

Fig. 1.
Fig. 1.
UVRAG is required for melanogenesis. (A) Effect of UVRAG on the pigmentation of B16 melanoma cells. Equal number of UVRAG wild-type (WT) and knockout (KO) cells were pelleted by centrifugation after a 6-d culture. (B) Photographs of UVRAG WT and KO B16 cell culture media. (C) Relative melanin contents of the cell lysates of UVRAG WT and KO B16 cells (6-d culture), measured as optical density (OD) at 405 nm. Data are mean ± SD from three independent experiments. (D) Tyrosinase activity in extracts from cells in A, measured by in vitro l-DOPA assay. Data are mean ± SD from three independent experiments. (E) Quantitative RT-PCR showing the relative levels of mRNA expression for TYR, TYRP1, and DCT in UVRAG WT and KO cells in A. Data are mean ± SD from three independent experiments. (F) Western blot analysis of the relative expression of the indicated proteins in cells in A. Actin serves as a loading control. (G and H) Melanosome morphology upon UVRAG deletion. UVRAG WT and KO B16 melanoma cells were subjected to electron microscopy analysis (G). Compared with UVRAG WT cells, the darkly pigmented melanosomes were barely detected in cells lacking UVRAG. The number of pigmented melanosomes per cell was quantified in UVRAG KO melanocytes and normalized to that of WT control (H). Data represent mean ± SD (n = 30–40 cells obtained by gathering data from three independent experiments). (IK) UVRAG deficiency leads to redistribution of melanosome markers. UVRAG WT (first column), UVRAG KO B16 cells complemented with empty vector (second column) or UVRAG (third column), and B16 cells stably expressing Flag-UVRAG (fourth column) were stained for PMEL, TYRP1, and DCT (I). Nuclei were stained with DAPI (blue). The percentage of cells with redistribution of the indicated proteins was quantified in J. Data represent mean ± SD (n = 200 cells obtained from three independent experiments). The expression of UVRAG in these cells is shown in K. o.e., overexpression. (Scale bars, 20 μm.) n.s., not significant; **P < 0.01; ***P < 0.001; ****P < 0.0001.
Fig. 2.
Fig. 2.
UVRAG interacts with BLOC-1 and regulates BLOC-1 complex stability, distribution, and cargo-sorting activity in melanosome biogenesis. (A) Interaction between UVRAG and the BLOC-1 complex proteins. Whole cell lysates (WCLs) of UVRAG WT and KO B16 melanocytes were used for immunoprecipitation (IP) with control IgG or anti-UVRAG antibody, followed by immunoblotting (IB) with the indicated antibodies. Right shows endogenous protein expression. As input, 5% of the WCLs was used. Note that UVRAG does not interact with the BORC-specific protein Myrlysin. The protein composition of BLOC-1 and BORC is also shown at Right. (B) BLOC-1 is required for UVRAG-mediated cell pigmentation. B16 melanoma cell stably expressing UVRAG was transfected with control shRNA or shRNA against BLOS1 or Pallidin, and then immunostained with anti-TYRP1 for bright-field (BF) and confocal microscopy (Top). Nuclei were stained with DAPI (blue). The redistribution of TYRP1 (Middle Left) and the relative melanin contents (Middle Right) in the cell lysates in shRNA-transfected cells was quantified. Endogenous protein expression is also shown (Bottom). Means were calculated from the data collected from three independent experiments (n = 200). (Scale bar, 10 μm.) (C) Cytoplasmic dispersion of BLOS1 in UVRAG KO and mutant cells. Representative images of BLOS1 staining in UVRAG WT, KO, and UVRAG KO B16 cells complemented with UVRAG WT or ΔCCD2 are shown (Left). The percentage of cells with BLOS1 dispersion was quantified (Right). Means were calculated from the data collected from three independent experiments (n = 200). Endogenous protein expression is also shown. (Scale bar, 10 μm.) (D) Deletion of UVRAG caused aberrant accumulation of TYRP1 in EEA1- and STX13-positive endosomes. UVRAG WT, KO, and KO B16 cells complemented with UVRAG WT or ΔCCD2 were stained for TYRP1 along with EEA1 or STX13. Nuclei were stained with DAPI, followed by confocal microscopy. The degree of colocalization of TYRP1 with the indicated markers was quantified (Bottom). Means were calculated from the data collected from three independent experiments (n = 50). (Scale bars, 20 μm.) (E and F) Western blot analysis (E) and densitometric quantification (F) of the relative expression of BLOC-1 in UVRAG WT and KO cells. Note decreased levels of BLOC-1 proteins in UVRAG KO melanocytes. Means were calculated from the data collected from three independent experiments. n.s., not significant; **P < 0.01; ***P < 0.001; ****P < 0.0001.
Fig. 3.
Fig. 3.
UVRAG is required for melanocyte development in zebrafish in vivo. (A) Representative images of 48 h postfertilization (hpf) zebrafish embryos injected with control morpholino (MO) or MO targeting uvrag, pmel, or tyr. Rescue of uvrag MO-mediated depigmentation is shown by coinjection of human uvrag mRNA. Box highlights area of enlargement visualized in Insets. Numbers on each panel indicate the number of embryos showing the representative phenotype per total number of embryos examined. (B) Quantitative measurement shows significantly decreased pigmentation in uvrag MO and pmel MO group compared with the control group. Means were calculated from the data collected from three independent experiments (n = 50). ***P < 0.001; ****P < 0.0001.
Fig. 4.
Fig. 4.
UVRAG is a transcriptional target of MITF. (A) University of California Santa Cruz genome browser view shows the 10-kb region around the UVRAG promoter. The ChIP-seq signals for MITF (30), and peaks of H3K4Me1, H3K4Me3, H3K27Ac, and DNase I hypersensitivity (HS) density in human melanocytes are extracted from the ENCODE dataset and annotated. (B) Structure of UVRAG promoter showing the location of exon 1 and the three E boxes of the MITF-binding sites (E-box 1, E-box 2, and E-box 3; in red) highly conserved through different species as indicated. (C) ChIP analysis shows MITF occupancy on the UVRAG promoter in human melanocytes. The TYR and GAPDH promoters were used as the positive and negative control, respectively. ***P < 0.001. (D) Electrophoretic mobility shift assay (EMSA) shows the direct association of purified recombinant MITF protein with three E-box sequences in the UVRAG promoter, but not with the E-box mutated sequences. EMSA probes containing either the WT or the mutant E-box sequence are indicated. (E) Dual luciferase reporter assay showing the activity of the UVRAG promoter in response to transfection of MITF in 293T cells. Red boxes indicate the location of three E boxes. Data are mean ± SD from three independent experiments. (F) Knockdown of MITF strongly suppresses UVRAG promoter activity in melanocytes. The UVRAG promoter–reporter was transfected into human melanocytes expressing MITF-specific shRNA and luciferase activity was measured 48 h posttransfection. Results are expressed as mean ± SD from three independent experiments. ****P < 0.0001.
Fig. 5.
Fig. 5.
MITF induces UVRAG expression in response to α-MSH. (A and B) UVRAG mRNA expression in human melanocytes expressing MITF-specific shRNA and treated with α-MSH for 2 h (A). The relative expression of MITF and UVRAG in cells in A after α-MSH treatment is shown in B. Data are mean ± SD from three independent experiments. (C and D) UVRAG mRNA expression in human melanocytes expressing MITF-specific shRNA and treated with forskolin (FSK) + IBMX for 2 h (C). The relative expression of MITF and UVRAG in cells in C after FSK + IBMX treatment is shown in D. Data are mean ± SD from three independent experiments. (E) Melanogenic gene expression in human melanocytes induced by conditioned media collected from UV-irradiated human keratinocytes. Keratinocytes were UVB (10 mJ/cm2) irradiated for 16 h and medium was collected. Naïve human melanocytes were then incubated for 5 h with the collected medium from mock- and UV-treated cells and then evaluated for gene expression as indicated. (F) B16 cells stably expressing melanosome marker OA1-GFP were transfected with control shRNA or UVRAG-specific shRNA and treated with α-MSH. The resulted cells were subjected to flow cytometry analysis. The portion of cells with the fluorescence intensity greater than the indicated threshold (P1 gate) are indicated. n.s., not significant; **P < 0.01; ***P < 0.001.
Fig. 6.
Fig. 6.
Oncogenic BRAF(V600E) inhibits UVRAG expression and attenuates the tanning ability of melanocytes. (A) Quantitative RT-PCR showing the relative level of mRNA expression for UVRAG, TYR, and DCT in human melanocytes expressing empty vector or BRAF(V600E). Data are mean ± SD from three independent experiments. (BD) BRAF(V600E) inhibits α-MSH–induced melanogenesis. Confocal microscopy of the distribution pattern of PMEL in human melanocytes expressing vector or BRAF(V600E) upon α-MSH treatment (B). The relative intensity of PMEL was quantified (C). The melanin contents of the lysates of cells in B were measured OD at 405 nm (D). Data are mean ± SD from three independent experiments. (E and F) Quantitative RT-PCR showing the relative mRNA expression for MITF, UVRAG, TYR, and DCT in A375 cells treated with PLX4720 (1 μM) for 48 h (E). Western blot analysis of the indicated proteins in cells in E is shown in F. (G) A375 melanoma cells expressing control shRNA or MITF-specific shRNA were treated with PLX4720 (1 μM) and subjected to flow cytometry analysis using OA1-mCherry as a marker of melanosomes. (H) ChIP-seq analysis of MITF occupancy on the UVRAG promoter in melanocytes transduced with either empty vector (first panel) or BRAF(V600E) (second panel); and in BRAF(V600E)-positive COLO829 melanoma cells treated with either DMSO (third panel) or PLX4032 (fourth panel). The ChIP-seq original data are from a previous report (30). **P < 0.01; ***P < 0.001; ****P < 0.0001.

References

    1. Aubert B, et al. BABAR Collaboration Measurement of branching fractions and charge asymmetries in B decays to an eta meson and a K* meson. Phys Rev Lett. 2006;97:201802. - PubMed
    1. Chen H, Weng QY, Fisher DE. UV signaling pathways within the skin. J Invest Dermatol. 2014;134:2080–2085. - PMC - PubMed
    1. Lin JY, Fisher DE. Melanocyte biology and skin pigmentation. Nature. 2007;445:843–850. - PubMed
    1. Theos AC, Truschel ST, Raposo G, Marks MS. The silver locus product Pmel17/gp100/Silv/ME20: Controversial in name and in function. Pigment Cell Res. 2005;18:322–336. - PMC - PubMed
    1. Raposo G, Marks MS. Melanosomes–Dark organelles enlighten endosomal membrane transport. Nat Rev Mol Cell Biol. 2007;8:786–797. - PMC - PubMed

Publication types

MeSH terms