. 2018 Jul 30;10(8):994.
doi: 10.3390/nu10080994.

Thirteen-Year Trends in Dietary Patterns among Japanese Adults in the National Health and Nutrition Survey 2003⁻2015: Continuous Westernization of the Japanese Diet

Affiliations

Thirteen-Year Trends in Dietary Patterns among Japanese Adults in the National Health and Nutrition Survey 2003⁻2015: Continuous Westernization of the Japanese Diet

Kentaro Murakami et al. Nutrients. .

Abstract

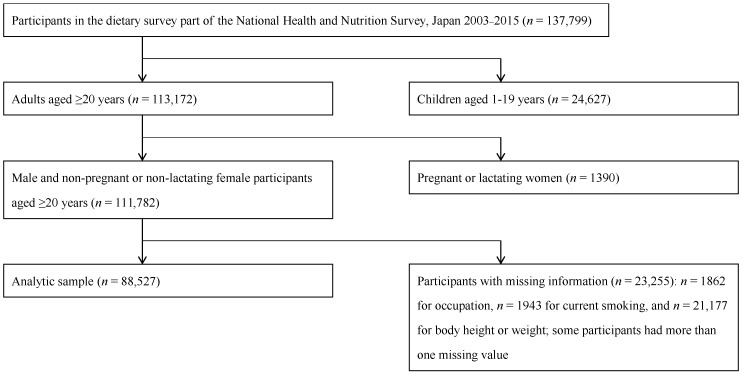
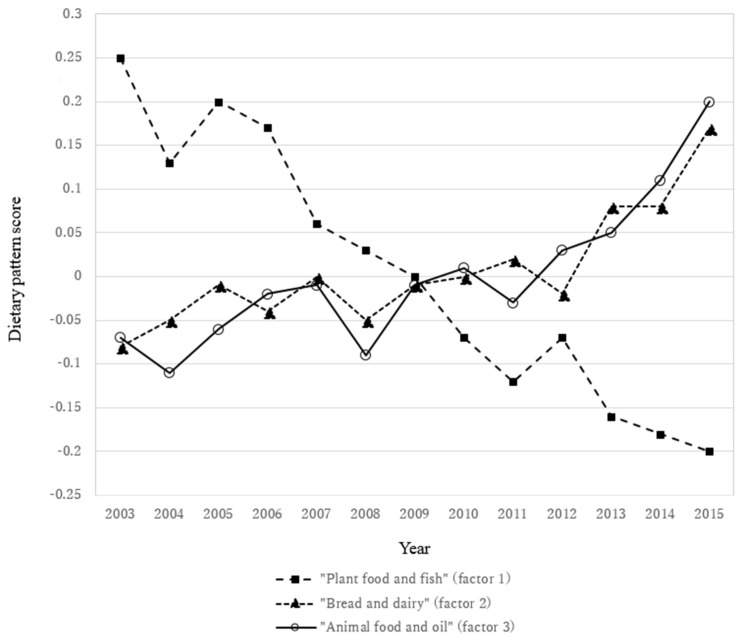
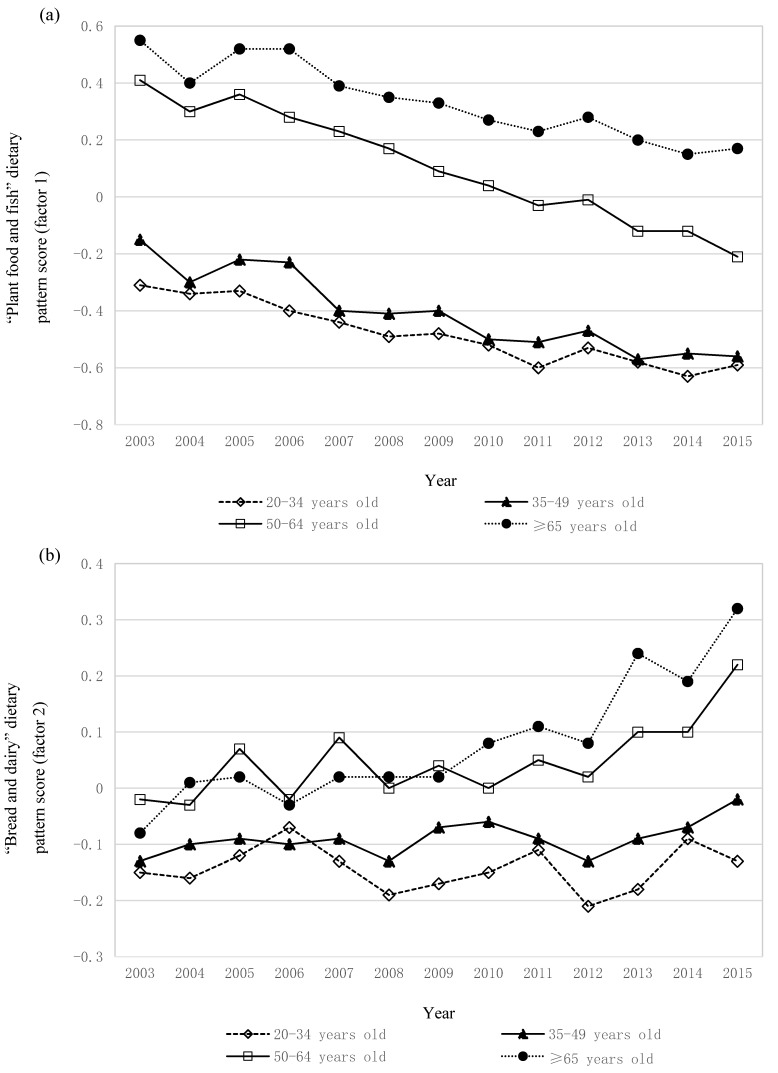
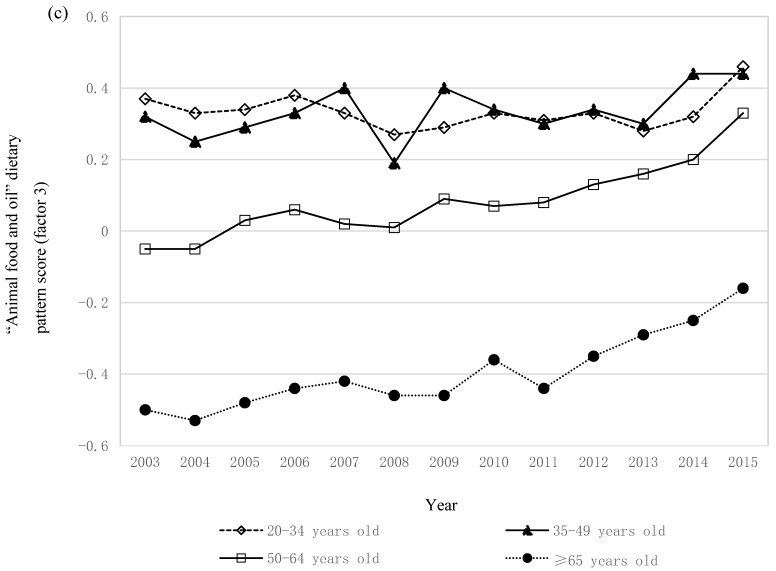
We examined 13-year trends in dietary patterns, using data from the National Health and Nutrition Survey, Japan 2003⁻2015. In repeated, independent cross-sectional studies, dietary intake was assessed with a one-day weighed dietary record in 88,527 Japanese adults aged ≥20 years. Using principal component analysis based on the daily consumption of 31 food groups, we identified three dietary patterns, the "plant food and fish", "bread and dairy", and "animal food and oil" patterns. In the whole sample, the "plant food and fish" pattern score decreased while the "bread and dairy" and "animal food and oil" pattern scores increased. The decreasing trends in the "plant food and fish" pattern were observed in all subgroups considered. The increasing trends in the "bread and dairy" pattern were similar across sexes and by current smoking status. However, in terms of age, occupation, and weight status, the increasing trends were only evident in particular subgroups (i.e., age 50⁻64 and ≥65 years; security/transportation/labor occupation and nonworker; and normal weight and overweight participants). For the "animal food and oil" pattern, the increasing trends were observed in all subgroups, except for the youngest age group (20⁻34 years old). This study suggests continuous Westernization of the Japanese diet.

Keywords: dietary patterns; food consumption patterns; national survey; principal component analysis; trend analysis.


Conflict of interest statement

The authors declare no conflicts of interest.

Figures

Figure 1
Figure 1
Flow diagram of the study participants.
Figure 2
Figure 2
Thirteen-year trends in dietary pattern scores in adults aged ≥20 years in the National Health and Nutrition Survey, Japan 2003–2015. Values are means adjusted for sex, age category, occupation, weight status, and current smoking. The dietary pattern score represents standardized variables with mean 0 and standard deviation 1. Negative scores indicate low adherence to the dietary pattern, and positive scores indicate high adherence. The naming of the dietary patterns was as follows: “plant food and fish” (factor 1), “bread and dairy” (factor 2), and “animal food and oil” (factor 3). Sizes of the study population were as follows: n = 7062 for 2003, n = 5675 for 2004, n = 5469 for 2005, n = 6062 for 2006, n = 5954 for 2007, n = 6198 for 2008, n = 6047 for 2009, n = 5581 for 2010, n = 5197 for 2011, n = 19,717 for 2012, n = 5393 for 2013, n = 5298 for 2014, and n = 4874 for 2015. The trends in all dietary patterns were significant (p for trend < 0.0001).
Figure 3
Figure 3
Thirteen-year trends in the (a) “plant food and fish”, (b) “bread and dairy”, and (c) “animal food and oil” dietary pattern scores stratified by age category. Values are means adjusted for sex, occupation, weight status, and current smoking. The dietary pattern score represents standardized variables with mean 0 and standard deviation 1. Negative scores indicate low adherence to the dietary pattern, and positive scores indicate high adherence. Data were derived from the National Health and Nutrition Survey 2003–2015. Sizes of the study population were 10,983, 19,727, 25,732, and 32,085 for participants aged 20–34, 35–49, 50–64, and ≥65 years, respectively. The trends in all dietary patterns were significant (p for trend < 0.0001), except for “bread and dairy” in participants aged 20–34 years (p for trend = 0.19) and 35–49 years (p for trend = 0.11) and “animal food and oil” in those aged 20–34 years (p for trend = 0.68).
Figure 3
Figure 3
Thirteen-year trends in the (a) “plant food and fish”, (b) “bread and dairy”, and (c) “animal food and oil” dietary pattern scores stratified by age category. Values are means adjusted for sex, occupation, weight status, and current smoking. The dietary pattern score represents standardized variables with mean 0 and standard deviation 1. Negative scores indicate low adherence to the dietary pattern, and positive scores indicate high adherence. Data were derived from the National Health and Nutrition Survey 2003–2015. Sizes of the study population were 10,983, 19,727, 25,732, and 32,085 for participants aged 20–34, 35–49, 50–64, and ≥65 years, respectively. The trends in all dietary patterns were significant (p for trend < 0.0001), except for “bread and dairy” in participants aged 20–34 years (p for trend = 0.19) and 35–49 years (p for trend = 0.11) and “animal food and oil” in those aged 20–34 years (p for trend = 0.68).

References

    1. Rehm C.D., Penalvo J.L., Afshin A., Mozaffarian D. Dietary intake among US adults, 1999–2012. JAMA. 2016;315:2542–2553. doi: 10.1001/jama.2016.7491. - DOI - PMC - PubMed
    1. Hu F.B. Dietary pattern analysis: A new direction in nutritional epidemiology. Curr. Opin. Lipidol. 2002;13:3–9. doi: 10.1097/00041433-200202000-00002. - DOI - PubMed
    1. Kant A.K. Dietary patterns and health outcomes. J. Am. Diet. Assoc. 2004;104:615–635. doi: 10.1016/j.jada.2004.01.010. - DOI - PubMed
    1. Newby P.K., Tucker K.L. Empirically derived eating patterns using factor or cluster analysis: A review. Nutr. Rev. 2004;62:177–203. doi: 10.1111/j.1753-4887.2004.tb00040.x. - DOI - PubMed
    1. Ax E., Warensjo Lemming E., Becker W., Andersson A., Lindroos A.K., Cederholm T., Sjogren P., Fung T.T. Dietary patterns in Swedish adults; results from a national dietary survey. Br. J. Nutr. 2016;115:95–104. doi: 10.1017/S0007114515004110. - DOI - PubMed