. 2018 Jul 30;9(1):2968.
doi: 10.1038/s41467-018-04389-0.

Overexpression of endophilin A1 exacerbates synaptic alterations in a mouse model of Alzheimer's disease

Affiliations

Overexpression of endophilin A1 exacerbates synaptic alterations in a mouse model of Alzheimer's disease

Qing Yu et al. Nat Commun. .

Abstract

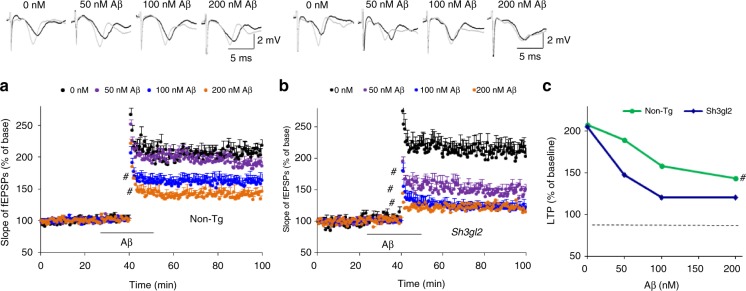
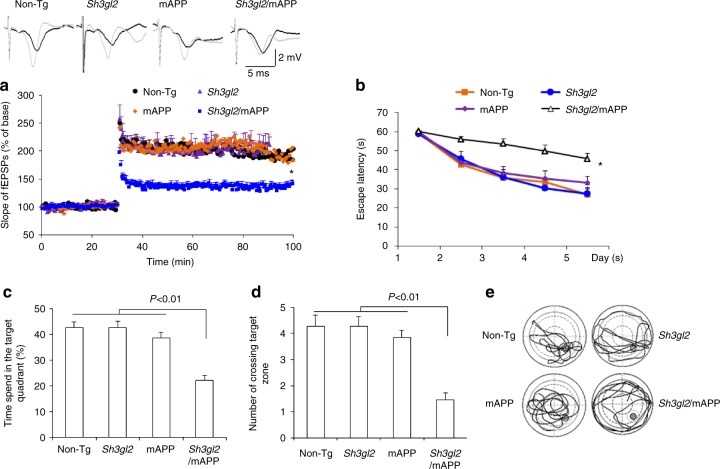
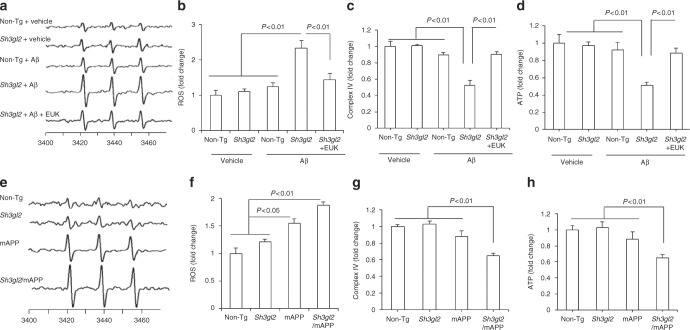
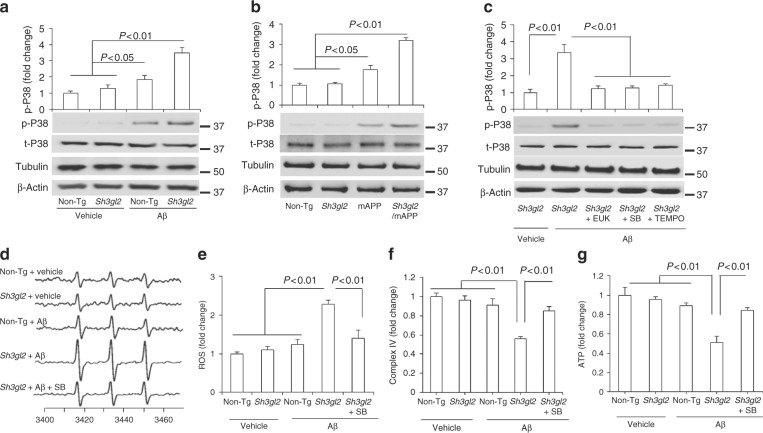
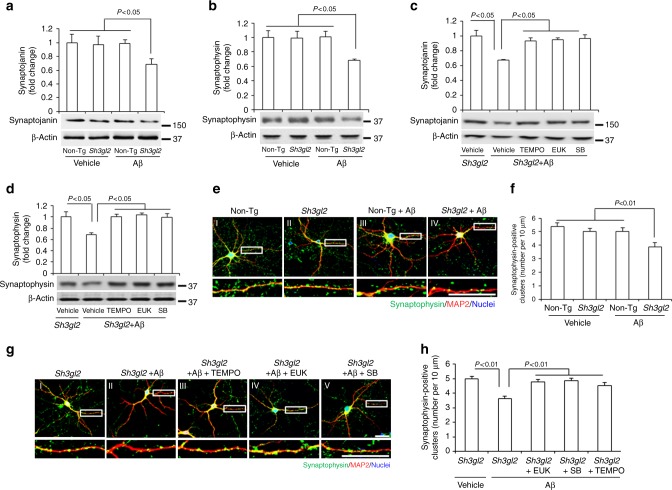
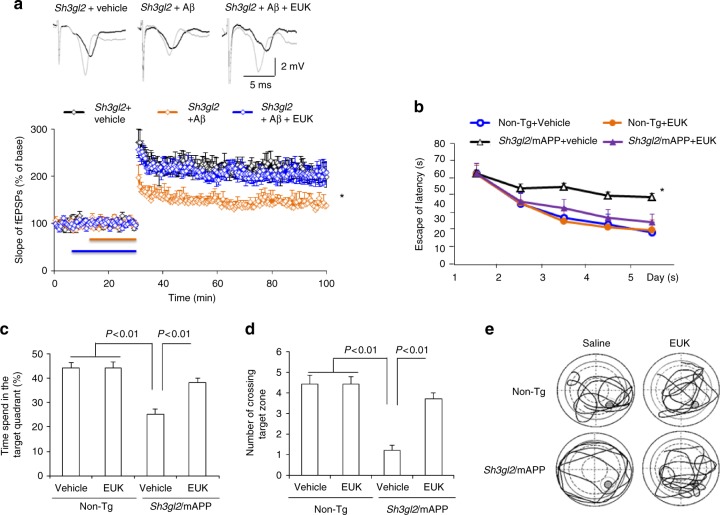
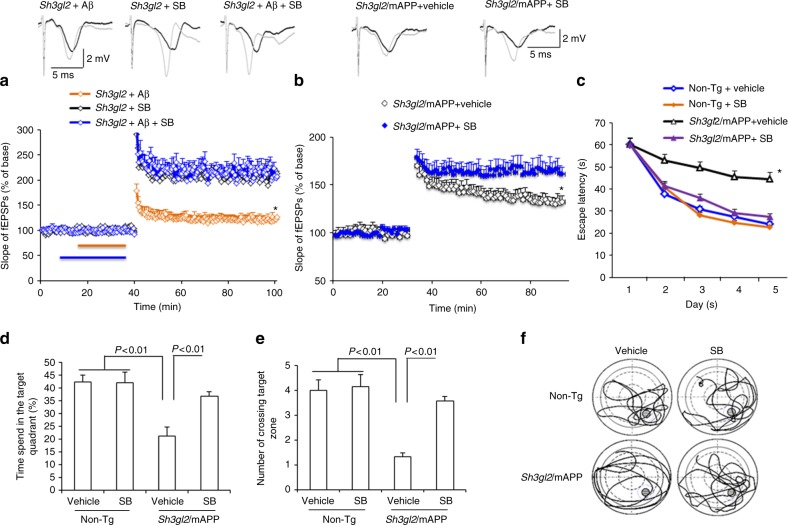
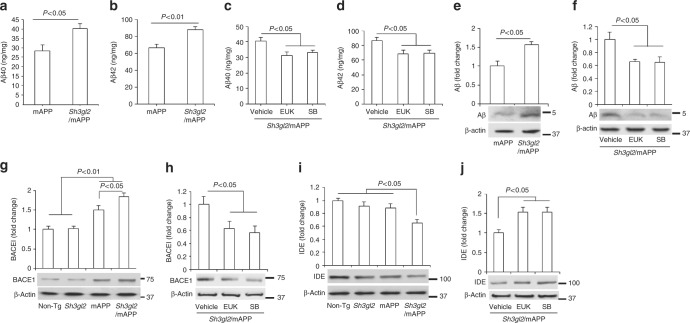
Endophilin A1 (EP) is a protein enriched in synaptic terminals that has been linked to Alzheimer's disease (AD). Previous in vitro studies have shown that EP can bind to a variety of proteins, which elicit changes in synaptic transmission of neurotransmitters and spine formation. Additionally, we previously showed that EP protein levels are elevated in AD patients and AD transgenic animal models. Here, we establish the in vivo consequences of upregulation of EP expression in amyloid-β peptide (Aβ)-rich environments, leading to changes in both long-term potentiation and learning and memory of transgenic animals. Specifically, increasing EP augmented cerebral Aβ accumulation. EP-mediated signal transduction via reactive oxygen species (ROS)/p38 mitogen-activated protein (MAP) kinase contributes to Aβ-induced mitochondrial dysfunction, synaptic injury, and cognitive decline, which could be rescued by blocking either ROS or p38 MAP kinase activity.


Conflict of interest statement

The authors declare no competing interests.

Figures

Fig. 1
Fig. 1
Effect of EP overexpression on oligomer Aβ-induced hippocampal synaptic deficit. Hippocampal slices were derived from 3-month-old non-Tg and Tg Sh3gl2 mice. Slices were perfused with 50, 100, and 200 nM Aβ for 1 h. a Fifty nanomolar of oligomer Aβ perfusion over non-Tg slices does not significantly reduce LTP level. Perfusion of non-Tg hippocampal slices with higher Aβ concentration (100 nM, 200 nM) impairs hippocampal LTP expression. Error bars represent s.e.m., n = 7–10 per group; #p < 0.05 (one-way ANOVA). b Fifty nanomolar of oligomer Aβ perfusion over Tg Sh3gl2 slices significantly reduce the LTP level. Perfusion with higher Aβ concentration (100 nM, 200 nM) saturated the deleterious effect of Aβ on hippocampal LTP impairment. Line indicates Aβ exposure period. Error bars represent s.e.m., n = 7–10 per group; #p < 0.05 (one-way ANOVA). c Upper panels of a and b show representative traces of fEPSP in slices with the indicated treatment before θ-burst stimulation (black line) and after 1 h (gray line). Summarized LTP levels (average of the fEPSPs slope of the last 10 min recordings) in the indicated groups. Data are shown as mean ± s.e.m., n = 7–10 per group; #p < 0.05 (Student’s t test)
Fig. 2
Fig. 2
Effect of EP overexpression on synaptic plasticity and spatial learning and memory in transgenic Tg Sh3gl2/ mAPP mice. a Tg Sh3gl2 or mAPP at 5–6 months of age do not alter hippocampal LTP, but the hippocampal LTP is significantly reduced in Tg Sh3gl2/mAPP mice as compared with non-Tg mice. Error bars represent s.e.m., n = 7–10 per group; *p < 0.01 (one-way ANOVA). Upper panel shows representative traces of fEPSP in the indicated slices before θ-burst stimulation (black line) and after 1 h (gray line). be Mice were tested in Morris water maze at the age of 5–5.5 months. b Escape latencies in hidden platform during Morris water maze task training in indicated groups of mice. Error bars represent s.e.m., n = 8–9 mice per group (one-way ANOVA in b). c Time spent in the quadrant with the hidden platform and d mean number of crossings of the target during the probe test. e The representative searching traces during the probe test. Data are shown as mean ± s.e.m., n = 8–9 mice per group (one-way ANOVA in c, d)
Fig. 3
Fig. 3
Effect of antioxidant on EP/Aβ-mediated ROS production and mitochondrial dysfunction in brain in vivo and brain slices in vitro. a The peak height in the spectrum indicates the levels of ROS. Representative spectrum of EPR in indicated mice brain slices perfused with Aβ or vehicle in the presence/absence of antioxidant EUK-134 (EUK). Brain slices from indicated Tg mice were pretreated with EUK (500 nM) for 5 min before Aβ perfusion (50 nM for 1 h). b Data are presented as fold increase relative to vehicle-treated non-Tg mice slices. Mitochondrial complex IV activity (c) and ATP levels (d) were demonstrated in the indicated hippocampus treated with vehicle or Aβ in the presence/absence of EUK. Date are shown as mean ± s.e.m., n = 3 per group (one-way ANOVA in bd). e Representative spectra of EPR in the indicated Tg mice at 5–6 months of age . f Quantification of EPR spectra in the indicated mice brain. Data are expressed as fold increase relative to non-Tg mice. Date are shown as mean ± s.e.m., n = 5 mice per group (one-way ANOVA in f). Mitochondrial complex IV activity (g) and ATP levels (h) in indicated mice were assayed. Data are shown as mean ± s.e.m., n = 6–10 mice per group (one-way ANOVA in g–h)
Fig. 4
Fig. 4
Effect of EP overexpression on p38 MAP kinase activation and mitochondrial dysfunction in Aβ-insulted brain in vivo and brain slices in vitro. a Brain slices from 3-month-old non-Tg or Tg Sh3gl2 mice were perfused with Aβ (50 nM) or vehicle for 1 h and then subjected to immunoblotting analysis for the phosphorylation of p38 MAP kinase (p-p38), total p38 MAP kinase (t-p38), tubulin, and β-actin. Tubulin and β-actin served as a neuronal marker and protein loading controls, respectively. Data are expressed as fold change relative to the non-Tg vehicle control group. b Immunoblotting of cortical homogenates from the indicated Tg mice at 5–6 months of age for the indicated proteins. Data are expressed as fold change relative to the non-Tg mice group. c Brain slices from indicated Tg Sh3gl2 mice were treated with vehicle or Aβ (50 nM) with/without pretreatment of EUK-134 (EUK, 500 nM), SB203580 (SB, 1 µM), or mitochondrial antioxidant MitoTEMPO (TEMPO, 1 µM) for 5 min, and then subjected to immunoblotting for the phosphorylation of p38 MAP kinase (p-P38), total p38 MAP kinase (t-p38), tubulin, and β-actin. Data are expressed as fold change relative to the Tg Sh3gl2 vehicle control group. Date are shown as mean ± s.e.m., n = 3 per group (one-way ANOVA in ac). d Representative spectra of EPR in non-Tg and Tg Sh3gl2 brain slices with the treatment of vehicle or Aβ (50 nM) in the presence of SB203580 (1 µM). e Quantification of EPR spectra in the indicated groups of mice. fg Mitochondrial complex IV activity (f) and ATP levels (g) in the indicated groups of brain slices treated with vehicle or Aβ in the presence/absence of SB203580. Data are expressed as fold increase relative to non-Tg vehicle control group. Date are shown as mean ± s.e.m., n = 3 per group (one-way ANOVA in eg)
Fig. 5
Fig. 5
Effect of mitochondrial ROS scavenger on EP/Aβ-mediated p38 activation, ROS production, and mitochondrial dysfunction. a Brain slices from 3-month-old non-Tg or Tg Sh3gl2 mice were perfused with Aβ (50 nM) for 1 h with/without pretreatment of mitochondrial antioxidant MitoTEMPO (TEMPO, 1 µM) for 5 min, and then subjected to measure EPR, mitochondrial complex IV activity, and ATP levels. a Representative spectrum of EPR in non-Tg and Tg Sh3gl2 brain slices with the treatment of vehicle or Aβ in the presence of MitoTEMPO. b Quantification of EPR spectra in the indicated groups of mice. c, d Mitochondrial complex IV activity (c) and ATP levels (d) in the indicated groups of brain slices treated with vehicle or Aβ in the presence/absence of MitoTEMPO. Data are expressed as fold change relative to non-Tg vehicle control group. Date are shown as mean ± s.e.m., n = 3 per group (one-way ANOVA in bd)
Fig. 6
Fig. 6
Blocking EP-mediated oxidative stress and p38 activation rescued Aβ-induced synaptic loss. a, b Brain slices from 3-month-old non-Tg or Tg Sh3gl2 mice were perfused with Aβ (50 nM) for 2 h, and then subjected to immunoblotting analysis for synaptojanin (a) and synaptophysin (b) in the indicated groups of brain slices. β-Actin served as protein loading controls. The upper panel displays quantification of immunoreactive bands for the corresponding protein relative to β-actin. Data are expressed as fold change relative to the non-Tg vehicle control group. Data are shown as mean ± s.e.m., n = 3 per group (one-way ANOVA in a, b). c, d The Tg Sh3gl2 brain slices from 3-month-old mice were perfused with Aβ (50 nM) for 2 h with/without pretreatment of 500 nM EUK-134 (EUK), 1 μM SB203580 (SB), or 1 µM MitoTEMPO (TEMPO) for 5 min. Immunoblotting for synaptojanin (c) and synaptophysin (d) in the indicated groups of brain slices. The upper panel displays the quantification of immunoreactive bands for the corresponding protein relative to β-actin. Data are expressed as fold change relative to Tg Sh3gl2 vehicle control group. Data are shown as mean ± s.e.m., n = 3 per group (one-way ANOVA in c, d). Fourteen-day in vitro cultured cortical neurons, either non-Tg or Tg Sh3gl2, were treated with 50 nM Aβ for 24 h, with or without 500 nM EUK-134, 1 μM SB203580, or 1 μM MitoTEMPO pretreatment for 1 h before the addition of Aβ. The numbers of synaptophysin-positive clusters were significantly decreased in Aβ-treated Tg Sh3gl2 neurons compared to vehicle-treated non-Tg neurons in eh. Treatment with EUK-134, or SB203580, or MitoTEMPO, inhibited Aβ-induced synaptic loss in cultured EP overexpression neurons (g, h). Representative images for synaptophysin (green), MAP2 (red), and nuclei (blue) in the indicated groups of neurons are shown in e, g. Scale bars, 50 μm. Quantifications of synaptophysin-positive clusters per 10 μm of dendrites are shown in f, h. Data are shown as mean ± s.e.m., n = 12 cells for each group (one-way ANOVA in f, h)
Fig. 7
Fig. 7
Effect of ROS scavenger on EP/Aβ-mediated synaptic plasticity and spatial learning and memory impairment. a Hippocampal slices from 5-month-old to 6-month-old Tg Sh3gl2 mice were pretreated with EUK-134 (500 nM) for 5 min before Aβ perfusion (100 nM for 20 min), and then hippocampal CA3-CA1 LTP was recorded. Error bars represent s.e.m., n = 7–10 per group. *p < 0.01 (one-way ANOVA). Non-Tg and Tg Sh3gl2/mAPP mice were intraperitoneal injected with EUK-134 (2 mg/kg) once a day for 3 weeks and then performed a Morris water maze test at 5–5.5 months of age. Upper panel shows representative traces of fEPSP in slices with the indicated treatment before θ-burst stimulation (black line) and after 1 h (gray line). b Escape latencies in hidden platform during Morris water maze task training in indicated groups. Error bars represent s.e.m., n = 8–9 per group. *p < 0.01 (one-way ANOVA). c Time spent in the quadrant with the hidden platform and d mean number of crossings of the target during the probe test. e Representative searching traces during the probe test. Learning and memory were impaired in Tg Sh3gl2/mAPP mice compared to other groups, which was rescued by antioxidant EUK treatment. Data are shown as mean ± s.e.m., n = 8–9 mice per group (one-way ANOVA in c, d)
Fig. 8
Fig. 8
Inhibition of p38 MAP kinase rescues impairment on synaptic plasticity and spatial learning and memory in Tg Sh3gl2/mAPP mice. a, b Hippocampal slices from 5-month-old to 6-month-old Tg Sh3gl2 mice were pretreated with SB203580 (SB, 1 µM) for 5 min before Aβ perfusion (100 nM for 20 min) and then hippocampal CA3-CA1 LTP was recorded (a). Tg Sh3gl2/mAPP mice were intraperitoneally injected with SB203580 (0.5 mg/kg) once a day for 3 weeks and then performed LTP experiments (b) and Morris water maze test (cf) at the age of 5–5.5 months. Upper panels of a and b show representative traces of fEPSP in the indicated slices with the indicated treatment before θ-burst stimulation (black line) after 1 h (gray line). Administration of SB203850 significantly ameliorated hippocampal LTP deficit in Tg Sh3gl2/mAPP mice compared to the vehicle-treated group. Error bars represent s.e.m., n = 7–10 per group. *p < 0.01 (one-way ANOVA in a, b). c Escape latencies in hidden platform during Morris water maze task training in indicated groups. Error bars represent s.e.m., n = 8–9 mice per group (one-way ANOVA). d Time spent in the quadrant with the hidden platform and e mean number of crossings of the target during .the probe test. f Representative searching traces during the probe test. Data are shown as mean ± s.e.m., n = 8–9 mice per group (one-way ANOVA in d, e)
Fig. 9
Fig. 9
Blocking EP-mediated oxidative stress and p38 activation rescued Aβ-induced synaptic vesicle recycling impairment. Fourteen-day in vitro cultured cortical neurons, either non-Tg or Tg Sh3gl2, were treated with 50 nM Aβ for 24 h, with or without 500 nM EUK-134, 1 μM SB203580/SB, or 1 μM MitoTEMPO pretreatment for 1 h before the addition of Aβ. To visualize synaptic vesicle recycling, the cells were loaded with the fluorescent styryl dye FM1–43 before and after stimulation with 50 mM K+ for the indicated time. a, f Kinetics of FM1–43 unloading of synaptic boutons during sustained stimulation with 50 mM KCl. b–e Fluorescence images before (I) and after (II, III) FM1–43 unloading with 50 mM KCl, and the representative immunofluorescence images of MAP2 (red, IV) to ensure the position of FM1–43 fluorescence (green, IV in d, e). Tg Sh3gl2 neurons treated with 50 nM Aβ for 24 h alone (e, h) showed synaptic vesicle release impairment compared to the vehicle Tg Sh3gl2 treatment (c, g) and non-Tg neurons, whereas treatment with 50 nM Aβ (d) showed no difference compared to the vehicle non-Tg neurons (b). Pretreatment with 500 nM EUK-134 (i), 1 μM SB203580 (j), or 1 μM MitoTEMPO (k) rescued Aβ-induced synaptic vesicle recycling impairment in Tg Sh3gl2 neurons. Scale bar = 50 µm. Error bars represent s.e.m., n = 8 per group. *p < 0.01 compared to other groups in a and f (one-way ANOVA)
Fig. 10
Fig. 10
Effect of EP overexpression on cerebral Aβ accumulation. ELISA for measurement of Aβ40 (a, c) and Aβ42 (b, d) in the entorhinal cortex of Tg mAPP and Tg Sh3gl2/mAPP mice at the age of 5–5.5 months. EUK-134 (EUK, 2 mg/kg) (c, d) or SB203580 (SB, 0.5 mg/kg) (c, d) was administered to Tg Sh3gl2/mAPP mice once a day for 3 weeks and then cortical tissues were subjected to Aβ measurement at the age of 5–5.5 months. Date are shown as mean ± s.e.m., n = 3–6 per group (one-way ANOVA in a–d). Quantification of immunoreactive bands for Aβ (e), BACE1 (g), or IDE (i) in the indicated Tg mice at the age of 5–5.5 months. Quantification of immunoreactive bands for Aβ (f), BACE1 (h), or IDE (j) in Tg Sh3gl2.mAPP mice treated with EUK or P38 inhibitor (SB) relative to vehicle treatment. β-Actin was used as a protein loading control. Lower panels are representative immunoblots for the indicated proteins in the indicated Tg mice. Date are shown as mean ± s.e.m., n = 3 per group (one-way ANOVA in e–j)

References

    1. Terry RD, et al. Physical basis of cognitive alterations in Alzheimer’s disease: synapse loss is the major correlate of cognitive impairment. Ann. Neurol. 1991;30:572–580. doi: 10.1002/ana.410300410. - DOI - PubMed
    1. Scheff SW, Sparks DL, Price DA. Quantitative assessment of synaptic density in the outer molecular layer of the hippocampal dentate gyrus in Alzheimer’s disease. Dementia. 1996;7:226–232. - PubMed
    1. DeKosky ST, Scheff SW. Synapse loss in frontal cortex biopsies in Alzheimer’s disease: correlation with cognitive severity. Ann. Neurol. 1990;27:457–464. doi: 10.1002/ana.410270502. - DOI - PubMed
    1. Masliah E, et al. Altered expression of synaptic proteins occurs early during progression of Alzheimer’s disease. Neurology. 2001;56:127–129. doi: 10.1212/WNL.56.1.127. - DOI - PubMed
    1. Ferrer I, Gullotta F. Down’s syndrome and Alzheimer’s disease: dendritic spine counts in the hippocampus. Acta Neuropathol. 1990;79:680–685. doi: 10.1007/BF00294247. - DOI - PubMed

Publication types

MeSH terms