. 2018 Jul 30;9(1):2983.
doi: 10.1038/s41467-018-05190-9.

Organoid cultures recapitulate esophageal adenocarcinoma heterogeneity providing a model for clonality studies and precision therapeutics

Affiliations

Organoid cultures recapitulate esophageal adenocarcinoma heterogeneity providing a model for clonality studies and precision therapeutics

Xiaodun Li et al. Nat Commun. .

Abstract

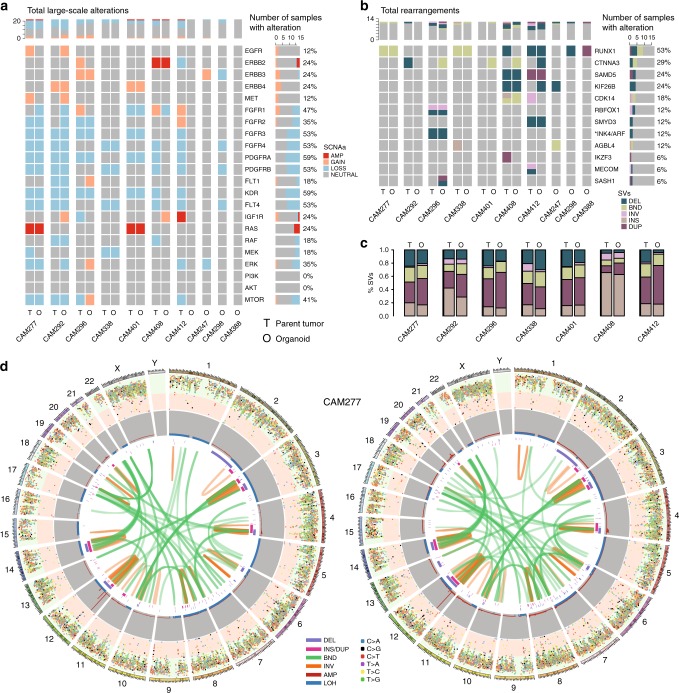
Esophageal adenocarcinoma (EAC) incidence is increasing while 5-year survival rates remain less than 15%. A lack of experimental models has hampered progress. We have generated clinically annotated EAC organoid cultures that recapitulate the morphology, genomic, and transcriptomic landscape of the primary tumor including point mutations, copy number alterations, and mutational signatures. Karyotyping of organoid cultures has confirmed polyclonality reflecting the clonal architecture of the primary tumor. Furthermore, subclones underwent clonal selection associated with driver gene status. Medium throughput drug sensitivity testing demonstrates the potential of targeting receptor tyrosine kinases and downstream mediators. EAC organoid cultures provide a pre-clinical tool for studies of clonal evolution and precision therapeutics.


Conflict of interest statement

The authors declare no competing interests.

Figures

Fig. 1
Fig. 1
Tumor organoid cultures share histopathological features with patient-matched tissue and disruption of polarity. a Representative images of H&E, and IHC of Vim (Vimentin), panCK (pan-cytokeratin), and p53 from primary tissue and patient-matched organoid (40× magnification used for organoid models and 20× for tissues). Images are grouped by p53 expression pattern. Scale bar = 100 μM in primary tissue images and 50 μM in organoid images. b Representative whole-mount immunostaining images of tumor-derived organoids at days 3, 7, 14, and 21 after seeding, with anti-phalloidin (selectively stain F-actin, apical marker, Red), integrin α6 (basolateral marker, green), Edu (proliferation marker, pink), and Hoechst (nuclei, blue) as indicated. Scale bar = 10 μM. c Representative images of IHC of Ki67 from primary tumor tissue. Scale bar = 100 μM
Fig. 2
Fig. 2
Concordance of driver somatic events, SNV/InDels, and mutational signatures between tumor and matched organoid cultures. a Cancer driver genes affected by nonsynonymous SNVs and InDels are highlighted in the derived organoid culture (O) and corresponding patient-matched tumors  (T) where available. Only cancer genes that were also found mutated in at least 5% of the patient cohort (n = 129) in the study by Secrier & Li et al. are displayed, with significantly mutated genes by MutSigCV quoted in the study marked with an asterisk (*). Prevalence of alterations from the analysis of large cohorts of patient tumors (Secrier & Li et al. paper and TCGA (n = 89)) are shown on the right. The variant allele frequencies for each mutation are provided. b Proportion of shared and unique mutations between patient-matched tumor and organoid culture. c Concordance of mutational signature contributions
Fig. 3
Fig. 3
Organoids have a shared genomic landscape with patient-matched tumors. a Copy number alterations of selected receptor tyrosine kinases and key downstream pathway mediators are highlighted in tumors and corresponding organoids. b Structural variants affecting the top recurrently rearranged genes described in Secrier & Li et al. and c Structural variants are compared between tumor and organoid. d Circos plots depicting all mutations (plotted based on inter-mutational distance), copy number changes, and structural variants in the genomes of tumor CAM277 and matched organoid
Fig. 4
Fig. 4
Similarity of global gene expression and expressed mutations between tumors and organoid cultures. a Heatmap showing the Pearson correlation coefficient (color key) between tumors (rows) and organoids (columns) based on the normalized counts of tumor- and organoid-specific genes. Dendrograms show the hierarchical clustering based on the complete method and Euclidean pair-wise distance. In some cases, multiple passages from the same organoid culture are included. b Mutations as in Fig. 2 colored by whether the mutated allele, the reference allele, or no expression were detected by RNA-seq
Fig. 5
Fig. 5
EAC-derived organoids retain intra-tumor heterogeneity. M-FISH spectral karyotype of 10 cells from organoid culture of a CAM277 and e CAM388. Each chromosome has a unique color. Organoid cultures of b, c, d CAM277 and f, g, h CAM338 were continually cultured and sequenced at different passages to study clonal dynamics. b, f Segmented Venn diagram represents clonal composition of tumor cells at each time point. The compositions of each clone at different time points are listed in Supplementary Table 2. c, g Number of total mutations and mutated cancer-related genes from individual subclones. d, h The percentage contribution for each of the 6 mutational signatures across successive passages. The passage number is depicted as the Org_P value
Fig. 6
Fig. 6
Drug sensitivity profiling of 24 compounds against nine EAC organoids. Organoid cultures are clustered based on their drug sensitivity as measured by 1-AUC values across the drug panel. The drug names are provided at the bottom of the panel and the mutational signature subtype also indicated. Asterisks (*) identify drugs that elicited an IC50 below 1 µM while the histogram indicates the number of drugs for each organoid culture eliciting an IC50 below 1 or 0.1 μM

References

    1. Ferlay J, et al. Cancer incidence and mortality worldwide: sources, methods and major patterns in GLOBOCAN 2012. Int. J. Cancer. 2015;136:E359–E386. - PubMed
    1. Fitzgerald RC. Barrett’s oesophagus and oesophageal adenocarcinoma: how does acid interfere with cell proliferation and differentiation? Gut. 2005;54:I21–I26. - PMC - PubMed
    1. National Oesophago-Gastric Cancer Audit - 2016, Annual Report. https://digital.nhs.uk/data-and-information/publications/statistical/nat... (2016).
    1. Alderson, D. et al. Neoadjuvant chemotherapy for resectable oesophageal and junctional adenocarcinoma: results from the UK Medical Research Council randomised OEO5 trial (ISRCTN 01852072). J.Clin. Oncol.33, 4002 (2015).
    1. Allum WH, et al. Guidelines for the management of oesophageal and gastric cancer. Gut. 2011;60:1449–1472. - PubMed

Publication types

MeSH terms

Substances

Supplementary concepts