. 2018 Sep;28(9):879-896.
doi: 10.1038/s41422-018-0074-y. Epub 2018 Jul 30.

Single-cell RNA-seq uncovers dynamic processes and critical regulators in mouse spermatogenesis

Affiliations

Single-cell RNA-seq uncovers dynamic processes and critical regulators in mouse spermatogenesis

Yao Chen et al. Cell Res. 2018 Sep.

Abstract

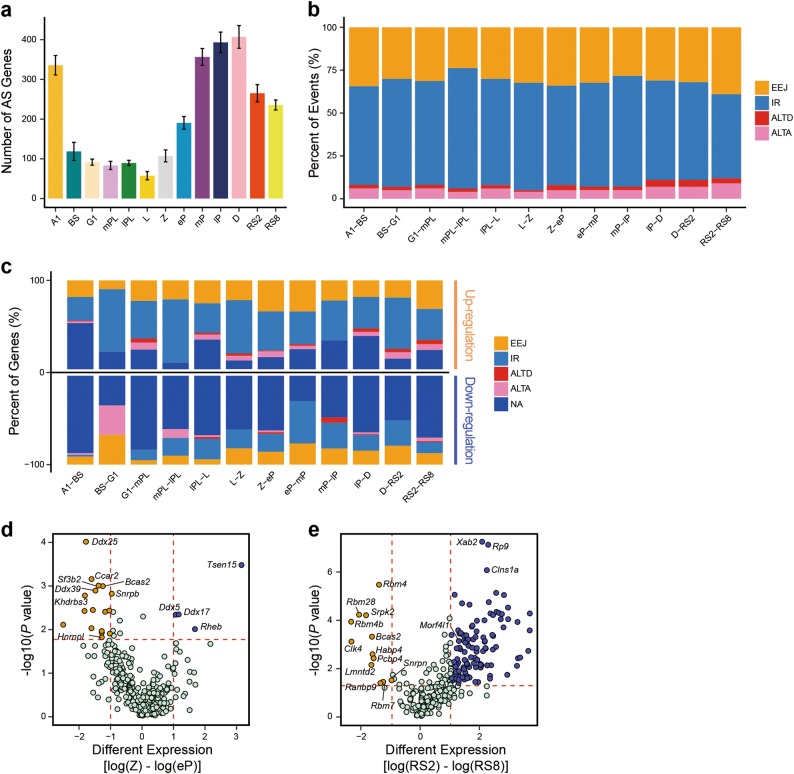
A systematic interrogation of male germ cells is key to complete understanding of molecular mechanisms governing spermatogenesis and the development of new strategies for infertility therapies and male contraception. Here we develop an approach to purify all types of homogeneous spermatogenic cells by combining transgenic labeling and synchronization of the cycle of the seminiferous epithelium, and subsequent single-cell RNA-sequencing. We reveal extensive and previously uncharacterized dynamic processes and molecular signatures in gene expression, as well as specific patterns of alternative splicing, and novel regulators for specific stages of male germ cell development. Our transcriptomics analyses led us to discover discriminative markers for isolating round spermatids at specific stages, and different embryo developmental potentials between early and late stage spermatids, providing evidence that maturation of round spermatids impacts on embryo development. This work provides valuable insights into mammalian spermatogenesis, and a comprehensive resource for future studies towards the complete elucidation of gametogenesis.


Conflict of interest statement

The authors declare no competing interests.

Figures

Fig. 1
Fig. 1
Isolation of all types of mouse spermatogenic cells. a Differential expression of transgene dTomato revealed by immunofluoresence in Vasa-dTomato knockin mice. Detection of the dTomato (red) signal costained with VASA (green) in Vasa-dTomato mice. Scale bar, 50 μm. b Differential YFP expression detected by immunofluoresence in Lin28-YFP knockin mice. Whole-mount immunostaining of seminiferous tubules for GFP (green) and LIN28 (red) (top panel) in Lin28-YFP mice. Detection of the YFP (green) signal costained with LIN28 (red) (bottom panel) in Lin28-YFP mice. Scale bar, 50 μm. c Schematic of the workflow. Male mice carrying both Vasa-dTomato and Lin28-YFP alleles were synchronized. Differential fluorescent protein expression as seen by immunofluorescence in undifferentiated spermatogonia (Green + Red = Orange) and preleptotene spermatocytes (Red) at the stage IV seminiferous tubule. Testes were dissociated into single-cell suspension, and sorted by FACS at population levels. The single cells were picked using the Unipick system according to fluorescence and cell size. In total, twenty subtypes of spermatogenic cells were profiled, including differentiated spermatognia (A1 type A1 spermatogonia, In intermediate spermatogonia, BS S phase type B spermatogonia, BG2 G2/M phase type B spermatogonia), preleptotene spermatocytes (G1 G1 phase preleptotene, ePL early S phase preleptotene, mPL middle S phase preleptotene, lPL late S phase preleptotene), meiotic cells (L leptotene, Z zygotene, eP early pachytene, mP middle pachytene, lP late pachytene, D diplotene, MI metaphase I, MII metaphase II), and round spermatids (RS2 steps 1–2 spermatids, RS4 steps 3–4 spermatids, RS6 steps 5–6 spermatids, RS8 steps 7–8 spermatids)
Fig. 2
Fig. 2
A comprehensive single-cell transcriptome atlas of mouse spermatogenesis. a Pearson correlation coefficient of all filtered spermatogenic cells between 20 developmental stages. The color key indicates the value of Pearson correlation coefficient from low (blue) to high (red). b Boxplots showing the gene number (left panel) and normalized UMI number (right panel) of known protein-coding genes expressed in each individual cell at different stages. Each boxplot represents the median, the first quartiles and the third quartiles of gene expression value; and the whiskers represent 1.5 times the interquartile range. The dots represent the outliers. c Bar plots showing the stage-specific representative gene expression based on RNA-seq analysis throughout 20 developmental stages. Error bar represents mean ± SEM. Scales of each gene expression are independent of each other. d Boxplots showing the gene numbers expressed in Spo11−/− and wild-type (WT) control mice of leptotene stage based on single-cell RNA-seq. The P value is calculated by two-tailed Student’s t-test. e Boxplots showing the normalized UMI numbers expressed in Spo11−/− and WT control mice of leptotene stage based on single-cell RNA-seq. The P value is calculated by two-tailed Student’s t-test. f Boxplots showing the numbers (left panel) and the normalized UMI numbers (right panel) of lncRNAs on autosomes expressed in each individual cell at 20 developmental stages. g Boxplots showing the numbers (left panel) and normalized UMI numbers (right panel) of lncRNAs on sex chromosomes expressed in each individual cell at 20 developmental stages
Fig. 3
Fig. 3
Characterization of dynamic gene expression patterns in male germ cell development. a Principal component analysis (PCA) of the spermatogenic cells at 20 different stages based on their gene expression pattern exhibited by PC1 and PC2. The variation values of PC1 and PC2 are 39.7 and 5.8%, respectively. Distinct cell types are shown in different colors. b The t-distribute stochastic neighbor embedding (t-SNE) plot with seven clusters of spermatogenic cells (left panel) and their corresponding developmental stages (right panel). Clusters C1 to C7 are shown in different colors. Cells at different developmental stages are shown in different colors as in a. c Line graph showing average gene expression level of down- (left panel) and up-regulated (right panel) differentially expressed genes (DEGs) when comparing each of two consecutive clusters. y axis, log2(TPM/10 + 1). The DEG number of each group is shown in brackets. d Gene ontology (GO) analysis of down-regulated DEGs from clusters C2 to C3 (upper panel), down-regulated DEGs from C3 to C4 (middle panel) and up-regulated DEGs from C4 to C5 (bottom panel), respectively. The dynamic gene expression patterns of these three groups are shown in c. e Hematoxylin and eosin (H & E) staining of wild-type control and Fbxo47-cKO testis sections at 8 weeks old. In mutant testes, seminiferous epithelium was arrested at stage IV. IV: stage IV. Scale bar, 50 μm. f Immunohistochemical staining for the mid-late pachytene spermatocyte marker histone variants H1t (green), γH2AX (red), and DAPI (blue) in sections of 8-week-old wild-type control and Fbxo47-cKO testes. Scale bar, 50 μm
Fig. 4
Fig. 4
Steps 1-2 round spermatids have lower embryo developmental potential than Steps 7–8 spermatids. a Boxplots showing the expression levels of four representative surface markers, Cd37 (upper left panel), Cd63 (upper right panel), Cd96 (bottom left panel) and Cd177 (bottom right panel) detected in each individual cell in seven clusters defined in Fig. 3b. Expression levels were transformed to log2(TPM/10 + 1). b Immunocytochemical staining for acrosomal marker PNA (green) of isolated CD63 (upper panel) and CD63high (lower panel) round spermatids by FACS. Scale bar, 50 μm. c Schematic overview of intracytoplasmic round spermatid injection (ROSI) with steps 1–2 (RS1o2), and steps 7–8 (RS7o8) spermatids. d In vitro development of embryos injected with FACS-enriched steps 1–2 and steps 7–8 spermatids. e The efficiency of ROSI embryos developed to the blastocysts by injecting CD63high and CD63 round spermatids. f Images of 2-cell stage embryos and blastocysts generated by ROSI. Scale bar, 100 μm
Fig. 5
Fig. 5
Transcriptional regulation in mouse spermatogenesis. a Gene regulation network analysis of mitotic-to-meiotic transition (left panel) and meiotic-to-postmeiotic transition (right panel). Edges indicate interactions between transcriptional factors (TFs). Circles indicate the TFs. Only TFs with high correlation and at least three edges are shown. b H&E staining of wild-type control and Sox30-cKO testis sections at 8 weeks old. Arrows indicate multinucleated giant cells. Scale bar, 50 μm. c Testis sections from adult wild-type control and Sox30-cKO mice were immunostained with fluorescence dye-labeled peanut lectin (PNA, green) for acrosomes, and DAPI (blue). Scale bar, 50 μm. d Principal component analysis (PCA) (left panel) of steps 3–4 spermatids in Sox30-cKO and wild-type control mice. The cells from Sox30-cKO mice are shown in purple, whereas cells from wild-type mice are in fuchsia. The variation values of PC1 and PC2 are 35.7% and 3.0%, respectively. Heatmap (middle panel) showing the distinct gene expression characteristics between spermatogenic cells of Sox30-cKO and wild-type control mice. Color key from yellow to blue represents the relative gene expression level from high to low. GO analysis (right panel) indicates the potential functions of DEGs in wild-type (fuchsia) and Sox30-cKO mice (purple). e Snapshots showing peak density by ChIP-seq of the representitive genes, Cdh5 (left panel), Hils1 (middle panel) and Sun5 (right panel) in wild-type, Sox30-cKO and Sox30FRT/FRT mice, respectively. Zoomed-in peak is shown in the bottom panel
Fig. 6
Fig. 6
Characterization of dynamic patterns of alternative splicing and its regulation during spermatogenesis. a Bar plot showing the average number of genes with at least two alternative splicing (AS) events at different stages. Error bar represents mean ± SEM. b Stacked bar plot indicating the ratio of AS event changes when comparing two contiguous stages. EEJ exon-exon junction, IR intron retention, ALTD alternative donors, ALTA alternative acceptors. The AS event is classified by its status in the latter stage. c Stacked bar plot showing the ratio of AS status in up- (upper panel) and down-regulated genes that have AS events shared between two consecutive stages. For up-regulated genes, the AS status is shown according to the latter stage; for down-regulated genes, the AS status is shown according to the former stage. NA, no AS status. See Materials and Methods for details. d–e Volcano plots showing differentially expressed splicing regulator genes in Z against eP (d) and RS2 against RS8 (e). The genes in purple (FDR ≤ 0.05 and average difference ≥ 1) or orange (FDR ≤ 0.05 and average difference ≤ –1) are selected splicing regulator genes
Fig. 7
Fig. 7
Dynamic expression patterns of sex chromosome-linked genes during spermatogenesis. a Boxplots showing the numbers of protein-coding genes on sex chromosomes expressed in each individual cell at 20 developmental stages. b Boxplots indicating the normalized UMI counts of protein-coding genes on sex chromosomes expressed in each individual cell at 20 developmental stages. c Heatmap showing five groups of sex chromosome-linked gene expression patterns. The colored bars on the left from top to bottom represent MSCI PMSC, MSCI escape PMSC, escape MSCI, RS specific, and other, respectively. The classification standard of five groups above, see Materials and Methods for details. Color key from yellow to blue represents the relative gene expression level from high to low. d GO analysis of escaped MSCI genes. e Bar plots showing X chromosome-linked (top panel) and Y chromosome-linked (bottom panel) gene expression levels in MI, MII, RS2, RS4, RS6, and RS8 stages. f Principal component analysis (PCA) showing the distribution of cells from RS2 and RS6 based on chromosome X (ChrX)-linked genes (top panel) and chromosome Y (ChrY)-linked genes (bottom panel)

Comment in

References

    1. Griswold MD. Spermatogenesis: the commitment to meiosis. Physiol. Rev. 2016;96:1–17. doi: 10.1152/physrev.00013.2015. - DOI - PMC - PubMed
    1. Clermont Y. Kinetics of spermatogenesis in mammals: seminiferous epithelium cycle and spermatogonial renewal. Physiol. Rev. 1972;52:198–236. doi: 10.1152/physrev.1972.52.1.198. - DOI - PubMed
    1. de Rooij DG. Proliferation and differentiation of spermatogonial stem cells. Reproduction. 2001;121:347–354. doi: 10.1530/rep.0.1210347. - DOI - PubMed
    1. White-Cooper H., Davidson I. Unique Aspects of Transcription Regulation in Male Germ Cells. Cold Spring Harbor Perspectives in Biology. 2011;3(7):a002626–a002626. doi: 10.1101/cshperspect.a002626. - DOI - PMC - PubMed
    1. Kleene KC. Connecting cis-elements and trans-factors with mechanisms of developmental regulation of mRNA translation in meiotic and haploid mammalian spermatogenic cells. Reproduction. 2013;146:R1–R19. doi: 10.1530/REP-12-0362. - DOI - PubMed

Publication types