. 2018 Jul 20:3:18.
doi: 10.1038/s41525-018-0058-3. eCollection 2018.

Recurrent loss of heterozygosity correlates with clinical outcome in pancreatic neuroendocrine cancer

Affiliations

Recurrent loss of heterozygosity correlates with clinical outcome in pancreatic neuroendocrine cancer

Ben Lawrence et al. NPJ Genom Med. .

Abstract

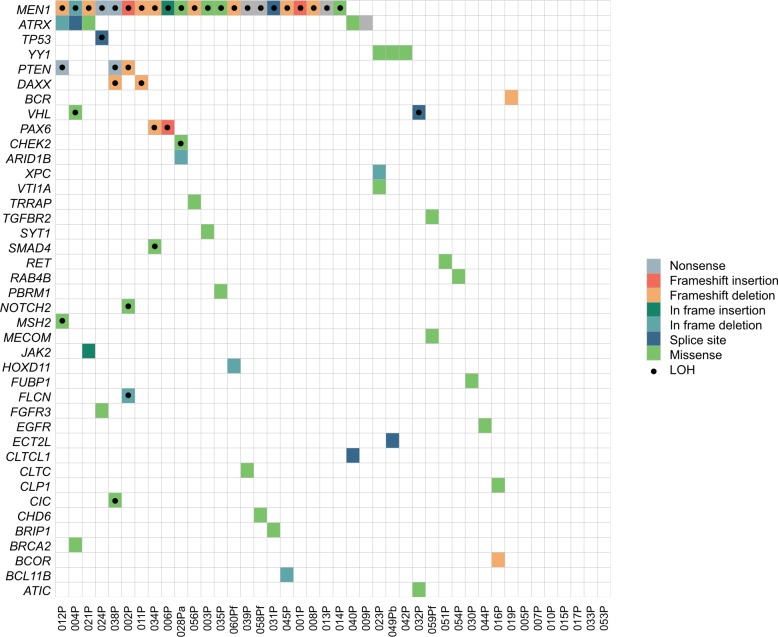
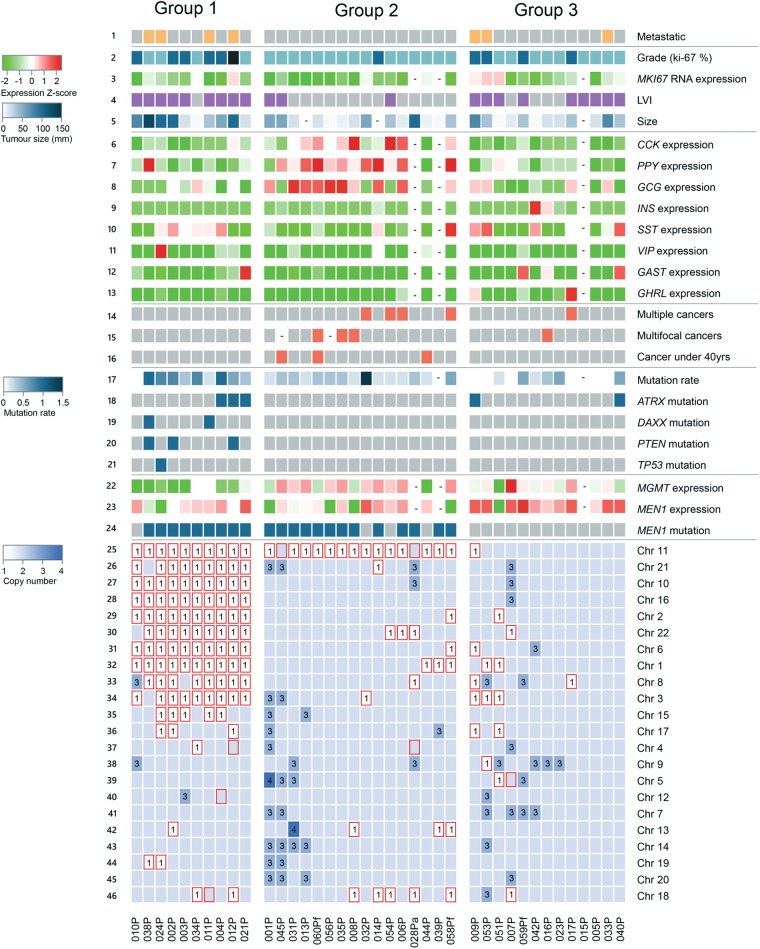
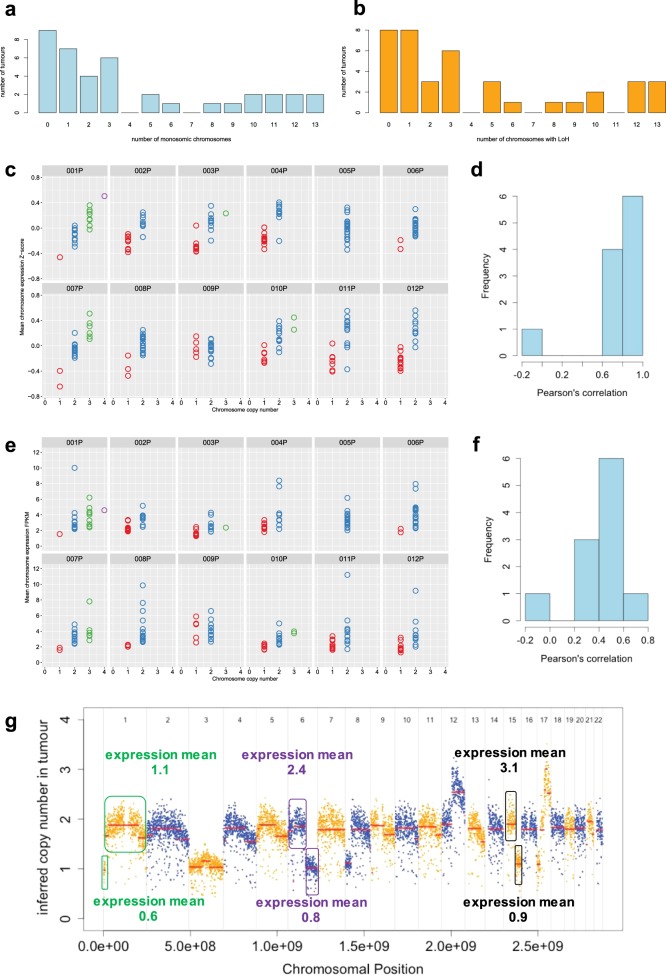
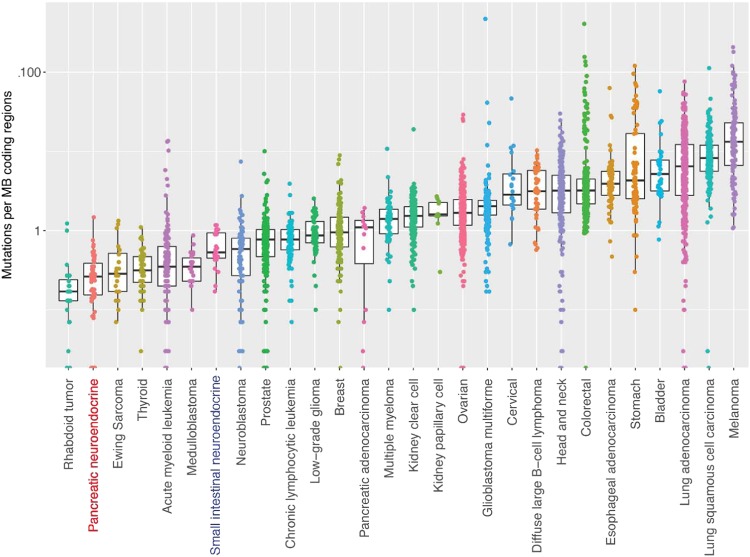
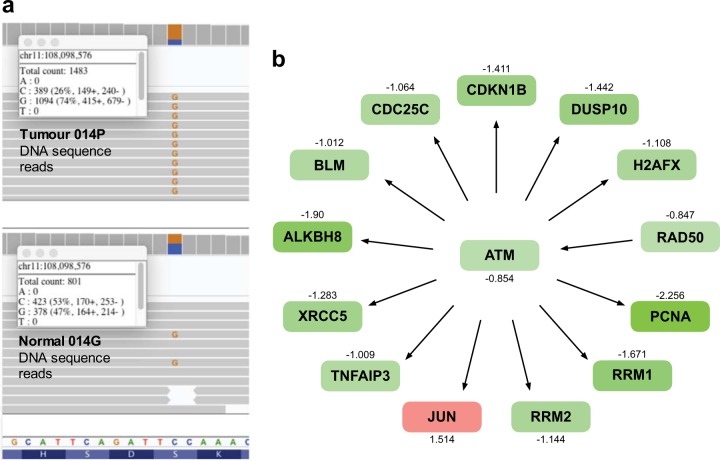
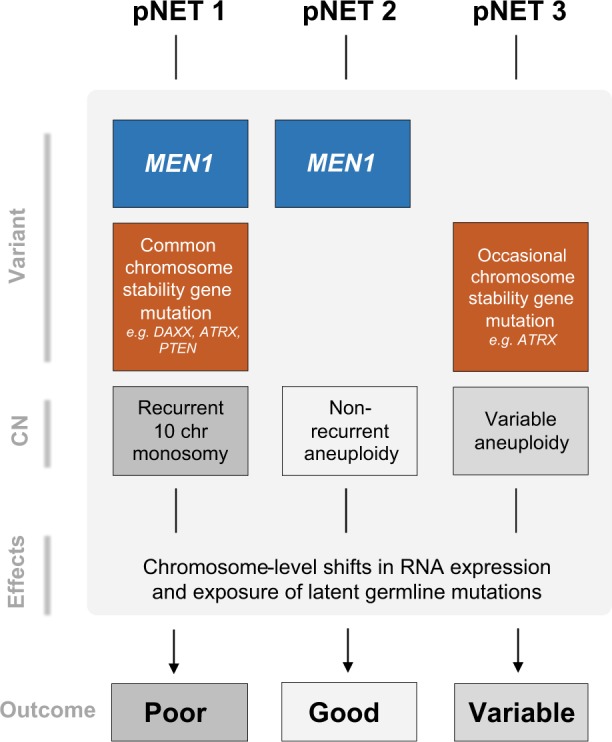
Pancreatic neuroendocrine tumors (pNETs) are uncommon cancers arising from pancreatic islet cells. Here we report the analysis of gene mutation, copy number, and RNA expression of 57 sporadic well-differentiated pNETs. pNET genomes are dominated by aneuploidy, leading to concordant changes in RNA expression at the level of whole chromosomes and chromosome segments. We observed two distinct patterns of somatic pNET aneuploidy that are associated with tumor pathology and patient prognosis. Approximately 26% of the patients in this series had pNETs with genomes characterized by recurrent loss of heterozygosity (LoH) of 10 specific chromosomes, accompanied by bi-allelic MEN1 inactivation and generally poor clinical outcome. Another ~40% of patients had pNETs that lacked this recurrent LoH pattern but had chromosome 11 LoH, bi-allelic MEN1 inactivation, and universally good clinical outcome. The somatic aneuploidy allowed pathogenic germline variants (e.g., ATM) to be expressed unopposed, with RNA expression patterns showing inactivation of downstream tumor suppressor pathways. No prognostic associations were found with tumor morphology, single gene mutation, or expression of RNAs reflecting the activity of immune, differentiation, proliferative or tumor suppressor pathways. In pNETs, single gene mutations appear to be less important than aneuploidy, with MEN1 the only statistically significant recurrently mutated driver gene. In addition, only one pNET in the series had clearly actionable single nucleotide variants (SNVs) (in PTEN and FLCN) confirmed by corroborating RNA expression changes. The two clinically relevant patterns of LoH described here define a novel oncogenic mechanism and a plausible route to genomic precision oncology for this tumor type.


Conflict of interest statement

The authors declare no competing interests.

Figures

Fig. 1
Fig. 1
The mutational landscape of pNETs. Coding region somatic non-synonymous SNVs/indels, large deletions, and intronic mutations within 2 bp of splice sites with any putative functional significance (see Methods) are shown. Tumors are indicated in columns and genes in rows. Colored squares indicate mutation type, with dots indicating that loss of the remaining wild-type allele (LoH) could be confirmed for the locus through changes in both allele frequency of germline heterozygous SNPs and normalized relative regional sequence depth in tumor vs. normal samples. In some tumors, there were no detectable mutations in the 637 genes covered by the targeted sequencing panel
Fig. 2
Fig. 2
The genomic landscape of pNETs is dominated by aneuploidy. Tumors are shown in columns and genomic and pathological features in rows. Row 1: metastatic tumors are shown in orange. Row 2: Ki67 ≤2% (defined here as grade 1) is shown in light blue, Ki67 3–20% (defined as grade 2) in dark blue, and Ki67 >20% (defined as grade 3) in black. Row 3: MKI67 RNA expression Z-score across tumors (green–red color key to left). Dashes indicate that no expression data were available for specific tumors. Row 4 shows the histological identification of lymphovascular invasion (LVI) in purple, tumors without LVI are colored gray. Row 5 shows tumor size (diameter in mm) on a white–blue scale (white–blue color key to left). Rows 6–13 show expression Z-scores across tumors of the following RNAs (green–red color key to left of row 3): CCK, PPY, GCG, INS, SST, VIP, GAST, and GHRL. Rows 14–16 show multiple cancers of any type in the same individual, multifocal pNETs, and pNETs arising at under 40 years of age, respectively, indicated by red boxes. Row 17 shows the number of functionally significant exonic mutations on a white–blue scale (white–blue color key to left). In rows 18–21, blue squares indicate somatic mutations in the four listed genes. Rows 22 and 23 show the expression of MGMT and MEN1 mRNA (Z-scores, green–red color key to left of row 3). Row 24: Somatic mutations in MEN1 are shown in blue. In rows 25–46, coloring of blocks indicates the dominant inferred CN for each autosome in each tumor based on combined information from: ADTEx analysis, relative somatic read counts at germline heterozygous positions and normalized read counts in 3 kb tiles across the genome. LoH (irrespective of CN) is indicated by red boxes. Unmarked blue boxes indicate an inferred chromosome CN of 2 and numerals indicate CN when CN ≠ 2
Fig. 3
Fig. 3
pNET aneuploidy is extensive but varies between tumors. a Histogram shows the number of monosomic chromosomes (i.e., whole chromosome LoH with CN = 1) in individual primary tumors. b Histogram shows the number of chromosomes with LoH (irrespective of CN) in individual primary tumors. c–f Graphs compare whole chromosomal CN (x-axis) to mean chromosomal RNA expression based on c microarray data or e RNAseq data (y-axis). Each panel represents a different tumor and each circle represents a different chromosome in that tumor. Histogram of Pearson correlation between CN and d microarray RNA expression or f RNAseq RNA expression in each tumor. g CN across the genome of the tumor 009P that had negative CN-expression correlation (seen at left of histograms in b and d). This intra-chromosomal analysis confirms the association between CN and RNA expression seen at whole chromosome level in the other pNETs. Chromosomal segments with specific CN aberrations are shown in colored boxes, with mean RNA expression within each of these segments based on fragments per kilobase of transcript per Million mapped reads (FPKM) shown
Fig. 4
Fig. 4
Number of mutations in pNETs. pNETs have relatively low somatic mutation frequency compared to other tumor types; box plots show the coding region mutation rate of pNETs compared to the coding region mutation rates described by Lawrence et al. in other tumors analyzed by WES or WGS
Fig. 5
Fig. 5
Somatic LoH may expose germline heterozygous variants. a Example of a germline heterozygous mutation in the ATM locus that becomes unopposed in the tumor 014P due to somatic LoH. b IPA analysis indicates that in this tumor, expression of numerous RNAs that are normally upregulated by the activity of the ATM complex is generally reduced, suggesting reduced ATM function. Shades of red and green indicate the degree of up- and downregulation of RNAs, respectively, with Z-score expression values shown above or below each node
Fig. 6
Fig. 6
Integrated genomic, pathological, and clinical categorization of pNETs. Genomic features within pNETs identified three groups: Group 1 generally have MEN1 mutation and chromosome 11 loss, sporadic mutation of genes associated with chromosomal instability, recurrent loss of ten specific chromosomes leading to extensive disruption of gene expression, and reduced MGMT expression. These genomic features are strongly associated with high tumor grade and size, LVI, and more frequent metastases. Group 2 have MEN1 mutation and chromosome 11 loss but no recurrent loss of ten chromosomes. They have universally low tumor grade, size, and LVI, many express GCG RNA, and importantly, this group have no metastases. Group 3 are characterized by no MEN1 mutation, with variable aneuploidy, clinical and pathological features

References

    1. Lawrence B, et al. The epidemiology of gastroenteropancreatic neuroendocrine tumors. Endocrinol. Metab. Clin. North Am. 2011;40:1–18. doi: 10.1016/j.ecl.2010.12.005. - DOI - PubMed
    1. Strosberg JR, et al. First-line chemotherapy with capecitabine and temozolomide in patients with metastatic pancreatic endocrine carcinomas. Cancer. 2011;117:268–275. doi: 10.1002/cncr.25425. - DOI - PMC - PubMed
    1. Strosberg J, et al. Phase 3 trial of (177)Lu-Dotatate for midgut neuroendocrine tumors. N. Engl. J. Med. 2017;376:125–135. doi: 10.1056/NEJMoa1607427. - DOI - PMC - PubMed
    1. Raymond E, et al. Sunitinib malate for the treatment of pancreatic neuroendocrine tumors. N. Engl. J. Med. 2011;364:501–513. doi: 10.1056/NEJMoa1003825. - DOI - PubMed
    1. Yao JC, et al. Everolimus for advanced pancreatic neuroendocrine tumors. N. Engl. J. Med. 2011;364:514–523. doi: 10.1056/NEJMoa1009290. - DOI - PMC - PubMed