. 2018 Jun 28:4:7.
doi: 10.1038/s41420-018-0069-y. eCollection 2018.

Subtype-specific response of retinal ganglion cells to optic nerve crush

Affiliations

Subtype-specific response of retinal ganglion cells to optic nerve crush

S Daniel et al. Cell Death Discov. .

Erratum in

Abstract

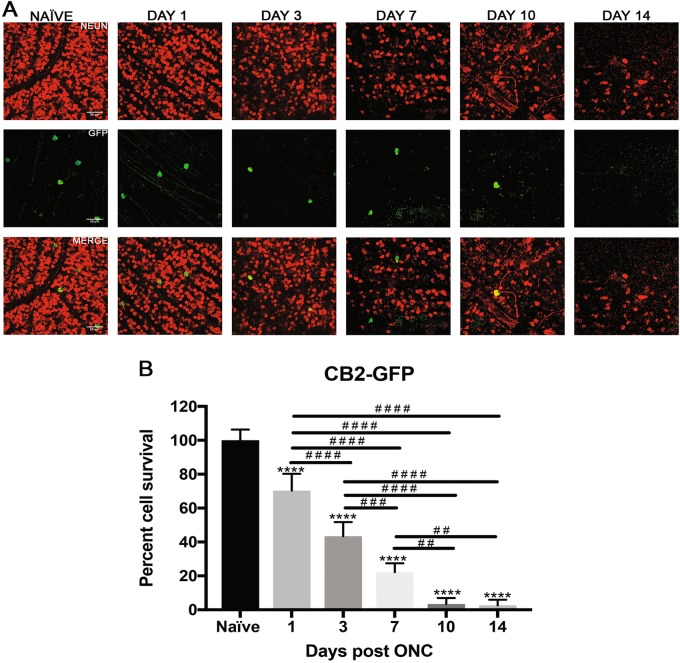
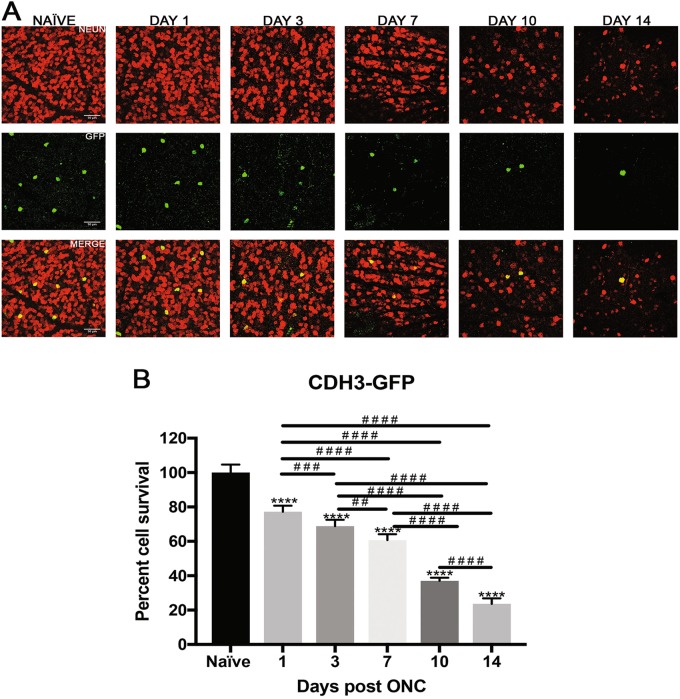
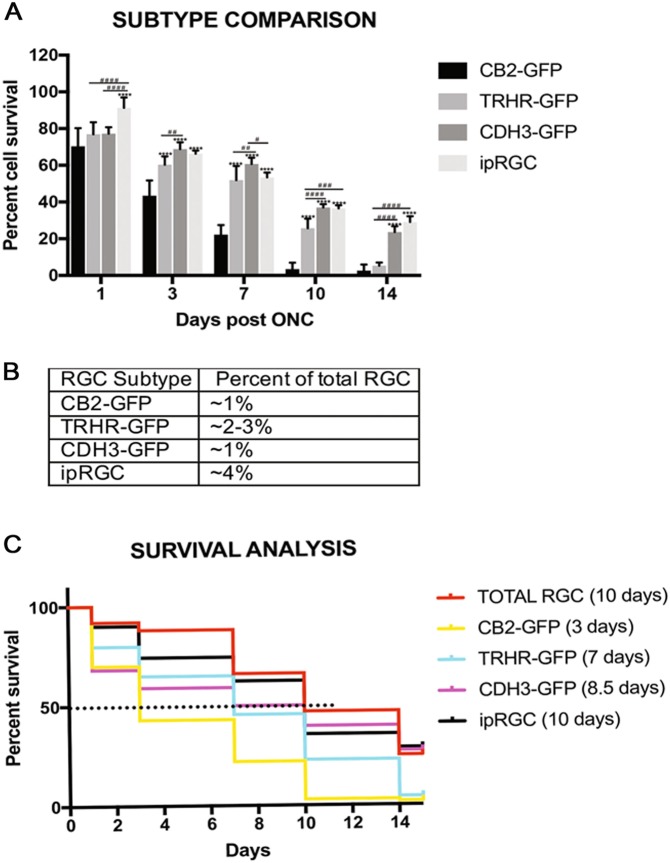
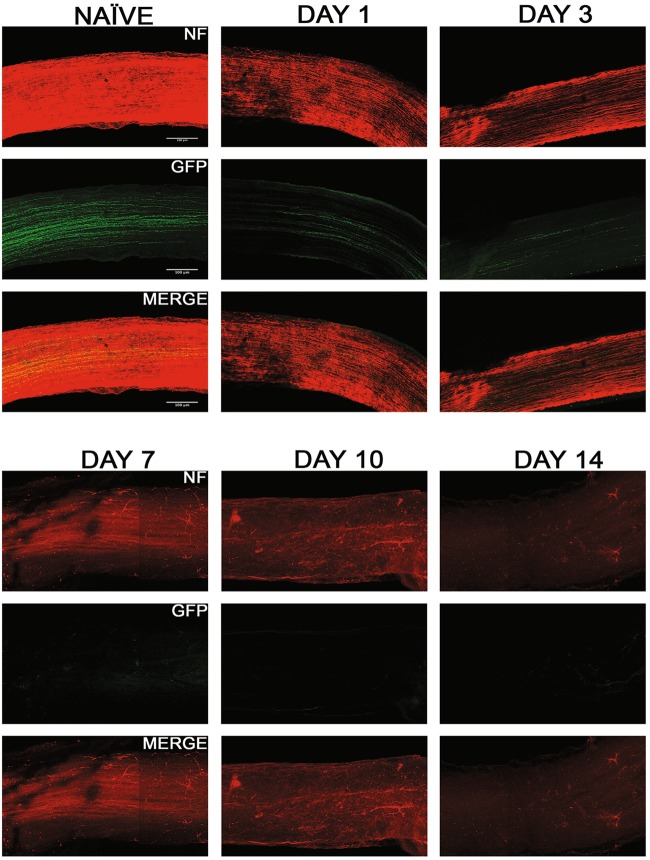
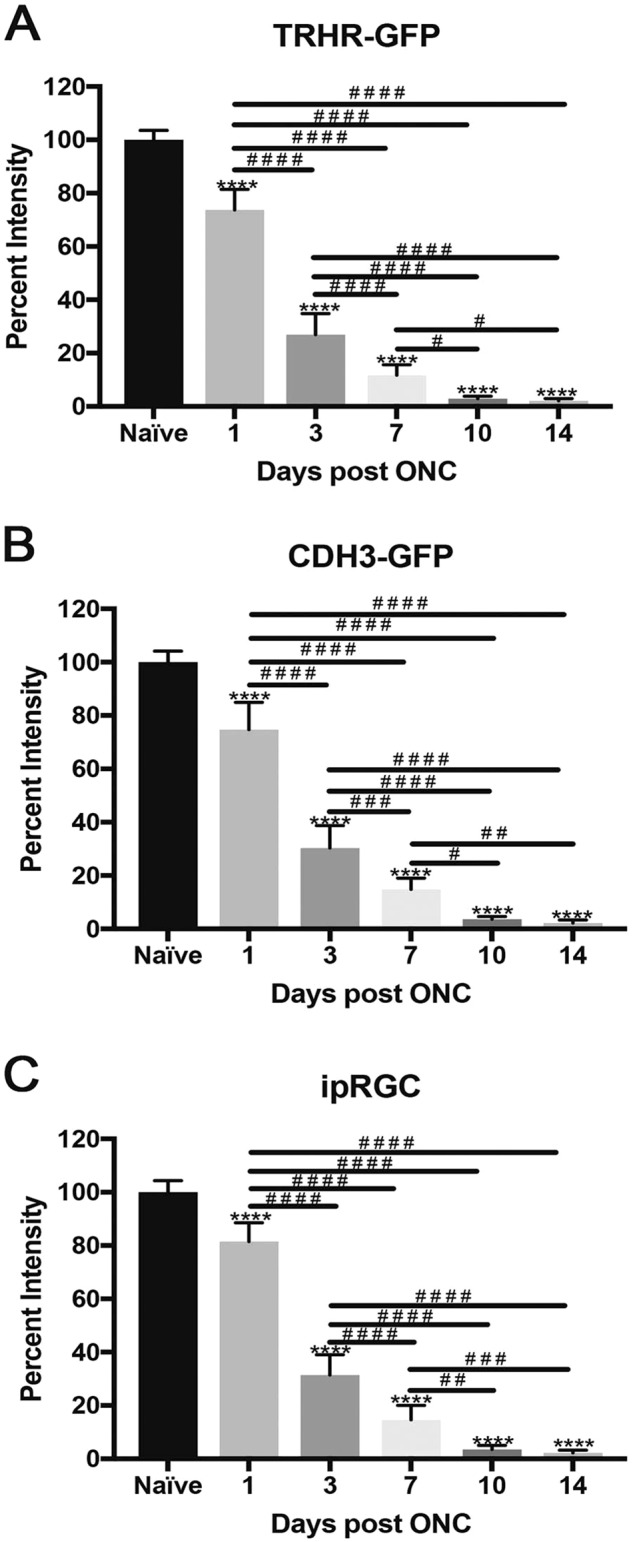
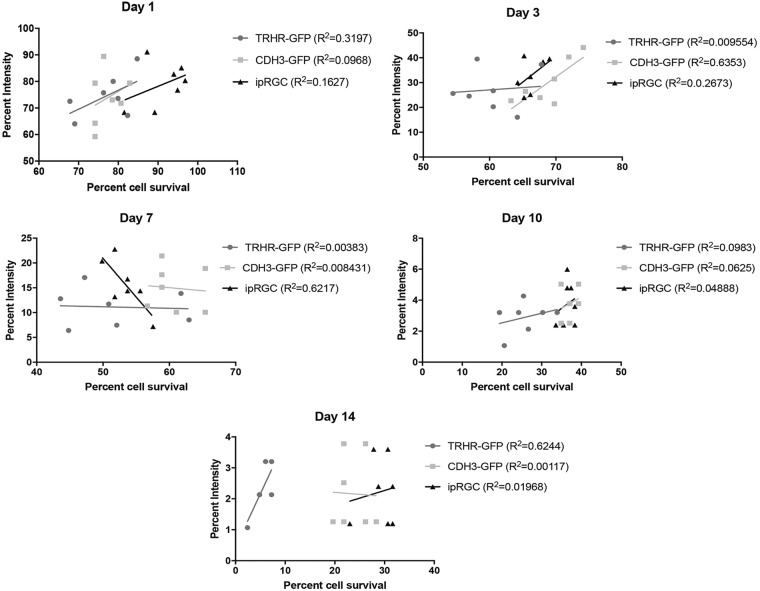
Glaucoma is a neurodegenerative disease with retinal ganglion cell (RGC) loss, optic nerve degeneration and subsequent vision loss. There are about 30 different subtypes of RGCs whose response to glaucomatous injury is not well characterized. The purpose of this study was to evaluate the response of 4 RGC subtypes in a mouse model of optic nerve crush (ONC). In this study, we also evaluated the pattern of axonal degeneration in RGC subtypes after nerve injury. We found that out of the 4 subtypes, transient-Off α RGCs are the most susceptible to injury followed by On-Off direction selective RGCs (DSGC). Non-image forming RGCs are more resilient with ipRGCs exhibiting the most resistance of them all. In contrast, axons degenerate irrespective of their retinal soma after ONC injury. In conclusion, we show that RGCs have subtype specific cell death response to ONC injury and that RGC axons disintegrate in an autonomous fashion undergoing Wallerian degeneration. These discoveries can further direct us towards effective diagnostic and therapeutic approaches to treat optic neuropathies, such as glaucoma.


Conflict of interest statement

The authors declare that they have no conflict of interest.

Figures

Fig. 1
Fig. 1. Comparison of total RGC loss after ONC.
Percent cell survival of total RGCs between each strain within each time point shows no significant differences, by Two Way-ANOVA and Tukey’s post hoc test
Fig. 2
Fig. 2. Effect of ONC injury on CB2-GFP RGCs.
a Representative images showing NeuN (red) and GFP (green) immunolabeled retinal flat-mounts from transgenic CB2-GFP mice. Images of ONC (1 day, 3 days, 7 days, 10 days and 14 days post injury) and naïve control eyes are shown. Scale bar = 50 μm. b Percent cell survival of CB2-GFP RGCs. There was a steady decline in cell survival throughout the time course with significant cell loss at each time point when normalized to naïve. The values are represented as mean ± SD (n = 4–5). (* comparison to naïve, # comparison between time points). ****, # # # # p < 0.0001, # # p = 0.002, # # # p = 0.0005 by One Way-ANOVA and Tukey’s post hoc test
Fig. 3
Fig. 3. Effect of ONC injury on TRHR-GFP RGCs.
a Representative images showing NeuN (red) and GFP (green) immunolabeled retinal flat-mounts from transgenic TRHR-GFP mice. Images of ONC (1 day, 3 days, 7 days, 10 days and 14 days post injury) and naïve control eyes are shown. Scale bar = 50 μm. b Percent cell survival of TRHR-GFP RGCs. There was significant decline in cell survival through the 14-day time course when normalized to naïve. The values are represented as mean ± SD (n = 7). (* Comparison to naïve, # comparison between time points). # # # #, **** p < 0.0001, # p = 0.3 by One Way-ANOVA and Tukey’s post hoc test
Fig. 4
Fig. 4. Effect of ONC injury on CDH3-GFP RGCs.
a Representative images showing NeuN (red) and GFP (green) immunolabeled retinal flat-mounts from transgenic CDH3-GFP mice. Images of both ONC (1 day, 3 days, 7 days, 10 days and 14 days post injury) and naïve control eyes are shown. Scale bar = 50 μm. b Percent cell survival of CDH3-GFP RGCs. There was significant decline in cell survival through the 14-day time course when normalized to naïve. The values are represented as mean ± SD (n = 7). (* comparison to naïve, # comparison between time points). ****, 7# # # # p < 0.0001, ***, # # # p = 0.0009, # # p = 0.001 by One Way-ANOVA and Tukey’s post hoc test
Fig. 5
Fig. 5. Effect of ONC injury on ipRGCs.
a Representative images showing NeuN (red) and Mel (melanopsin) (green) immunolabeled retinal flat-mounts from C57BL/6 mice. Images of both ONC (1 day, 3 days, 7 days, 10 days and 14 days post injury) and naïve control eyes are shown. Scale bar = 50 μm. b Percent cell survival of ipRGCs. There was significant decline in cell survival through the 14-day time course, normalized to naïve. The values are represented as mean ± SD (n = 7). (* comparison to naïve, # comparison between time points). *** p = 0.0002, ****, # # # # p < 0.0001, # # p = 0.001, by One Way-ANOVA and Tukey’s post hoc test
Fig. 6
Fig. 6. Comparison of RGC survival between strains.
a There are varying degrees of differences in cell survival between subtypes within each time point. The values are represented as mean ± SD (n = 4–7). (* Comparison with CB2-GFP strain at each time point, # comparison between strains at each time point). ****, # # # # p < 0.0001, # # # p = 0.0002, # # p = 0.002, # p = 0.01 by Two Way-ANOVA and Tukey’s post hoc test. b Percent population of RGC subtypes out of the total RGC population in a mouse retina. c Survival curves of total as well as subtype specific RGCs show differences in median survival (Day post crush where 50% of the cells survive) marked by dotted line at Y = 50 by Kaplan–Meier plot
Fig. 7
Fig. 7. Axonal degeneration after ONC in TRHR-RGC neurons.
Representative 3D images of tissue cleared optic nerve showing NF (neurofilament) (red) and GFP (green) immunolabeled whole optic nerves from TRHR-GFP mice. Images of ONC (1 day, 3 days, 7 days, 10 days and 14 days post injury) and naïve control nerves are shown (n = 7). Scale bar = 100 μm
Fig. 8
Fig. 8. Axonal degeneration after ONC in CDH3-RGC neurons.
Representative 3D images of tissue cleared optic nerve showing NF (neurofilament) (red) and GFP (green) immunolabeled whole optic nerves from CDH3-GFP mice. Images of ONC (1 day, 3 days, 7 days, 10 days and 14 days post injury) and naïve control nerves are shown (n = 7). Scale bar = 100 μm
Fig. 9
Fig. 9. Axonal degeneration after ONC in ipRGC neurons.
Representative 3D images of tissue cleared optic nerve showing NF (neurofilament) (red) and MEL (melanopsin) (green) immunolabeled whole optic nerves from C57BL/6 mice. Images of ONC (1 day, 3 days, 7 days, 10 days and 14 days post injury) and naïve control nerves are shown(n = 7). Scale bar = 100 μm
Fig. 10
Fig. 10. Comparison of axonal degeneration in RGC subtypes post ONC.
There was significant decline in fluorescent intensity of axons of each subtype through the 14-day time course, normalized to naïve. The values are represented as mean ± SD (n = 7). (* Comparison with naïve, # comparison between time points). a Percent intensity of TRHR-RGC axons post ONC. ****, # # # # p < 0.0001, # p = 0.02, by One Way-ANOVA and Tukey’s post hoc test. b Percent intensity of CDH3-RGC axons post ONC. ****, # # # # p < 0.0001, # # p = 0.004, # p = 0.01 by One Way-ANOVA and Tukey’s post hoc test. c Percent intensity of ipRGC axons post ONC. ****, # # # # p < 0.0001, # # # p = 0.007, # # p = 0.003 by One Way-ANOVA and Tukey’s post hoc test
Fig. 11
Fig. 11. Comparison of axonal degeneration between strains.
a Representative single plane images of optic axons labeled with neurofilament (NF) showing axons undergoing Wallerian degeneration after ONC injury. The uninjured naïve optic nerve axons have fiber-like appearance whereas the axons post ONC injury degenerate into beads on a string as prominently evident in day 10 and day 14 images. b Percent intensity of total RGCs between each strain within each time point shows no significant differences, by Two Way-ANOVA and Tukey’s post hoc test. c There are also no differences in intensities between subtypes within each time point except at day 1. The values are represented as mean ± SD (n = 4–7). (* Comparison with TRHR-GFP strain) * p = 0.02, by Two Way-ANOVA and Tukey’s post hoc test
Fig. 12
Fig. 12. Correlation of cell survival to axonal degeneration.
Scatter plots at 1 day, 3 days, 7 days, 10 days, and 14 days post injury. The plots show no correlation between cell survival and axonal degeneration of RGC subtypes at each time point. Lines per graph represent linear regression with their respective R2 values

References

    1. Weinreb RN, Aung T, Medeiros FA. The pathophysiology and treatment of glaucoma: a review. JAMA. 2014;311:1901–1911. doi: 10.1001/jama.2014.3192. - DOI - PMC - PubMed
    1. Davis BM, Crawley L, Pahlitzsch M, Javaid F, Cordeiro MF. Glaucoma: the retina and beyond. Acta Neuropathol. 2016;132:807–826. doi: 10.1007/s00401-016-1609-2. - DOI - PMC - PubMed
    1. Clark AF, Pang IH. Advances in glaucoma therapeutics. Expert. Opin. Emerg. Drugs. 2002;7:141–163. doi: 10.1517/14728214.7.1.141. - DOI - PubMed
    1. Dikopf MS, Vajaranant TS, Edward DP. Topical treatment of glaucoma: established and emerging pharmacology. Expert. Opin. Pharmacother. 2017;18:885–898. doi: 10.1080/14656566.2017.1328498. - DOI - PMC - PubMed
    1. Daliri K, Ljubimov AV, Hekmatimoghaddam S. Glaucoma, stem cells, and gene therapy: where are we now? Int. J. StemCells. 2017;10:119–128. doi: 10.15283/ijsc17029. - DOI - PMC - PubMed

LinkOut - more resources