. 2018 Jul 23:4:17.
doi: 10.1038/s41420-018-0083-0. eCollection 2018.

Mitochondrial dynamics regulates Drosophila intestinal stem cell differentiation

Affiliations

Mitochondrial dynamics regulates Drosophila intestinal stem cell differentiation

Hansong Deng et al. Cell Death Discov. .

Erratum in

Abstract

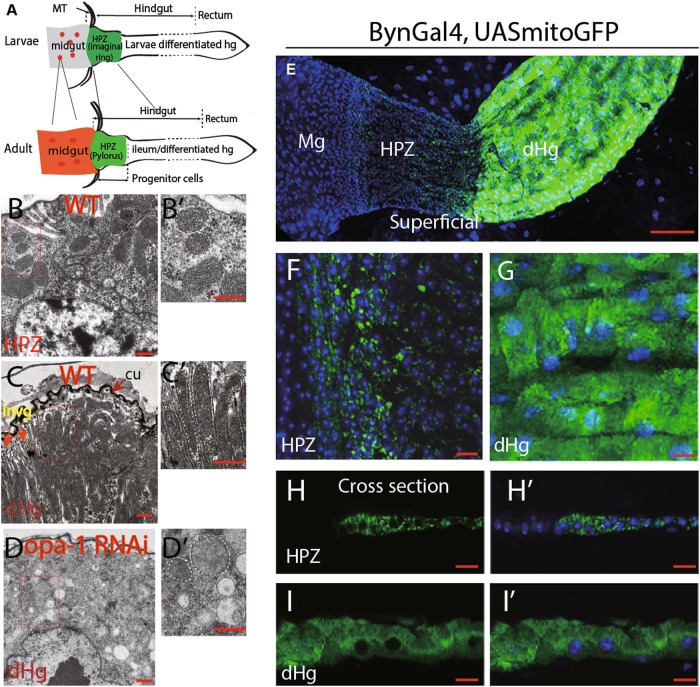
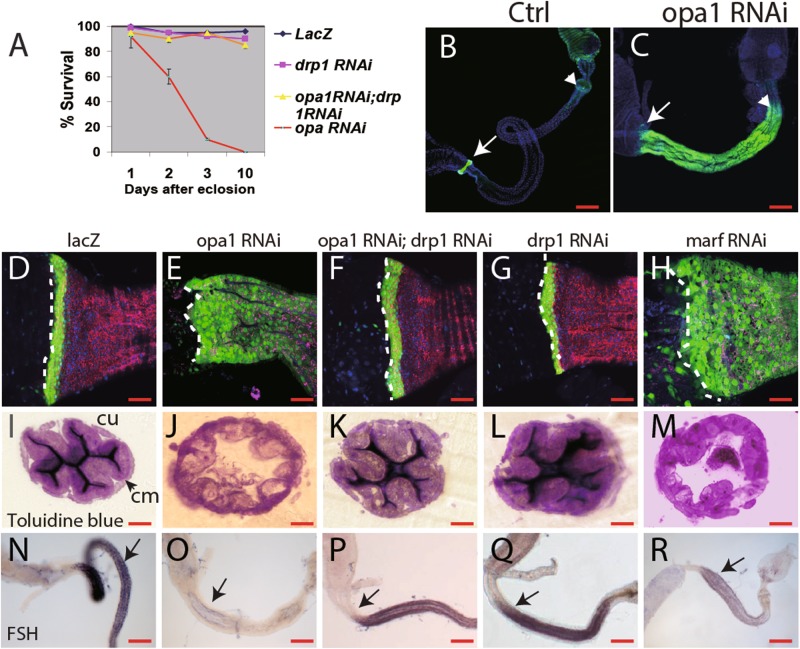
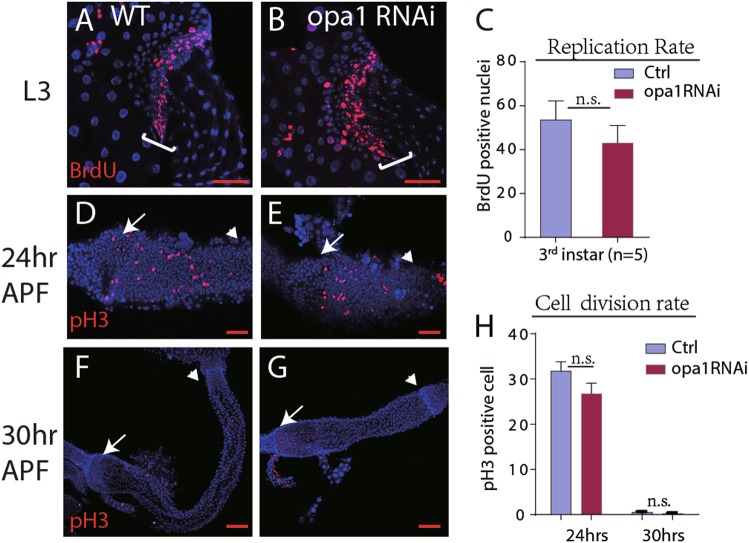
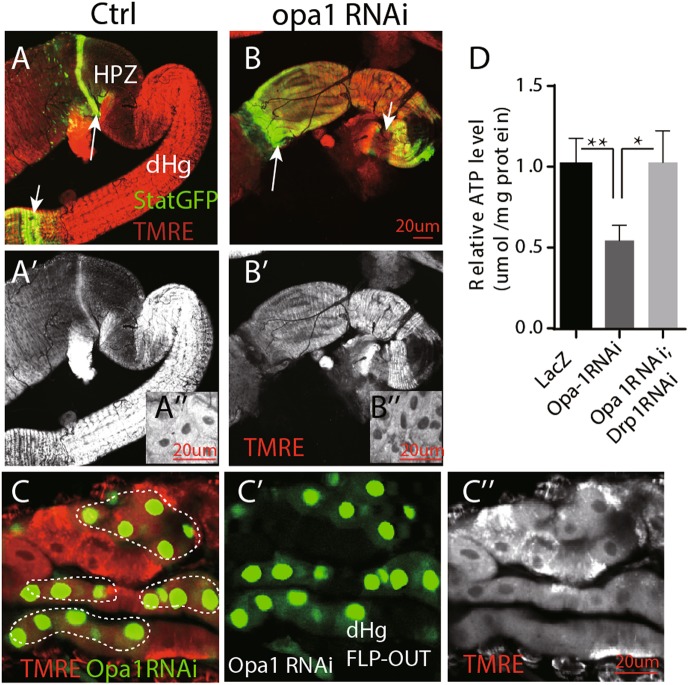
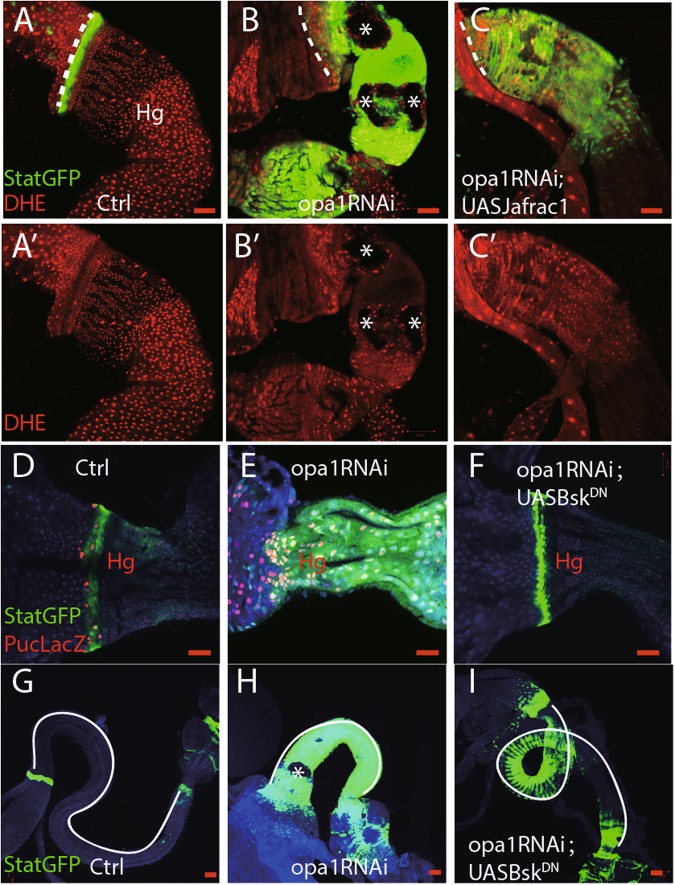
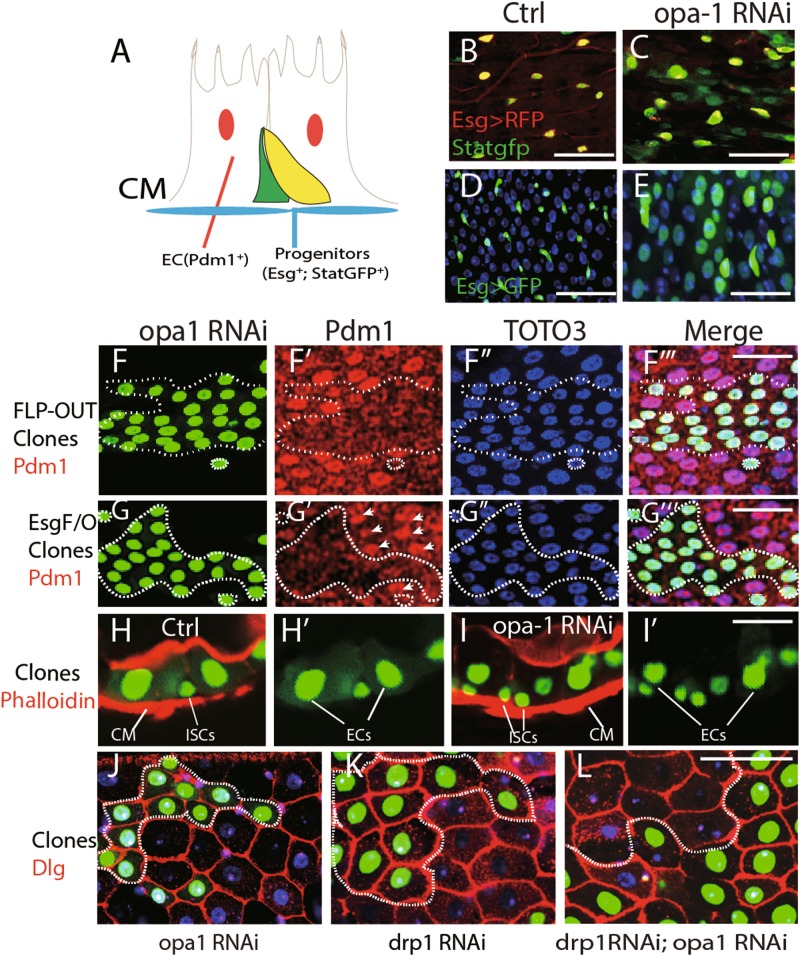
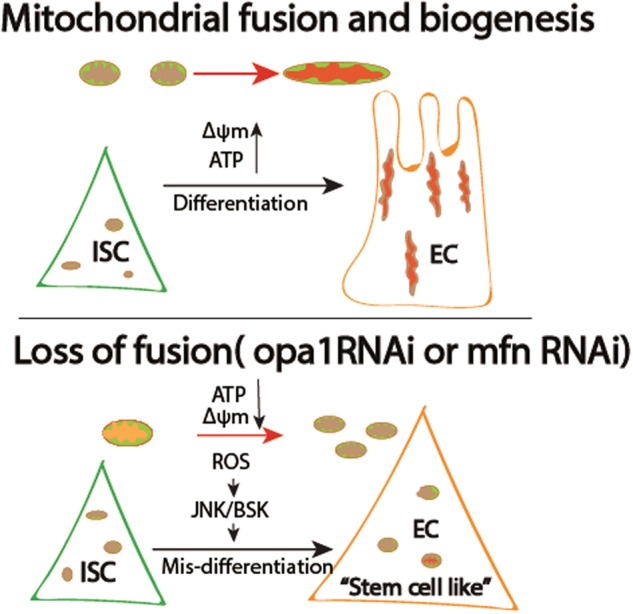
Differentiation of stem/progenitor cells is associated with a substantial increase in mitochondrial mass and complexity. Mitochondrial dynamics, including the processes of fusion and fission, plays an important role for somatic cell reprogramming and pluripotency maintenance in induced pluripotent cells (iPSCs). However, the role of mitochondrial dynamics during stem/progenitor cell differentiation in vivo remains elusive. Here we found differentiation of Drosophila intestinal stem cell is accompanied with continuous mitochondrial fusion. Mitochondrial fusion defective(opa1RNAi) ISCs contain less mitochondrial membrane potential, reduced ATP, and increased ROS level. Surprisingly, suppressing fusion also resulted in the failure of progenitor cells to differentiate. Cells did not switch on the expression of differentiation markers, and instead continued to show characteristics of progenitor cells. Meanwhile, proliferation or apoptosis was unaffected. The differentiation defect could be rescued by concomitant inhibition of Drp1, a mitochondrial fission molecule. Moreover, ROS scavenger also partially rescues opa1RNAi-associated differentiation defects via down-regulating JNK activity. We propose that mitochondrial fusion plays a pivotal role in controlling the developmental switch of stem cell fate.


Conflict of interest statement

The authors declare that they have no conflict of interest.

Figures

Fig. 1
Fig. 1. Extensive mitochondrial fusion during hindgut differentiation and opa-1 RNAi inhibit the fusion process.
a Schematic representation of gut development in Drosophila. Progenitors in the larvae stage give rise to the adult gut including its stem cell/progenitor populations. Midgut and hindgut are connected through Malpighian tubes (MT). During early metamorphosis, the progenitor populations expand over the larval gut, which undergoes programmed cell death. For instance, in the midgut, adult midgut progenitors (AMPs, denoted in red dots) in the larvae stage generate adult gut and stem cells (red dots). Similarly, hindgut proliferative zone (HPZ) cells (also called as hindgut imaginal ring, denoted in green) in the larvae stage generates the whole adult hindgut (green), including a subset of progenitors in the anterior hindgut (adult HPZ/Pylorus) and the differentiated hindgut (also called as ileum). Please refer to the main text for details. Mitochondria morphology of hindgut cells in different regions was observed by TEM from b to d and by confocal microscopy from e to i. b Mitochondria in adult HPZ cells. Note that the HPZ cells identity was based on the physical location and their unique morphology. c Mitochondria in adult differentiated cells. The matured enterocytes form a thick layer of cuticle structure (“cu” in brief) toward the lumen. Mitochondria aligned with membrane invigination (“invg” in brief). d Mitochondria in BynGal4>opa1 RNAi adult differentiated cells. For bd, higher magnification of rectangle area shown on the right in b′–d′. Mitochondrial borders are marked with dashed lines. Cu cuticle, invg invigination, dHg differentiated hindgut, MT Malpighian tubes. ei Mitochondria morphology visualized by byn-GAL4 > UAS-mito-GFP under confocal microscopy. f (HPZ domain) and g (differentiation hindgut, dHg) are higher magnification of e. hh′ and ii′ are cross-sectional view of HPZ and dHg cells, respectively. From e to i, TOTO3 labels nuclei in blue. Scale bars: 200 µm in bd, 100 µm for e, 20 µm for fi
Fig. 2
Fig. 2. Enterocytes mis-differentiation induced by inhibiting mitochondrial fusion through opa1 or marf RNAi in the hindgut can be rescued by drp1 RNAi.
a Survival curve of adult flies through knock down opa-1 (red), drp1 (green), both opa-1 and drp1 (yellow) or ctrl (blue) specifically in the hindgut by byn-GAL4. Y-axis is the survival percentage. X-axis is days after hatching out, at least 100 mated females counted for each genotype. b, c Short hindgut caused by opa1 RNAi. Hindguts are highlighted between the arrow and arrowhead. Arrow marks the boundary of the midgut and the hindgut and the arrowhead marks the boundary of the hindgut and the rectum. Green signal is Stat-GFP. dh The Opa1RNAi hindgut shows extensive expansion of a progenitor marker, Stat-GFP (green), cell membrane labeled by myr-RFP (red). The boundary between the midgut and the hindgut are outlined by dashed lines. Nuclei stained by TOTO3 in blue in all images. im Cellular structure of hindgut enterocytes stained by Toluidine blue. Circular muscle (“cm” in short) and cuticle (“cu” in short) are pointed in arrows. nr In situ hybridization of FSH, a gene specifically transcribed in normal differentiated cells, as shown in n, dramatically decreased in opa1 RNAi (o) or marf RNAi (r). FSH signal is largely restored by drp1 RNAi (p). Scale bar for b, c and nr is 200 µm, 40 µm for dm
Fig. 3
Fig. 3. Stem/progenitor cell proliferation is largely unaffected by opa1RNAi.
ac Replication rate was measured by BrdU feeding in stage-matched third larvae. Representative images are shown as a (ctrl) and b (opa1 RNAi). The HPZ zone is outlined with a white bracket. Quantification shown in c. No statistical significance was found, n = 5. dh Proliferation rate was indicated by pH3-positive nuclei in larvae hindgut in 24 h APF (d, e) and 30 h APF (f, g). d and f are the Controls; e and g are opa-1 RNAi larvae. Quantification shown in h. No statistical significance was found, n = 6. Error bars represent standard deviation (STDEV) in c and h. Arrows pointed to the boundary of the midgut and the hindgut, and TOTO3 stained nuclei in blue. Scale bar for 100 µm
Fig. 4
Fig. 4. Mitochondrial defects induced by inhibiting mitochondrial fusion through opa1RNAi in hindgut.
a, b TMRE staining in freshly dissected adult hindgut. Note wild-type enterocytes (“En” in short) have much higher fluorescent staining than cells in the HPZ domain. a′ and b′ are separate TMRE channels. a‴ and b‴ are higher magnified image of rectangle area in a′ and b′, respectively. The arrows point to the boundary of midgut and hindgut. The arrowheads denote the boundary of the hindgut and the rectum. c Opa1 RNAi clones in the adult hindgut have much lower membrane potential by TMRE staining. Clones are marked by dashed lines. c′ and c″ are separate GFP and TMRE channel, respectively. Genotype: hsFLP; UASGFP; Tub < tub80 > GAL4/opa1 RNAi. d Quantification of a relative ATP level of isolated hindguts with different genotypes: Ctrl, opa1 RNAi, and opa1 RNAi; drp1 RNAi. Error bars represent standard deviation (STDEV). Scale bar is 20 µm
Fig. 5
Fig. 5. ROS–JNK pathway contribute to differentiation defects in opa1RNAi hindguts.
ac DHE staining of freshly dissected hindgut. a′–c′ are DHE channel. Asterisk denotes potentially non-apoptotic cell death in opa1RNAi hindguts. df Anti-beta Gal staining against Puc-LacZ in different genotypes. gi Differentiation index, such as Stat::GFP and gut length, was compared in different conditions. Gut length was delineated out by white lines. Scale bar is 20 µm
Fig. 6
Fig. 6. Inhibiting mitochondrial fission also impairs midgut enterocyte differentiation.
a Schematic view of cell types in the adult posterior midgut. Basal located progenitor cells (green) are Esg and Stat-GFP positive. Enlarged enterocytes can be labeled by differentiation marker Pdm1. CM is the brief for circular muscle. Both circular muscle and actin enriched microvilli in enterocytes can be stained by Phalloidin. b, c Ectopic Stat-GFP-positive cells (green) in the opa-1 RNAi midgut. The progenitor cells in the normal midgut are labeled with membrane-bound UAS-myr-RFP driven by Esg-GAL4. d, e Massive enterocyte-like cells are Esg positive (green) in the opa-1 RNAi midgut. In normal midgut, Esg-positive diploid cells are labeled by esg-GAL4; UASGFP (d). f Opa-1 RNAi Flp-out clones induced in the larvae stage have less Pdm-1 expression in the adult midgut. GFP-positive clones are outlined with dashed lines. f, f′, f″, and f‴ are GFP, Pdm1, TOTO3, and Merged channel, respectively. g Opa-1 RNAi clones induced in the adult stage have less Pdm-1 expression in the adult midgut. GFP-positive clones are marked with dashed lines. g, g′, g″, and g‴ are GFP, Pdm1, TOTO3, and Merged channel, respectively. h, i Mis-differentiation of enterocytes in opa1 RNAi clones. Circular muscle is “CM” in short. Actin enriched microvilli and circular muscles are stained with phalloidin in red. h′ and i′ are GFP channel of h and i, respectively. jl Enterocytes in opa1 RNAi clones are smaller in size. GFP-positive clones are labeled with dashed lines. The cell boundary was stained with Dlg in red. TOTO3 labels nuclei in blue. Scale bar is 20 µm. Genotype for f and i: hsFLP; UASGFP; Tub < tub80 > GAL4/opa1 RNAi. Genotype for g: hsFLP; esg-GAL4, UASGFP, TubGAL80;ts Tub < tub80 > GAL4/opa1 RNAi Genotype for h: hsFLP; UASGFP; Tub < tub80 > GAL4 Genotype for k: hsFLP; UASGFP; Tub < tub80 > GAL4/drp1 RNAi Genotype for l: hsFLP; UASGFP; Tub < tub80 > GAL4/drp1 RNAi, opa1 RNAi
Fig. 7
Fig. 7. Model on mitochondrial fission-mediated differentiation failure in Drosophila intestine stem cells.
Proliferative cells, including Drosophila intestine stem cells in this scenario, bearing hypo-active, smaller and fewer mitochondria with having a relative lower membrane potential (marked in purple). Hence, self-renewal is largely independent on mitochondria function. During differentiation, mitochondria continuously undergo fusion and biogenesis to cope with the energy demand. Correspondingly, mitochondria became more active (marked in bright red). Meanwhile, mitochondria may send some retrograde signals, such as ROS, ATP, and/or some unknown molecules back to nucleus to program the differentiation process. On the other hand, loss of fusion by opa-1 RNAi or marf RNAi causes mis-differentiation of progenitor cells. The “prospective” differentiated cells are much smaller and still express progenitor marker (statGFP) but not differentiated marker (FSH). Loss of fusion can block production

References

    1. Schieke SM, et al. Mitochondrial metabolism modulates differentiation and teratoma formation capacity in mouse embryonic stem cells. J. Biol. Chem. 2008;283:28506–28512. doi: 10.1074/jbc.M802763200. - DOI - PMC - PubMed
    1. Varum S, et al. Enhancement of human embryonic stem cell pluripotency through inhibition of the mitochondrial respiratory chain. Stem Cell Res. 2009;3:142–156. doi: 10.1016/j.scr.2009.07.002. - DOI - PMC - PubMed
    1. Prigione A, Fauler B, Lurz R, Lehrach H, Adjaye J. The senescence-related mitochondrial/oxidative stress pathway is repressed in human induced pluripotent stem cells. Stem Cells. 2010;28:721–733. doi: 10.1002/stem.404. - DOI - PubMed
    1. Rehman J. Empowering self-renewal and differentiation: the role of mitochondria in stem cells. J. Mol. Med. (Berl.) 2010;88:981–986. doi: 10.1007/s00109-010-0678-2. - DOI - PMC - PubMed
    1. Prieto J, et al. Dysfunctional mitochondrial fission impairs cell reprogramming. Cell Cycle. 2016;15:3240–3250. doi: 10.1080/15384101.2016.1241930. - DOI - PMC - PubMed

LinkOut - more resources