. 2018 Jul 26:4:20.
doi: 10.1038/s41420-018-0085-y. eCollection 2018.

Role of RAC3 coactivator in the adipocyte differentiation

Affiliations

Role of RAC3 coactivator in the adipocyte differentiation

María Cecilia Lira et al. Cell Death Discov. .

Erratum in

Abstract

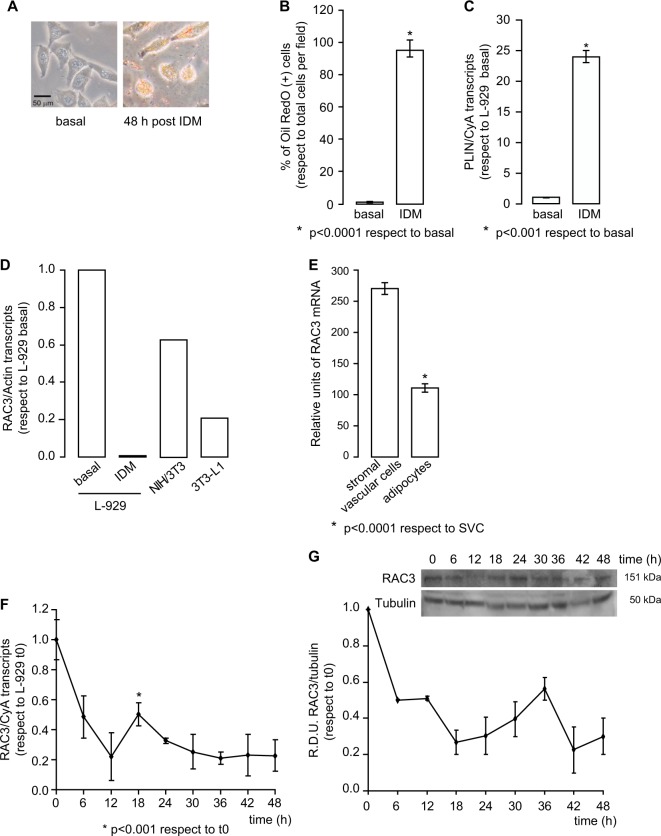
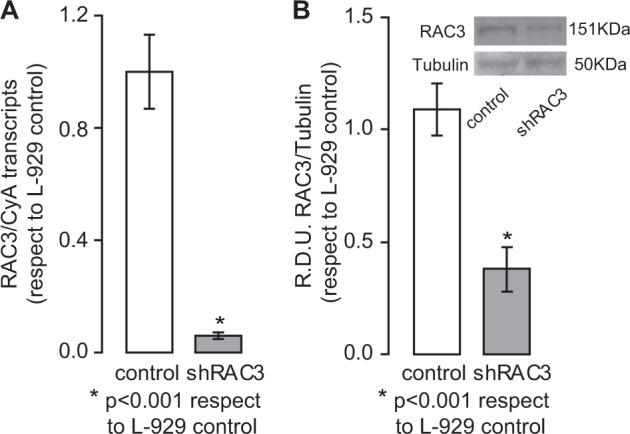
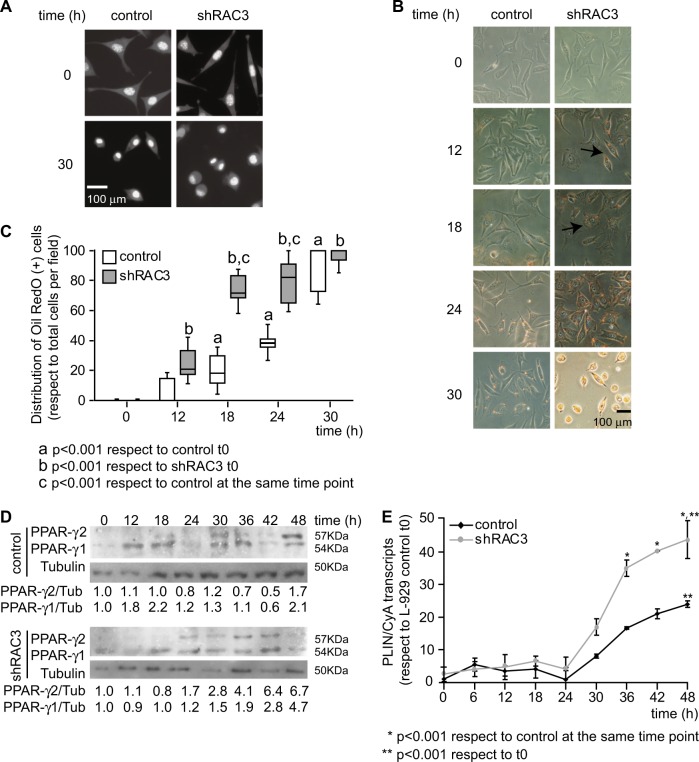
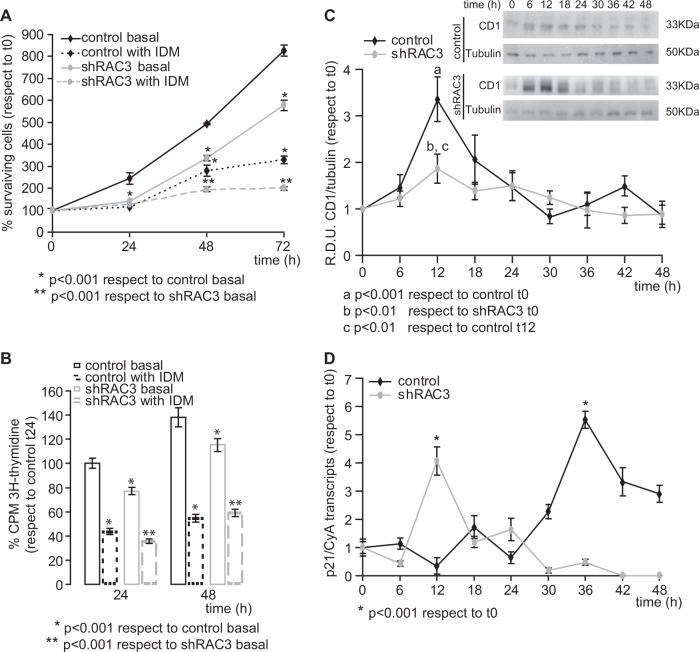
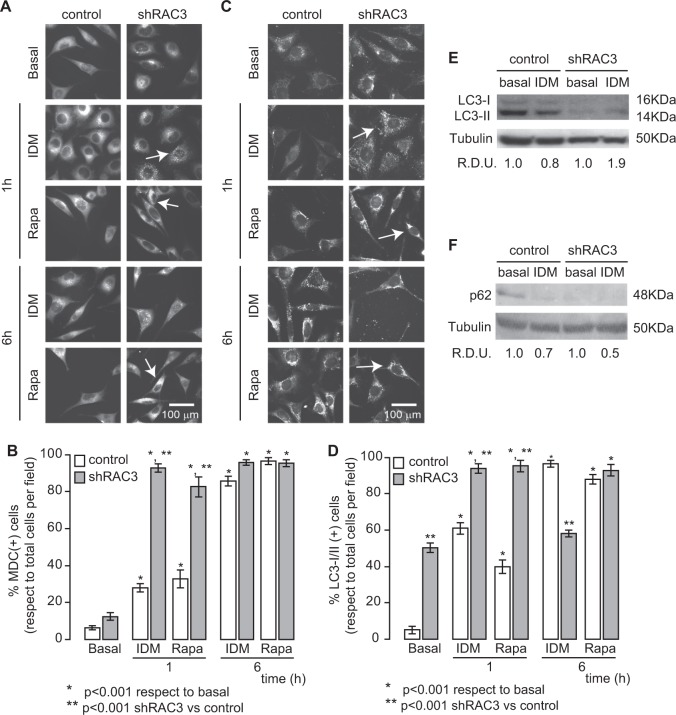
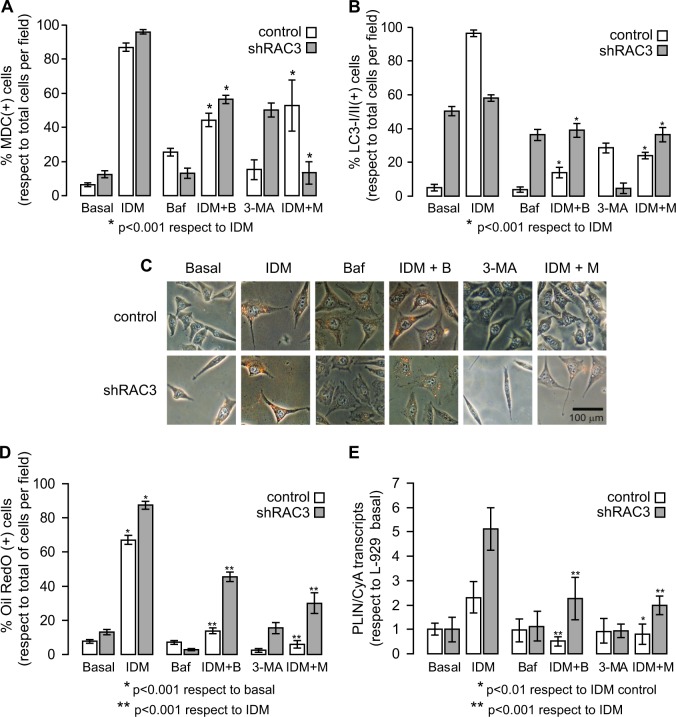
RAC3 is a member of the p160 family of steroid receptor coactivators and it is highly expressed in several human cancers, contributing to enhanced cell proliferation and cellular transformation. In this work, we have studied the role of RAC3 in adipogenesis in L-929 cells. Adipogenesis is a highly regulated process, involving cell cycle arrest and changes in the gene expression pattern required for morphological remodelling. We found that RAC3 expression levels are downregulated during adipocyte differentiation induced by specific stimulus. In addition, cells constitutively expressing low levels of RAC3 (shRNA), showed enhanced adipocyte differentiation which was evidenced by the early detection of the adipocyte markers Perilipin, PPARγ and Oil Red O staining. Moreover, RAC3 downregulation favoured cell arrest and autophagy. Early and late autophagy inhibitors blocked adipocyte differentiation in control cells, but partially inhibited shRAC3 differentiation, demonstrating that although autophagy is required for adipogenesis, additional signals could be trigged by RAC3 downregulation. We conclude that RAC3 is a key regulator of adipogenesis, since its downregulation generates the cellular arrest and autophagic responses that are required steps for this process.


Conflict of interest statement

The authors declare that they have no conflict of interest.

Figures

Fig. 1
Fig. 1. IDM induces L-929 adipocyte differentiation.
a Representative images of the L-929 cell line stimulated or not with IDM for 48 h. Cells were stained with Oil Red O. b Diagram bars correspond to percentage of Oil Red O positive cells per field (at least 10 fields per sample). Student test was performed (n = 3), *p < 0.0001 with respect to basal condition. c Perilipin (PLIN) mRNA expression in basal condition or 48 h post induction with IDM was determined by qPCR and normalized with Cyclophilin A (CyA) mRNA. Student test was performed (n = 3), *p < 0.001 with respect to basal condition. d RAC3 expression levels were evaluated by qPCR in L-929 cells in basal conditions or 48 h post IDM treatment, NIH/3T3 and 3T3-L1 cells, and were normalized to Actin mRNA. e RAC3 expression levels of stromal vascular cells (SVC) and adipocytes from murine epididymal tissue were compared. The diagram bars show the average ± SD of mRNA expression log-transformed values from GSE65557 data bank *p < 0.0001 with respect to SVC. f, g Temporal RAC3 expression levels, after IDM treatment, were analysed by f qPCR or g western blot. f Each point corresponds to average ± SD of RAC3 mRNA expression obtained by qPCR and normalized to CyA mRNA, *p < 0.001 with respect to t0. g Western blot was performed to determine RAC3 protein levels, relative densitometry units (RDU) correspond to the densitometry unit with respect to Tubulin expression. Inset corresponds to representative immunoblot
Fig. 2
Fig. 2. Validation of the decrease in RAC3 expression levels.
a, b Analysis were performed to validate knockdown efficiency of shRAC3. a RAC3 mRNA expression was determined by qPCR and was normalized to CyA mRNA expression. Student test (n = 3), *p < 0.001 with respect to control L-929 cells. b Anti-RAC3 western blot analysis; RDU correspond to the average of densitometry unit with respect to Tubulin expression. The diagram bars correspond to RDU average ± SD of five independent experiments from protein extracts of cells at different post-selection passage. Inset: representative immunoblot. Student test (n = 5), *p < 0.001 with respect to control cells
Fig. 3
Fig. 3. The decrease of RAC3 expression accelerates the expression of adipocyte molecular markers.
a Representative photographs of Hoechst 33342 staining in basal condition or at 30 h post induction with IDM. b Light microscopy photographs of control and shRAC3 L-929 cell lines in basal conditions or stimulated with IDM at different times, were stained with Oil Red O. The arrow shows positive Oil Red O staining of lipid droplets. c Diagram bars correspond to percentage of Oil Red O positive cells per field (at least 10 fields per sample). Statistical analysis ANOVA and Tukey post-test of three independent experiments were performed, a and b p < 0.001 with respect to control and shRAC3 cells in basal conditions, respectively; and c p < 0.001 with respect to control cells at the same time point. d PPARγ 1/2 levels were evaluated by western blot. RDU correspond to densitometry unit with respect to Tubulin expression. e Temporal modulation of PLIN expression in control and shRAC3 L-929 cells after adipocyte differentiation. ANOVA (n = 3) *p < 0.001 with respect to control at the same time point and ** p < 0.001 with respect to t0
Fig. 4
Fig. 4. RAC3 downregulation is required for induction of cell arrest.
a, b Cell viability was determined by a crystal violet staining or b tritiated thymidine uptake assays in control and shRAC3 L-929 cells treated or not with IDM at different times. Curves and diagram bars represent the average ± SD percentage of surviving cells with respect to 0 h (n = 3), * and **p < 0.001 with respect to control and shRAC3 L-929 cells in basal conditions, respectively. c, d Temporal modulation of Cyclin D1 (CD1) (c) and p21 (d) expression levels in control and shRAC3 L-929 cells after adipocyte differentiation induction. c CD1 protein levels were evaluated by western blot at different time points after IDM stimulation, curves represent RDU corresponding to the average of densitometry units with respect to Tubulin expression, (n = 3) a p < 0.001 with respect to control L-929 cells in basal conditions, b p < 0.01 with respect to shRAC3 L-929 cells in basal conditions and c p < 0.01 with respect to control L-929 cells at 12 h post induction. Inset corresponds to representative immunoblot. d p21 mRNA was evaluated by qPCR and normalized to CyA mRNA expression. Curves represent the average ± SD of three independent experiments, *p < 0.001 with respect to basal condition
Fig. 5
Fig. 5. IDM induces autophagy.
ad Control and shRAC3 L-929 cells were seeded in 24-well plates with slices and, after 24 h, cells were stimulated with IDM or Rapamycin (Rapa 0.5 μM). a, b Autophagy was evaluated by staining with monodansylcadaverine (MDC) or c, d immunofluorescence using an anti-LC3-I/II antibody and an anti-rabbit coupled to FITC antibody after 1 or 6 h post treatment. The arrows show MDC or LC3-I/II positive vesicles, respectively. b, d Diagram bars correspond to percentage of MDC or LC3-I/II positive cells per field (at least 10 fields per sample). Statistical analysis ANOVA and Tukey post-test n = 3 were performed, *p < 0.001 with respect to basal condition, **p < 0.001 with respect to control L-929 cells. e, f LC3-I/II (e) and p62 (f) levels were determined by western blot after 90 min post IDM treatment. RDU correspond to the average of densitometry unit with respect to Tubulin expression
Fig. 6
Fig. 6. Effect of autophagy inhibitors over adipocyte differentiation.
a, b Control and shRAC3 L-929 cells were seeded in 24-well plates with slices and, after 24 h, cells were treated or not with Bafilomycin A (Baf 5 nM) or 3-Methyladenine (3-MA 0.5 mM) plus IDM. Diagram bars correspond to the percentage of MDC (a) or LC3-I/II (b) positive cells per field (at least 10 fields per sample). Statistical analysis ANOVA and Tukey post-test n = 3 were performed, *p < 0.001 with respect to IDM treatment. c Representative images of control and shRAC3 L-929 cells, dyed with Oil Red O, in basal conditions or stimulated with autophagy inhibitors in presence or absence of IDM for 30 h. d Diagram bars correspond to the percentage of Oil Red O positive cells per field (at least 10 fields per sample). Statistical analysis ANOVA and Tukey post-test of three independent experiments were performed, *p < 0.001 with respect to basal condition and **p < 0.001 with respect to IDM treatment. e PLIN expression in control and shRAC3 L-929 cells at 30 h after treatment with Baf or 3-MA plus IDM. ANOVA (n = 3), *p < 0.01 IDM + 3-MA treatment in control cells with respect to IDM treatment and **p < 0.001 IDM plus autophagy inhibitors treatment with respect to IDM treatment

References

    1. Trayhurn P, Beattie JH. Physiological role of adipose tissue: white adipose tissue as an endocrine and secretory organ. Proc. Nutr. Soc. 2001;60:329–339. doi: 10.1079/PNS200194. - DOI - PubMed
    1. Fruhbeck G, Gomez-Ambrosi J, Muruzabal FJ, Burrell MA. The adipocyte: a model for integration of endocrine and metabolic signaling in energy metabolism regulation. Am. J. Physiol. Endocrinol. Metab. 2001;280:E827–E847. doi: 10.1152/ajpendo.2001.280.6.E827. - DOI - PubMed
    1. Vona-Davis L, Rose DP. Adipokines as endocrine, paracrine, and autocrine factors in breast cancer risk and progression. Endocr. Relat. Cancer. 2007;14:189–206. doi: 10.1677/ERC-06-0068. - DOI - PubMed
    1. Mancuso P. The role of adipokines in chronic inflammation. Immunotargets Ther. 2016;5:47–56. doi: 10.2147/ITT.S73223. - DOI - PMC - PubMed
    1. Weisberg SP, et al. Obesity is associated with macrophage accumulation in adipose tissue. J. Clin. Invest. 2003;112:1796–1808. doi: 10.1172/JCI200319246. - DOI - PMC - PubMed

LinkOut - more resources