

Life cycle environmental emissions and health damages from the Canadian healthcare system: An economic-environmental-epidemiological analysis
- PMID: 30063712
- PMCID: PMC6067712
- DOI: 10.1371/journal.pmed.1002623
Life cycle environmental emissions and health damages from the Canadian healthcare system: An economic-environmental-epidemiological analysis
Abstract
Background: Human health is dependent upon environmental health. Air pollution is a leading cause of morbidity and mortality globally, and climate change has been identified as the single greatest public health threat of the 21st century. As a large, resource-intensive sector of the Canadian economy, healthcare itself contributes to pollutant emissions, both directly from facility and vehicle emissions and indirectly through the purchase of emissions-intensive goods and services. Together these are termed life cycle emissions. Here, we estimate the extent of healthcare-associated life cycle emissions as well as the public health damages they cause.
Methods and findings: We use a linked economic-environmental-epidemiological modeling framework to quantify pollutant emissions and their implications for public health, based on Canadian national healthcare expenditures over the period 2009-2015. Expenditures gathered by the Canadian Institute for Health Information (CIHI) are matched to sectors in a national environmentally extended input-output (EEIO) model to estimate emissions of greenhouse gases (GHGs) and >300 other pollutants. Damages to human health are then calculated using the IMPACT2002+ life cycle impact assessment model, considering uncertainty in the damage factors used. On a life cycle basis, Canada's healthcare system was responsible for 33 million tonnes of carbon dioxide equivalents (CO2e), or 4.6% of the national total, as well as >200,000 tonnes of other pollutants. We link these emissions to a median estimate of 23,000 disability-adjusted life years (DALYs) lost annually from direct exposures to hazardous pollutants and from environmental changes caused by pollution, with an uncertainty range of 4,500-610,000 DALYs lost annually. A limitation of this national-level study is the use of aggregated data and multiple modeling steps to link healthcare expenditures to emissions to health damages. While informative on a national level, the applicability of these findings to guide decision-making at individual institutions is limited. Uncertainties related to national economic and environmental accounts, model representativeness, and classification of healthcare expenditures are discussed.
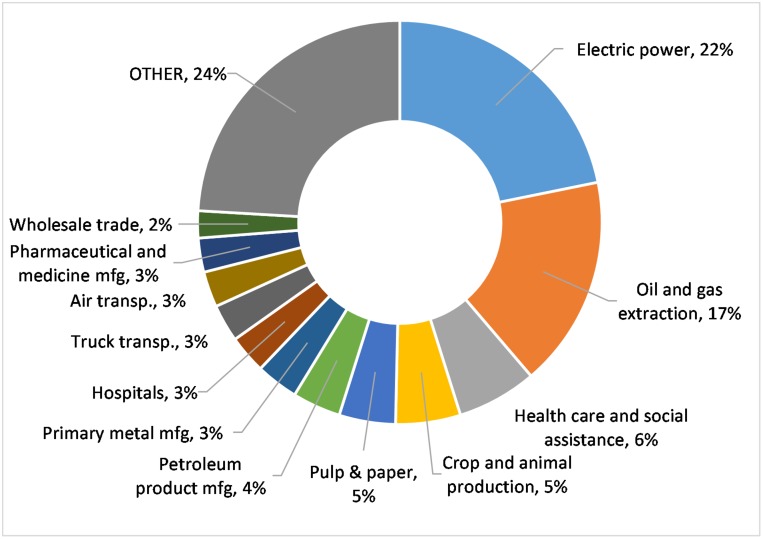
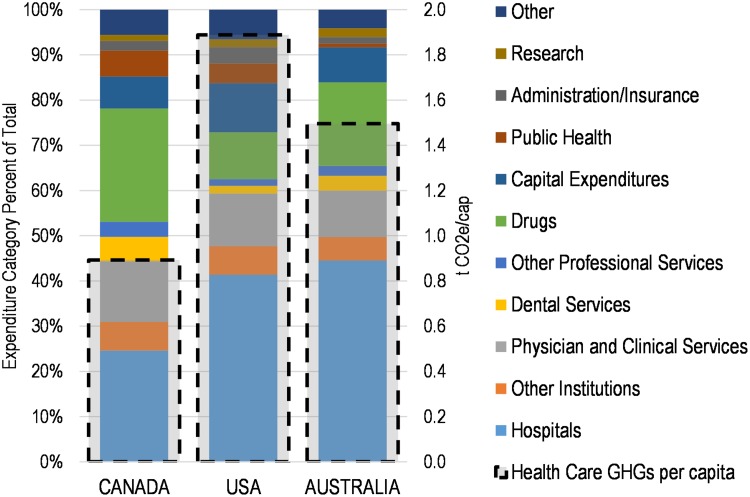
Conclusions: Our results for GHG emissions corroborate similar estimates for the United Kingdom, Australia, and the United States, with emissions from hospitals and pharmaceuticals being the most significant expenditure categories. Non-GHG emissions are responsible for the majority of health damages, predominantly related to particulate matter (PM). This work can guide efforts by Canadian healthcare professionals toward more sustainable practices.
Conflict of interest statement
The authors have declared that no competing interests exist.
Figures
References
-
- World Health Organization. Burden of disease from Ambient Air Pollution for 2012. Geneva: 2014. http://www.who.int/gho/phe/outdoor_air_pollution/burden_text/en/.
-
- Cohen AJ, Brauer M, Burnett R, Anderson HR, Frostad J, Estep K, et al. Estimates and 25-year trends of the global burden of disease attributable to ambient air pollution: an analysis of data from the Global Burden of Diseases Study 2015. Lancet. 2017;389(10082): 1907–18. 10.1016/S0140-6736(17)30505-6 - DOI - PMC - PubMed
-
- World Health Organization. Quantitative risk assessment of the effect of climate change on selected causes of death, 2030s and 2050s. Geneva: 2014. http://www.who.int/globalchange/publications/quantitative-risk-assessmen....
MeSH terms
Substances
LinkOut - more resources
Full Text Sources
Other Literature Sources
Medical
Research Materials
