

HIV and TB co-infection in the ART era: CD4 count distributions and TB case fatality in Cape Town
- PMID: 30064368
- PMCID: PMC6069570
- DOI: 10.1186/s12879-018-3256-9
HIV and TB co-infection in the ART era: CD4 count distributions and TB case fatality in Cape Town
Abstract
Background: In Cape Town, the roll-out of antiretroviral therapy (ART) has increased over the last decade with an estimated coverage of 63% of HIV- positive patients in 2013. The influence of ART on the characteristics of the population of HIV-positive patients presenting to the primary care TB programme is unknown. In this study, we examined trends in CD4 count distribution, ART usage and treatment outcomes among HIV-positive TB patients in Cape Town from 2009 to 2013.
Methods: Data from the electronic TB register on all newly registered drug-sensitive TB patients ≥18 years were analyzed retrospectively. Descriptive statistics were used to compare baseline characteristics, the CD4 count distribution and TB treatment outcomes both by year of treatment and ART status at the start of TB treatment. Survival analyses were used to assess the change in mortality risk during TB treatment over time, stratified by ART status at start of TB treatment.
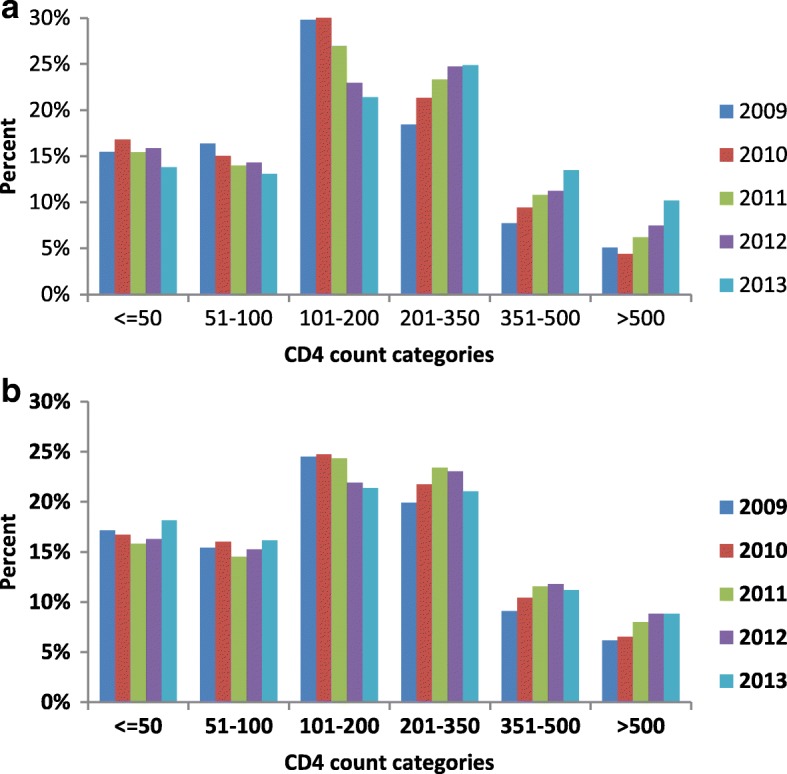
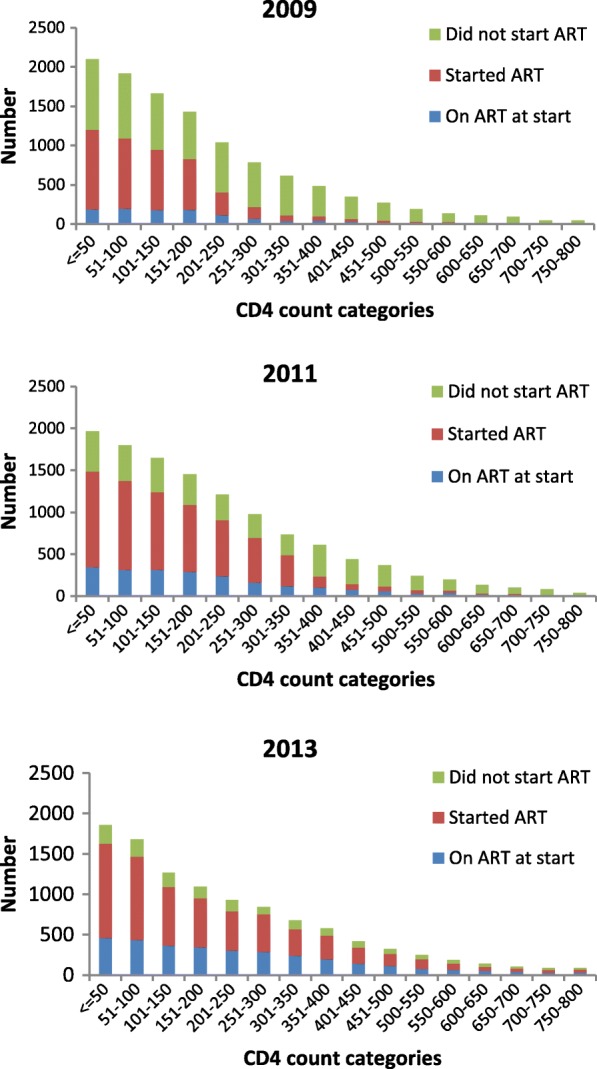
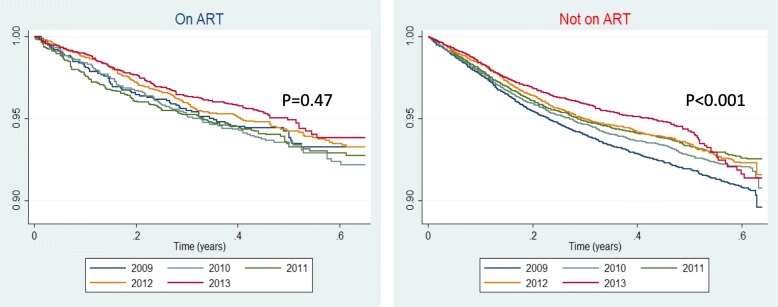
Results: 118,989 patients were treated over 5 years. HIV prevalence among TB patients decreased from 50.9% in 2009 to 49.0% in 2013. The absolute number of HIV-positive TB cases declined by 13.2% between 2010 and 2013. More patients entered the TB programme on ART in 2013 compared to 2009 (30.0% vs 9.9%). Among these, the CD4 count distribution showed a year by year shift to higher CD4 counts. In 2013, over 75% of ART-naïve TB patients still had a CD4 count < 350 cells/mm3. ART initiation among ART-naive patients increased from 37.0 to 77.7% and TB case fatality declined from 7.4 to 5.2% (p < 0.001). In multivariate analysis a decrease in TB mortality was most strongly associated with CD4 count (Adjusted HR 0.82 per increase of 50 cells/mm3, 95% CI: 0.81-0.83, p < 001) and the initiation of ART during TB treatment (Adjusted HR 0.39, 95% CI: 0.35-0.42, p < 0.001).
Conclusion: Comprehensive changes in the ART and TB treatment programmes resulted in incremental increases in ART coverage for HIV-positive TB patients and a subsequent decrease in TB case fatality due to increased ART uptake in HIV-positive ART-naïve patients. However TB still remained a major presenting opportunistic infection with the majority of cases occurring at low CD4 counts.
Keywords: Antiretroviral therapy; CD4 count; HIV; Mortality; TB case fatality; Tuberculosis.
Conflict of interest statement
Ethics approval and consent to participate
The Cape Town City Health Directorate approved the use of an anonymised database of routinely collected TB data for this analysis. As the data used in this analysis were collected as part of the routine monitoring and evaluation of the South African National TB programme, patients were not requested to provide informed consent for the use of their data. Confidentiality was ensured through the removal of patient identifiers prior to the analysis. The use of this data for the study was approved by the University of Cape Town Research Ethics Committee (HREC Ref Number 800/2014).
Consent for publication
N/A
Competing interests
The authors declare that they have no competing interests
Publisher’s Note
Springer Nature remains neutral with regard to jurisdictional claims in published maps and institutional affiliations.
Figures
References
-
- 2015 Global Tuberculosis Report, 20th Edition, World Health Organisation. http://apps.who.int/iris/bitstream/handle/10665/191102/9789241565059_eng.... Accessed 19 July 2018.
-
- Suthar AB, Lawn SD, del Amo J, Getahun H, Dye C, Sculier D, Sterling TR, Chaisson RE, Williams BG, Harries AD, et al. Antiretroviral therapy for prevention of tuberculosis in adults with HIV: a systematic review and meta-analysis. PLoS Med. 2012;9(7):e1001270. doi: 10.1371/journal.pmed.1001270. - DOI - PMC - PubMed
MeSH terms
Substances
Grants and funding
LinkOut - more resources
Full Text Sources
Other Literature Sources
Medical
Molecular Biology Databases
Research Materials
