. 2018 Jul 31;17(1):102.
doi: 10.1186/s12938-018-0535-z.

Wound healing of human embryonic stem cell-derived retinal pigment epithelial cells is affected by maturation stage

Affiliations

Wound healing of human embryonic stem cell-derived retinal pigment epithelial cells is affected by maturation stage

Amna E Abu Khamidakh et al. Biomed Eng Online. .

Abstract

Background: Wound healing of retinal pigment epithelium (RPE) is a complex process that may take place in common age-related macular degeneration eye disease. The purpose of this study was to evaluate whether wounding and wound healing has an effect on Ca2+ dynamics in human embryonic stem cell (hESC)-RPEs cultured different periods of time.

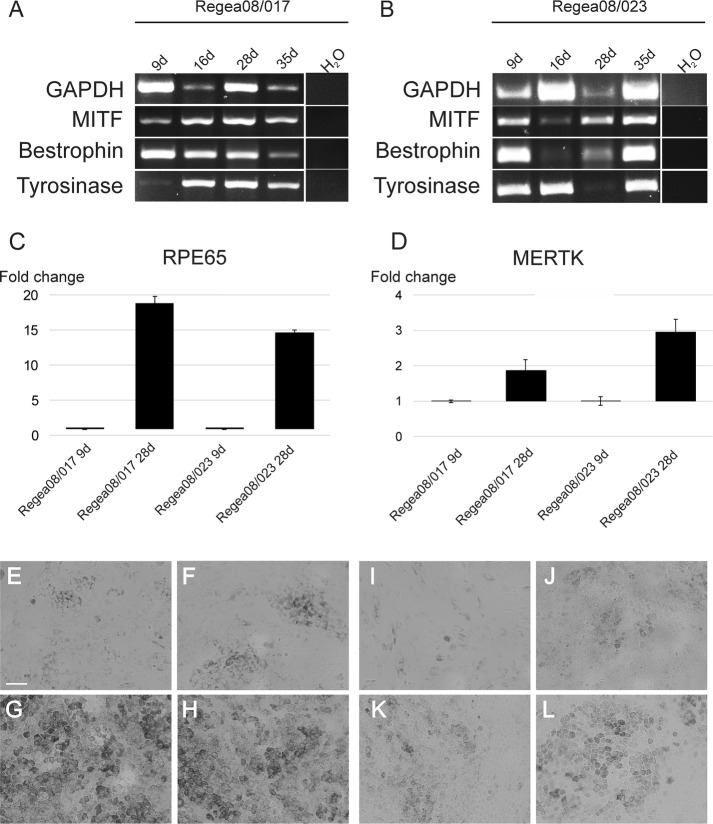
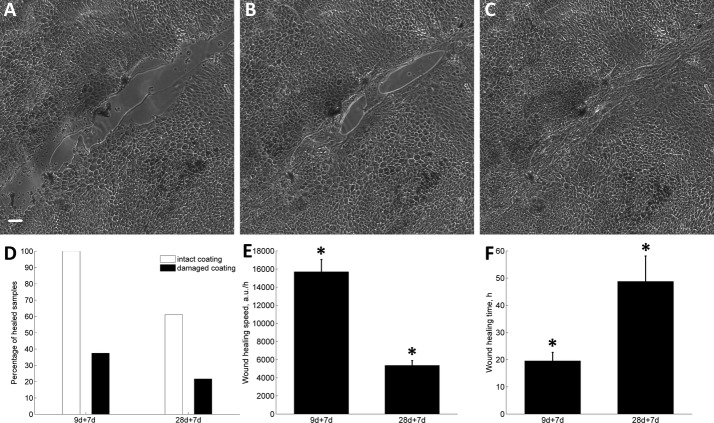
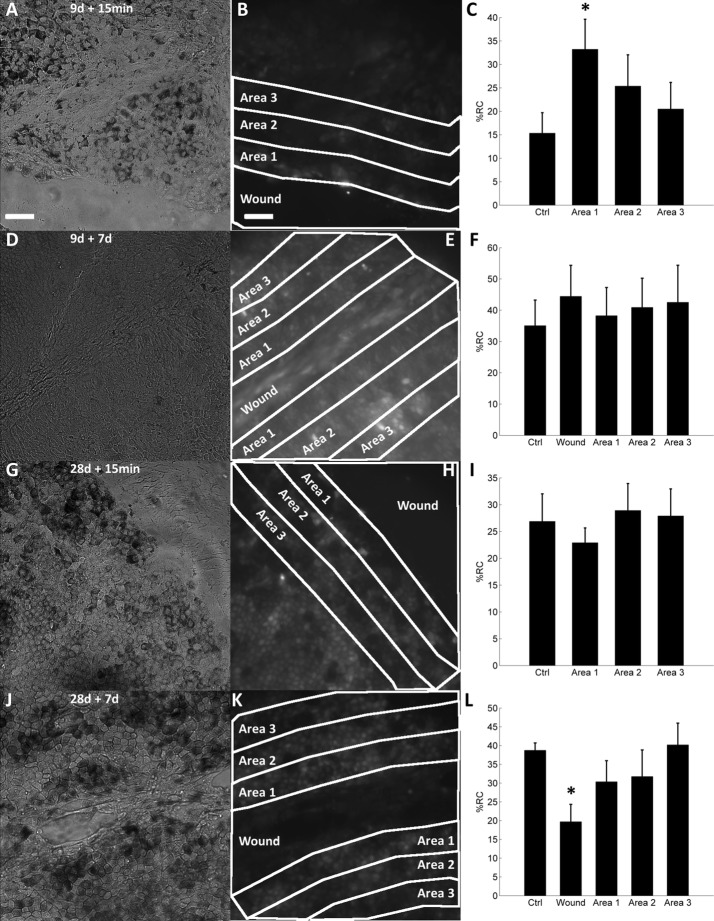
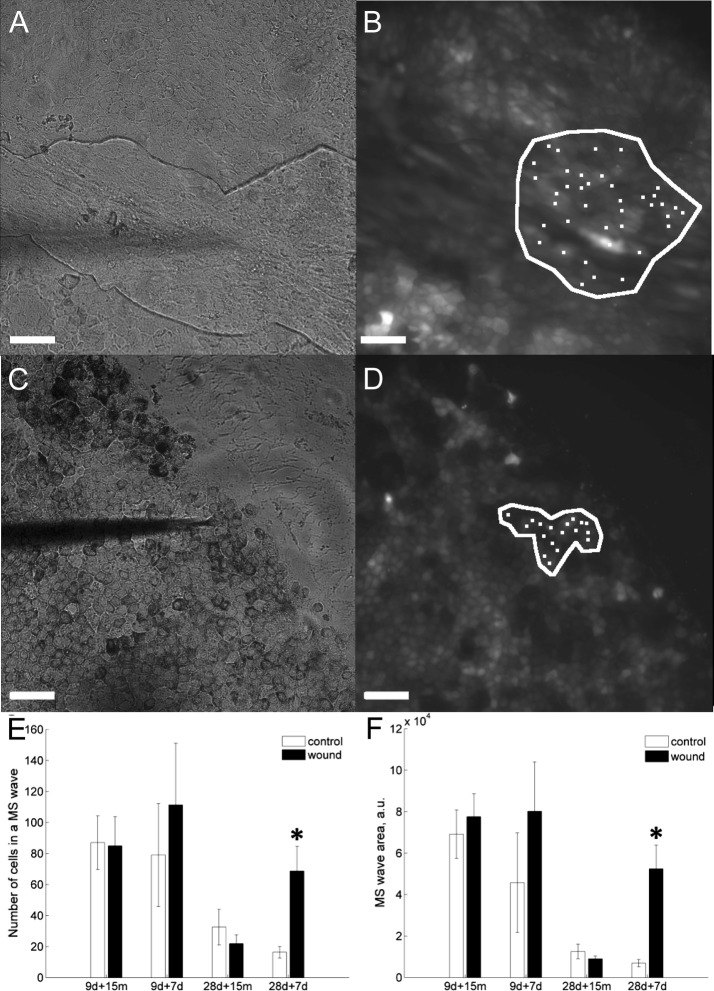
Methods: The 9-day-cultured or 28-day-cultured hESC-RPEs from two different cell lines were wounded and the dynamics of spontaneous and mechanically induced intracellular Ca2+ activity was measured with live-cell Ca2+ imaging either immediately or 7 days after wounding. The healing time and speed were analyzed with time-lapse bright field microscopy. The Ca2+ activity and healing speed were analysed with image analysis. In addition the extracellular matrix deposition was assessed with confocal microscopy.

Results: The Ca2+ dynamics in hESC-RPE monolayers differed depending on the culture time: 9-day-cultured cells had higher number of cells with spontaneous Ca2+ activity close to freshly wounded edge compared to control areas, whereas in 28-day-cultured cells there was no difference in wounded and control areas. The 28-day-cultured, wounded and 7-day-healed hESC-RPEs produced wide-spreading intercellular Ca2+ waves upon mechanical stimulation, while in controls propagation was restricted. Most importantly, both wave spreading and spontaneous Ca2+ activity of cells within the healed area, as well as the cell morphology of 28-day-cultured, wounded and thereafter 7-day-healed areas resembled the 9-day-cultured hESC-RPEs.

Conclusions: This acquired knowledge about Ca2+ dynamics of wounded hESC-RPE monolayers is important for understanding the dynamics of RPE wound healing, and could offer a reliable functionality test for RPE cells. The data presented in here suggests that assessment of Ca2+ dynamics analysed with image analysis could be used as a reliable non-invasive functionality test for RPE cells.

Keywords: Ca2+ waves; Cell maturation; Image analysis; Mechanical stimulation; Mechanically induced intercellular Ca2+ waves; RPE; Spontaneous [Ca2+]i increases; Wound healing; hESC-RPE.


Figures

Fig. 1
Fig. 1
Gene expression analysis and morphology of hESC-RPE cells. Gene expression of a house-keeping gene GAPDH, and RPE-specific marker genes MITF, bestrophin and tyrosinase were assessed with reverse transcription–polymerase chain reaction (RT-PCR) from Regea08/017 (A) and Regea08/023 (B) hESC-RPE cells cultured for 9, 16, 28, and 35 days. Water was used as negative control. Relative gene expression of mature RPE markers, the retinal pigment epithelium specific protein 65 kDa (RPE65) (C) and receptor tyrosine kinase MerTK (MERTK) (D) of 9-day and 28-day cultured non-wounded (i.e. control) samples. The Ct values of target genes were approximately 30. A bright filed image of Regea08/017 hESC-RPEs cultured for 9 days (E), 16 days (F), 28 days (G), and 35 days (H). Bright filed image of Regea08/023 hESC-RPEs cultured for 9 days (I), 16 days (J), 28 days (K), and 35 days (L). Scale bar 50 μm
Fig. 2
Fig. 2
Morphology and polarity of hESC-RPE cultures. Localization of tight junction protein ZO-1 (red) and Ki67-positive proliferative cells (green) in control and wounded Regea08/017 and Regea08/023 hESC-RPEs. Nuclei were counterstained with DAPI (blue). Non-wounded area of Regea08/017 hESC-RPEs cultured for 35 days (AC). Regea08/017 hESC-RPEs wounded on day 28 of culture and allowed to heal for 7 days, 35 days of culture in total (DF). Non-wounded area of Regea08/023 hESC-RPEs cultured for 35 days (GI). Regea08/023 hESC-RPEs wounded on day 28 of culture and allowed to heal for 7 days, 35 days of culture in total (JL). On the left row are the Z-stack from the apical side, in the middle from the nuclear level, and on the right row from the basal side of the culture. The cross-hairs of Z-plane indicators are intensified for clarity. Scale bar 10 μm
Fig. 3
Fig. 3
Extracellular protein localization in hESC-RPE cultures. Localization of extracellular matrix protein collagen I (red) and laminin (green) in control and wounded Regea08/017 and Regea08/023 hESC-RPEs. Nuclei were counterstained with DAPI (blue). Non-wounded area of Regea08/017 hESC-RPEs cultured for 16 days (AC). Regea08/017 hESC-RPEs cultured for 9 days, wounded and imaged 7 days after wounding, cultured for 16 days in total (DF). Non-wounded area of Regea08/023 hESC-RPEs cultured for 16 days (GI). Regea08/023 hESC-RPEs wounded on day 9 of culture and allowed to heal for 7 days, cultured for 16 days in total (JL). On the left row are the Z-stack from the apical side, in the middle from the nuclear level, and on the right row from the basal side of the culture. The cross-hairs of Z-plane indicators are intencified for clarity. Scale bar: 10 μm
Fig. 4
Fig. 4
Cell size differences in 9- to 35-day-cultured hESC-RPE. Cell area was analyzed by manual cell boarder segmentation indicated by red lines (a). Scale bar: 50 μm. Analysis of cell areas (b) of hESC-RPEs cultured for 9 days (ns = 4), 16 days (ns = 6), 28 days (ns = 6) or 35 days (ns = 5), and 28-day-cultured hESC-RPEs, wounded and visualized 7 days after wounding (7 days) (ns = 2). The presented data are combined from Regea08/017 and Regea08/023 hESC-RPEs
Fig. 5
Fig. 5
Wound healing speed and time. Bright field image of Regea08/023 hESC-RPEs wounded on day 28 of culture, then healed for 7 days, visualized immediately after wounding (A), 58 h after wounding (B), and 118 h after wounding (C). Scale bar: 50 μm. Percentage of completely healed samples (white bar—intact coating; black bar—damaged coating) wounded on day 9 and healed for 7 days (coating intact, ns = 16; coating damaged, ns = 8) or wounded on day 28 and healed for 7 days (coating intact, ns = 18; coating damaged, ns = 23) (D). Wound healing speed during a 7-day follow-up of 9-(ns = 16) or 28-day-cultured (ns = 11) hESC-RPEs (E). Wound healing time during a 7-day follow-up of 9-(ns = 16) or 28-day-cultured (ns = 11) hESC-RPE cells (F). The presented data are combined from Regea08/017 and Regea08/023 hESC-RPEs
Fig. 6
Fig. 6
Percentage of cells with spontaneous [Ca2+]i increases (%RC) in wounded hESC-RPEs at different areas related to the wound location. A bright field image of 9-day-cultured, wounded hESC-RPEs, visualized immediately after wounding (A). A fluorescence image of the same sample as in A loaded with Ca2+-sensitive indicator Fluo-4 AM (B). The wound area (“wound”) and adjacent areas (“Area 1”, “Area 2”, “Area 3”) are marked with white lines. Analyzed percentage of responsive cells (%RC) in non-wounded control (ns = 8), and area 1 (ns = 8), area 2 (ns = 8) and area 3 (ns = 8) (C). Statistical significance: p < 0.05 is marked with Asterisk. A bright field image of 9-day-cultured then wounded hESC-RPEs, visualized 7 days after wounding (D). A fluorescence image of the same sample as in D loaded with Ca2+-sensitive indicator fluo-4 AM (E). The wound area and adjacent areas are marked with white lines. The %RC in non-wounded control (ns = 8), wounded area (ns = 8) and area 1 (ns = 8), area 2 (ns = 8), and area 3 (ns = 6) (F). A bright field image of 28-day-cultured and wounded hESC-RPEs, visualized immediately after wounding (G). A fluorescence image of the same sample as in G loaded with Ca2+-sensitive indicator Fluo-4 AM (H). The wound area and adjacent areas are marked with white lines. The %RC in non-wounded control (ns = 8) and area 1 (ns = 8), area 2 (ns = 8), and area 3 (ns = 8) (I). A bright field image of 28-day-cultured then wounded hESC-RPEs, visualized 7 days after wounding (J). A fluorescence image of the same sample as in J loaded with Ca2+-sensitive indicator Fluo-4 AM (K). The wound area and adjacent areas are marked with white lines. The %RC in non-wounded control (ns = 4), wounded area (ns = 4) and area 1 (ns = 4), area 2 (ns = 4), and area 3 (ns = 4) (L). The presented data are combined from Regea08/017 and Regea08/023 hESC-RPEs
Fig. 7
Fig. 7
Ca2+ wave propagation in wounded hESC-RPEs after mechanical stimulation. A bright field image of a hESC-RPE monolayer (9d + 7d) (A). The dark shadow of micropipette lowered towards the cell to perform mechanical stimulation can be seen. Fluorescence image of the same culture as in A loaded with fluorescent Ca2+ sensitive dye Fluo-4 AM that reflects [Ca2+]i concentration in the cytoplasm (B). A white line indicates the area of the monolayer that responded to single-cell mechanical stimulation. White dots indicate the cells that participate in a mechanically induced Ca2+ wave. Similarly a bright field image of a hESC-RPE monolayer (28 days + 7 days) (C). The dark shadow of micropipette lowered towards the cell to perform mechanical stimulation can be seen. Fluorescence image of the same culture as in A loaded with fluorescent Ca2+ sensitive dye Fluo-4 AM that reflects [Ca2+]i concentration in the cytoplasm (D). A white line indicates the area of the monolayer that responded to single-cell mechanical stimulation. White dots indicate the cells that participate in a mechanically induced Ca2+ wave. Number of hESC-RPE cells participating in a mechanically induced intercellular Ca2+ wave in wounded 9-day-cultured cells followed for 15 min (ctrl, ns = 7; wounded, ns = 7), or for 7 days (ctrl, ns = 7; wounded, ns = 7). The mechanically induced intercellular Ca2+ wave in wounded 28-day-cultured cells followed for 15 min (ctrl, ns = 8; wounded, ns = 8), or for 7 days (ctrl, ns = 6; wounded, ns = 7). E White bar—control; black bar—wound edge or healed wound. Statistical significance: p < 0.05 is indicated with Asterisk. Area of a mechanically induced intercellular Ca2+ wave spreading in wounded 9-day-cultured cells followed for 15 min (ctrl ns = 7; wounded, ns = 7), or for 7 days (ctrl, ns = 7; wounded, ns = 7). The mechanically induced intercellular Ca2+ wave spreading in wounded 28-day-cultured cells followed for 15 min (ctrl, ns = 8; wounded ns = 8), or for 7 days (ctrl, ns = 6; wounded, ns = 7). F White bar—control; black bar—wound edge or healed wound. Statistical significance: p < 0.05 is indicated with Asterisk. The presented data are combined from Regea08/017 and Regea08/023 hESC-RPEs

References

    1. Sparrow JR, Hicks D, Hamel CP. The retinal pigment epithelium in health and disease. Curr Mol Med. 2010;10(9):802–823. doi: 10.2174/156652410793937813. - DOI - PMC - PubMed
    1. Strauss O. The retinal pigment epithelium in visual function. Physiol Rev. 2005;85(3):845–881. doi: 10.1152/physrev.00021.2004. - DOI - PubMed
    1. Binder S, Stanzel BV, Krebs I, Glittenberg C. Transplantation of the RPE in AMD. Progress Ret Eye Res. 2007;26(5):516–554. doi: 10.1016/j.preteyeres.2007.02.002. - DOI - PubMed
    1. Klettner A, Kauppinen A, Blasiak J, Roider J, Salminen A, Kaarniranta K. Cellular and molecular mechanisms of age-related macular degeneration: from impaired autophagy to neovascularization. Int J Biochem Cell Biol. 2013;45(7):1457–1467. doi: 10.1016/j.biocel.2013.04.013. - DOI - PubMed
    1. Lopez PF, Sippy BD, Lambert HM, Thach AB, Hinton DR. Transdifferentiated retinal pigment epithelial cells are immunoreactive for vascular endothelial growth factor in surgically excised age-related macular degeneration-related choroidal neovascular membranes. Invest Ophthalmol Vis Sci. 1996;37(5):855–868. - PubMed

LinkOut - more resources