Comparative Study
. 2018 Jul 31;10(1):100.
doi: 10.1186/s13148-018-0531-y.

Effects of novel HDAC inhibitors on urothelial carcinoma cells

Affiliations
Comparative Study

Effects of novel HDAC inhibitors on urothelial carcinoma cells

Aline Kaletsch et al. Clin Epigenetics. .

Abstract

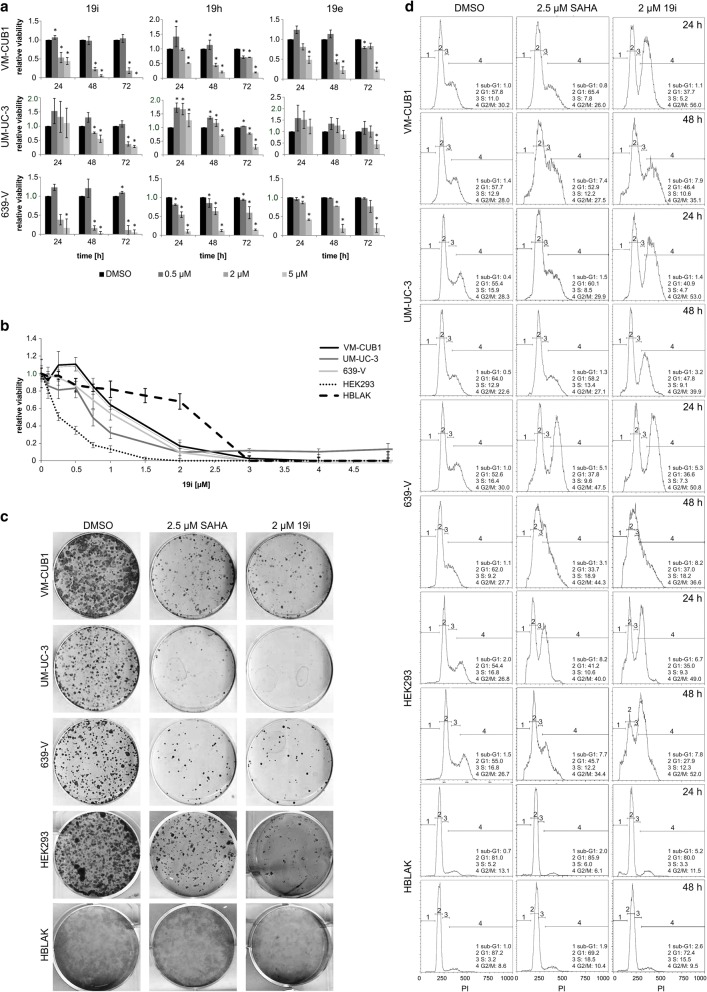
Background: Histone deacetylase inhibitors (HDACi) are promising anti-cancer drugs that could also be employed for urothelial carcinoma (UC) therapy. It is unclear, however, whether inhibition of all 11 zinc-dependent HDACs or of individual enzymes is more efficacious and specific. Here, we investigated the novel HDACi 19i (LMK235) with presumed preferential activity against class IIA HDAC4/5 in comparison to the pan-HDACi vorinostat (SAHA) and the HDAC4-specific HDACi TMP269 in UC cell lines with basal expression of HDAC4 and characterized two HDAC4-overexpressing UC cell lines.

Methods: Cytotoxic concentrations 50% (CC50s) for HDACi were determined by MTT assay and high-content analysis-based fluorescent live/dead assay in UC cell lines with different expression of HDAC4 and as well as in normal urothelial cell cultures, HBLAK and HEK-293 cell lines. Effects of HDACis were analyzed by flow cytometry; molecular changes were followed by qRT-PCR and Western blots. UC lines overexpressing HDAC4 were established by lentiviral transduction. Inhibitor activity profiles of HDACi were obtained by current state in vitro assays, and docking analysis was performed using an updated crystal structure of HDAC4.

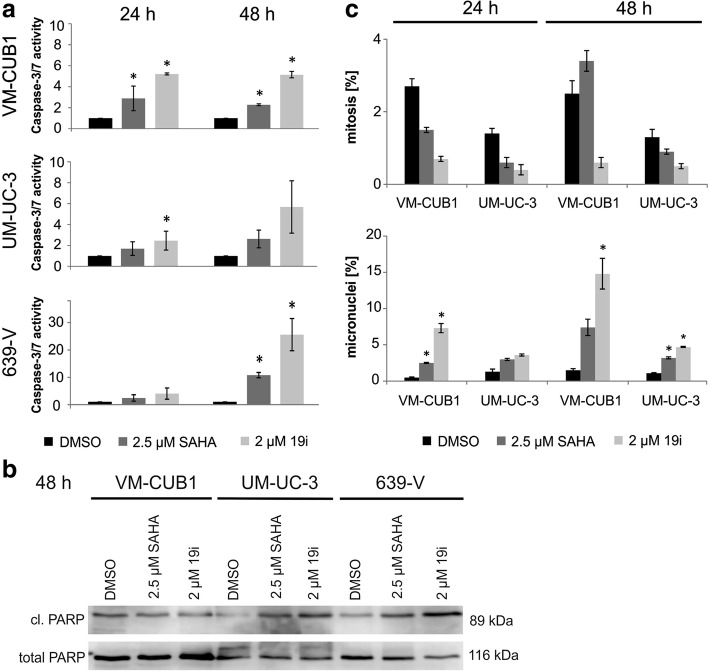
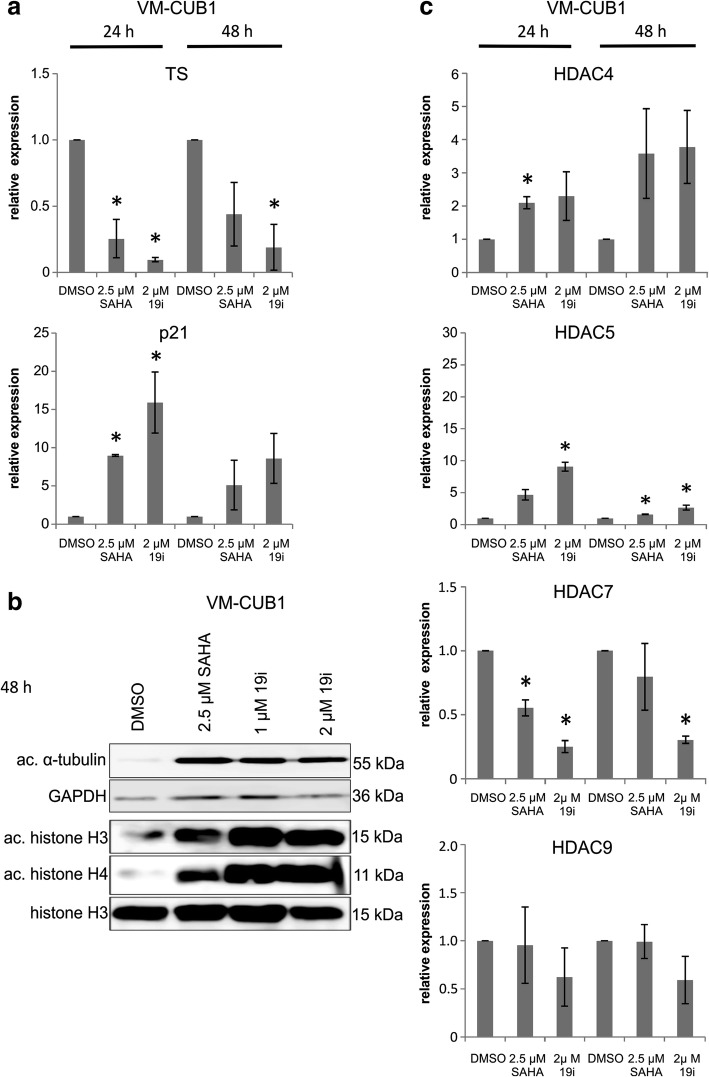
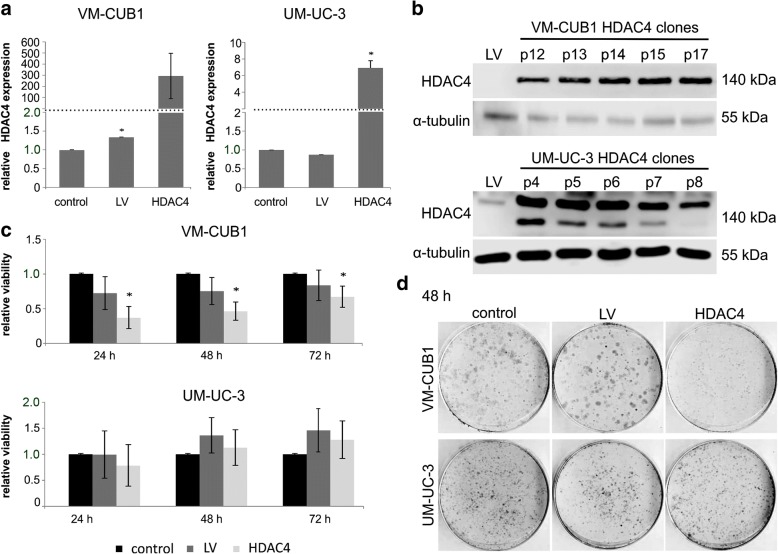
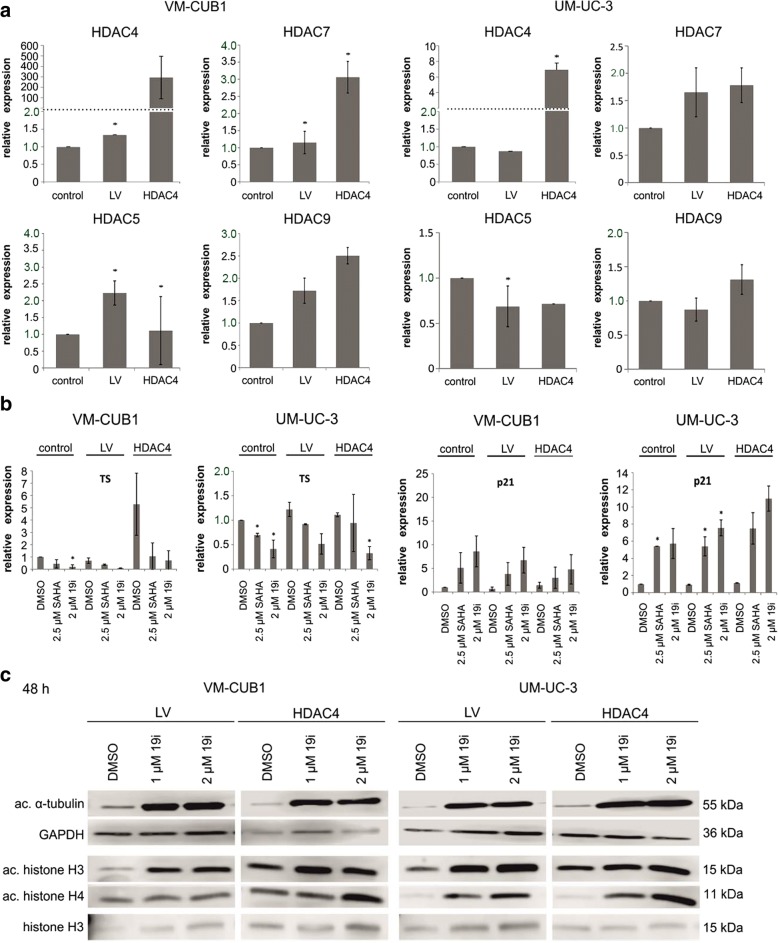
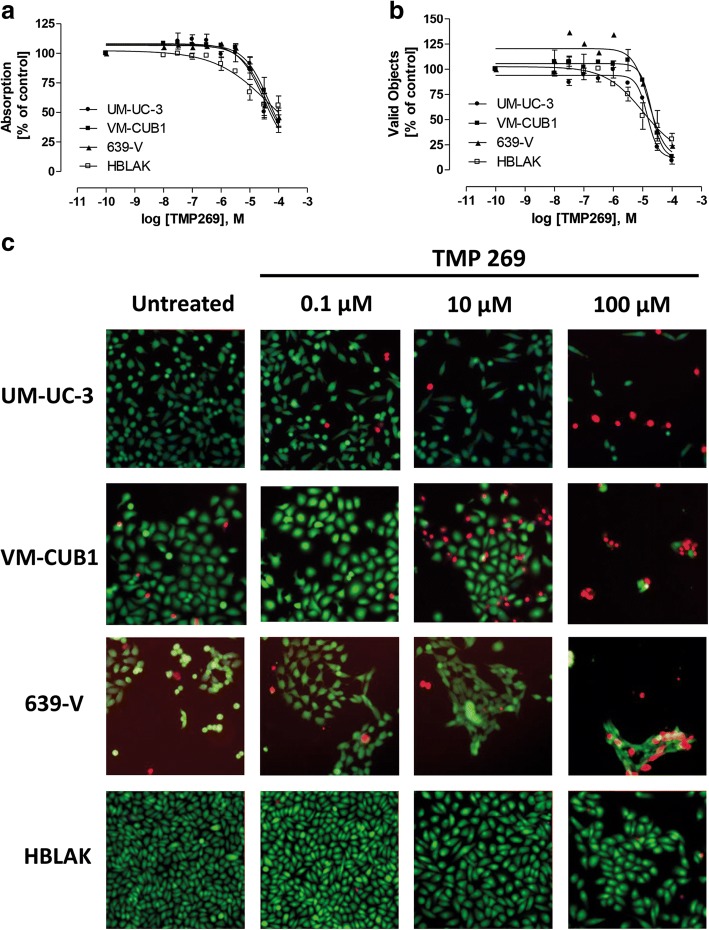
Results: In UC cell lines, 19i CC50s ranged around 1 μM; control lines were similarly or less sensitive. Like SAHA, 19i increased the G2/M-fraction, disturbed mitosis, and elicited apoptosis or in some cells senescence. Thymidylate synthase expression was diminished, and p21CIP1 was induced; global histone acetylation and α-tubulin acetylation also increased. In most cell lines, 19i as well as SAHA induced HDAC5 and HDAC4 mRNAs while rather repressing HDAC7. UC cell lines overexpressing HDAC4 were not significantly less sensitive to 19i. Reevaluation of the in vitro HDAC isoenzyme activity inhibition profile of 19i and its docking to HDAC4 using current assays suggested rather low activity against class IIA HDACs. The specific class IIA HDAC inhibitor TMP269 impeded proliferation of UC cell lines only at concentrations > 10 μM.

Conclusions: Anti-neoplastic effects of 19i on UC cells appear to be exerted by targeting class I HDACs. In fact, HDAC4 may rather impede UC growth. Our results suggest that targeting of class IIA HDACs 4/5 may not be optimal for UC therapy. Moreover, our investigation provides further evidence for cross-regulation of class IIA HDACs by class I HDACs.

Keywords: Cell cycle arrest; Class IIA HDACs; Histone deacetylase HDAC4; Histone deacetylase inhibitor; Urothelial bladder cancer.


Conflict of interest statement

Ethics approval and consent to participate

Primary urothelial cell cultures were used with informed consent of the patients and approval by the Ethics Committee of the Medical Faculty of the Heinrich-Heine-University, study number 1788.

Consent for publication

Not applicable.

Competing interests

The authors declare that they have no competing interests.

Publisher’s Note

Springer Nature remains neutral with regard to jurisdictional claims in published maps and institutional affiliations.

Figures

Fig. 1
Fig. 1
Effects of HDACi 19e, 19h, and 19i on urothelial carcinoma and control cell lines. HDACi were applied to UC cell lines VM-CUB1, UM-UC-3, and 639-V as well as control cell lines HEK293 (non-urothelial) and HBLAK (urothelial). a Dose-response curves after 24, 48, and 72 h of treatment of UCCs with 0.5, 2, und 5 μM of each HDACi. The calculated significances refer to the DMSO solvent control (*p < 0.05). Data shown are mean from n = 3. b Dose-response curve of UCCs VM-CUB1, UM-UC-3, 639-V, HEK293, and HBLAK after 72 h of treatment with 0.5–5 μM 19i. Data shown are mean from n = 4. c Clonogenicity following 19i treatment of VM-CUB1, UM-UC-3, 639-V, HEK293, and HBLAK. Cells were treated with DMSO, 2.5 μM SAHA, or 2 μM 19i for 48 h, replated at clonal density, cultured for 2 weeks, and stained with Giemsa. d Changes in cell cycle distribution after 24 or 48 h of treatment with 19i. Cell cycle changes and amount of apoptotic cells (as sub-G1 fraction) determined by flow cytometry following 2 μM 19i or 2.5 μM SAHA treatment in VM-CUB1 UM-UC-3, 639-V, HEK293, and HBLAK. DMSO is the solvent control. Data shown are representative of triplicates
Fig. 2
Fig. 2
Cellular effects of 19i treatment in urothelial carcinoma cell lines. a Caspase 3/7 activity (24 and 48 h) and b cleaved PARP (48 h) were monitored in UCCs VM-CUB1, UM-UC-3, and 639-V after treatment with 19i (2 μM) or SAHA (2.5 μM). c Quantitative analysis of nuclear morphology, based on DAPI stainings, in UCCs VMCUB1 and UM-UC-3. The percentages of mitoses and micronuclei are shown after treatment with HDACi 19i (2 μM), SAHA (2.5 μM), or DMSO for 24 or 48 h. The calculated significances refer to the DMSO solvent control (*p < 0.05). Data in a and c are mean from n = 3; the blot in b shows a representative experiment
Fig. 3
Fig. 3
Effects of 19i treatment on gene expression and protein acetylation in VM-CUB1. Effects on mRNA and protein expression levels in VM-CUB1 following treatment with 19i (2 μM), SAHA (2.5 μM), or DMSO as solvent control. a Expression of thymidylate synthase (TS) and p21CIP1(CDKN1A) mRNAs after 24 and 48 h of treatment as measured by qRT-PCR. b Acetylation of α-tubulin and histones H3 and H4 after 48 h of treatment with 2.5 μM SAHA, 1 or 2 μM 19i, or DMSO; ac acetylated. c HDAC4, HDAC5, HDAC7, and HDAC9 mRNA expression after 24 or 48 h of treatment. In a and c, all values indicate relative expression compared to a standard for each gene and adjusted to TBP as a reference gene. Significance levels refer to the DMSO solvent control (*p < 0.05). Data in a and c are mean from n = 3; the blot in b shows a representative experiment
Fig. 4
Fig. 4
Effects of HDAC4 overexpression by lentiviral transfection on UC cell lines. VM-CUB1 and UM-UC-3 cell lines lentivirally transduced to overexpress HDAC4 were compared to their parental cells and cell lines transduced with empty vector (LV). a HDAC4 mRNA expression measured by qRT-PCR. Data shown are mean from n = 3. b HDAC4 protein expression over different passages in VM-CUB1 and UM-UC-3 cells transduced with HDAC4 vector. Note an additional band in overexpressing UM-UC-3 cells possibly representing a proteolytic fragment of HDAC4. Representative experiment. c MTT proliferation assays after the indicated incubation times (24/48/72 h); all cells were treated with the solvent control DMSO only. The calculated significances refer to the parental cell line, *p < 0.05. Data shown are mean from n = 4. d Clonogenicity assay. Representative examples of triplicates
Fig. 5
Fig. 5
Cellular effects of 19i on HDAC4-overexpressing UCCs. Cellular effects of 19i on VM-CUB1 and UM-UC-3 cell lines lentivirally transduced to overexpress HDAC4 compared to the parental cells and cell lines transduced with empty vector (LV). a Dose-response curves of UC cell lines treated with increasing concentrations of 19i (0.1–5 μM) for 72 h. Data shown are mean from n = 4. b Clonogenicity of cells treated with DMSO, 2 μM 19i, or 2.5 μM SAHA for 48 h. Note smaller colonies in VM-CUB1-HDAC4 DMSO-treated controls. Representative examples of triplicates. c Analysis of nuclear morphology, based on DAPI staining. The percentage amount of mitoses and micronuclei are shown after treatment with HDACi 19i (2 μM), SAHA (2.5 μM), or DMSO for 48 h. The calculated significances refer to the DMSO solvent control (*p < 0.05). Data shown are mean from n = 3
Fig. 6
Fig. 6
Effects of 19i treatment on gene expression and acetylation status in HDAC4-overexpressing UCCs. Gene expression and protein acetylation in VM-CUB1 and UM-UC-3 cell lines lentivirally transduced to overexpress HDAC4 compared to the parental cells and cell lines transduced with empty vector (LV). a Expression of HDAC4, HDAC5, HDAC7, and HDAC9 mRNAs. The calculated significances refer to the respective parental cell line (*p < 0.05). b TS and p21CIP1 mRNA expression following treatment with 19i (2 μM) or SAHA (2.5 μM) for 48 h. The calculated significances refer to the DMSO solvent control (*p < 0.05). Acetylation of α-tubulin and histones H3 or H4 after 19i treatment (1 and 2 μM) after 48 h. Data in a and b are mean from n = 3; the blot in c shows a representative experiment
Fig. 7
Fig. 7
Effects of HDACi TMP269 on urothelial carcinoma cell lines. a Concentration-response curves after 72 h of treatment with TMP269 in UCC cells using MTT assays. Data shown are mean ± SEM of the three independent experiments. b Concentration-response curves after 72 h of treatment with TMP269 in UCC cells using high-content analysis-based fluorescent live/dead assay. Data shown are mean ± SEM of the three independent experiments. c Staining of live (calcein-AM, green) and dead (PI, red) UCC cells after 72 h of treatment with TMP269. Data shown are a representative experiment of a set of 3

References

    1. Moser MA, Hagelkruys A, Seiser C. Transcription and beyond: the role of mammalian class I lysine deacetylases. Chromosoma. 2014;123:67–78. doi: 10.1007/s00412-013-0441-x. - DOI - PMC - PubMed
    1. Witt O, Deubzer HE, Milde T, Oehme I. HDAC family: what are the cancer relevant targets? Cancer Lett. 2009;277:8–21. doi: 10.1016/j.canlet.2008.08.016. - DOI - PubMed
    1. Weichert W. HDAC expression and clinical prognosis in human malignancies. Cancer Lett. 2009;280:168–176. doi: 10.1016/j.canlet.2008.10.047. - DOI - PubMed
    1. Montezuma D, Henrique RM, Jeronimo C. Altered expression of histone deacetylases in cancer. Crit Rev Oncog. 2015;20:19–34. doi: 10.1615/CritRevOncog.2014012554. - DOI - PubMed
    1. Nakagawa M, Oda Y, Eguchi T, Aishima S, Yao T, Hosoi F, et al. Expression profile of class I histone deacetylases in human cancer tissues. Oncol Rep. 2007;18:769–774. - PubMed

Publication types

MeSH terms