. 2018 Jul 31;10(1):74.
doi: 10.1186/s13195-018-0402-y.

In vivo quantification of neurofibrillary tangles with [18F]MK-6240

Affiliations

In vivo quantification of neurofibrillary tangles with [18F]MK-6240

Tharick A Pascoal et al. Alzheimers Res Ther. .

Abstract

Background: Imaging agents capable of quantifying the brain's tau aggregates will allow a more precise staging of Alzheimer's disease (AD). The aim of the present study was to examine the in vitro properties as well as the in vivo kinetics, using gold standard methods, of the novel positron emission tomography (PET) tau imaging agent [18F]MK-6240.

Methods: In vitro properties of [18F]MK-6240 were estimated with autoradiography in postmortem brain tissues of 14 subjects (seven AD patients and seven age-matched controls). In vivo quantification of [18F]MK-6240 binding was performed in 16 subjects (four AD patients, three mild cognitive impairment patients, six healthy elderly individuals, and three healthy young individuals) who underwent 180-min dynamic scans; six subjects had arterial sampling for metabolite correction. Simplified approaches for [18F]MK-6240 quantification were validated using full kinetic modeling with metabolite-corrected arterial input function. All participants also underwent amyloid-PET and structural magnetic resonance imaging.

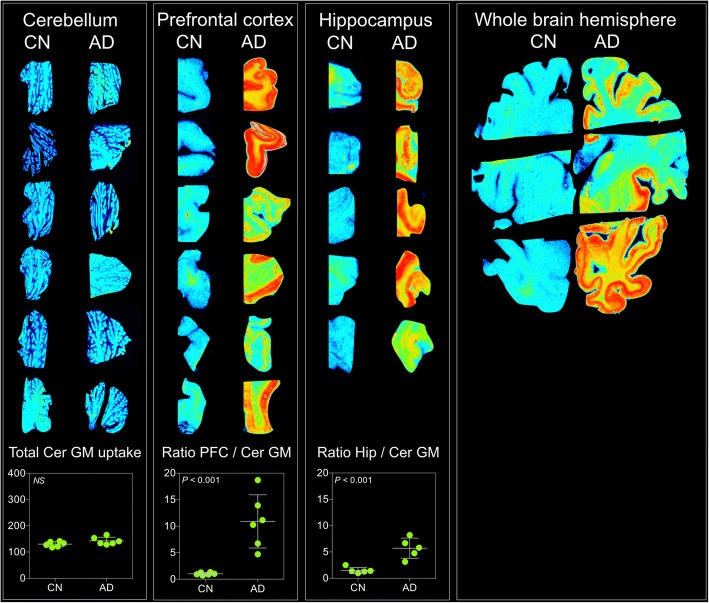
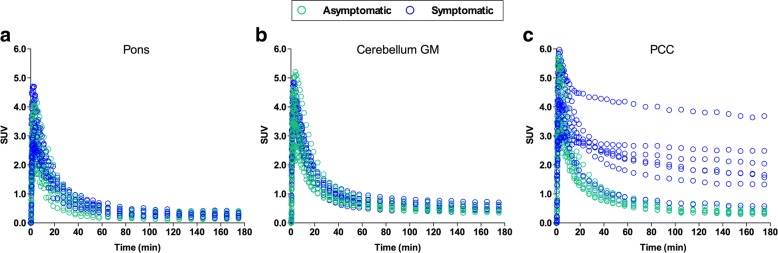
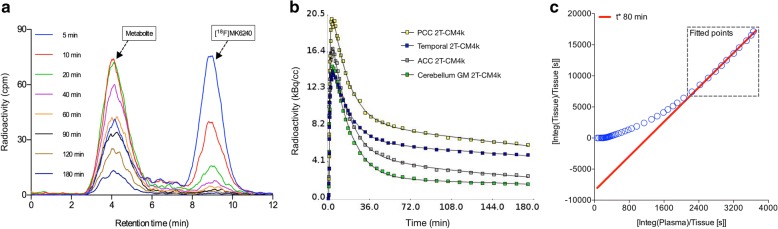
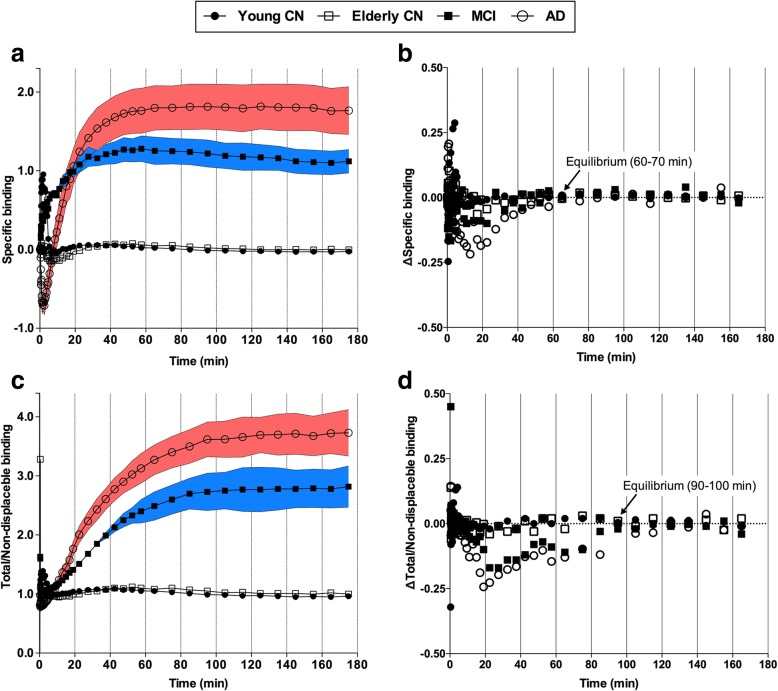
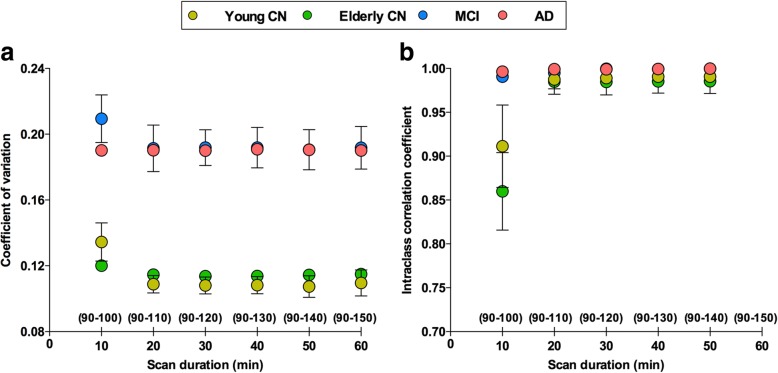
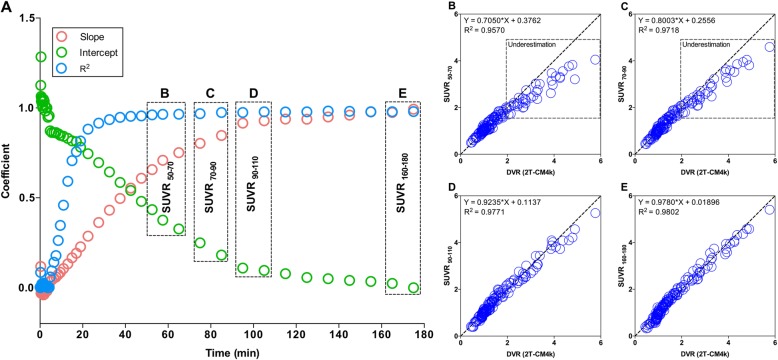
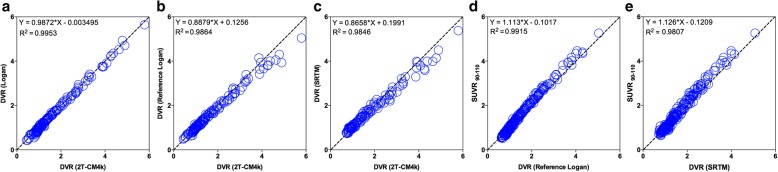
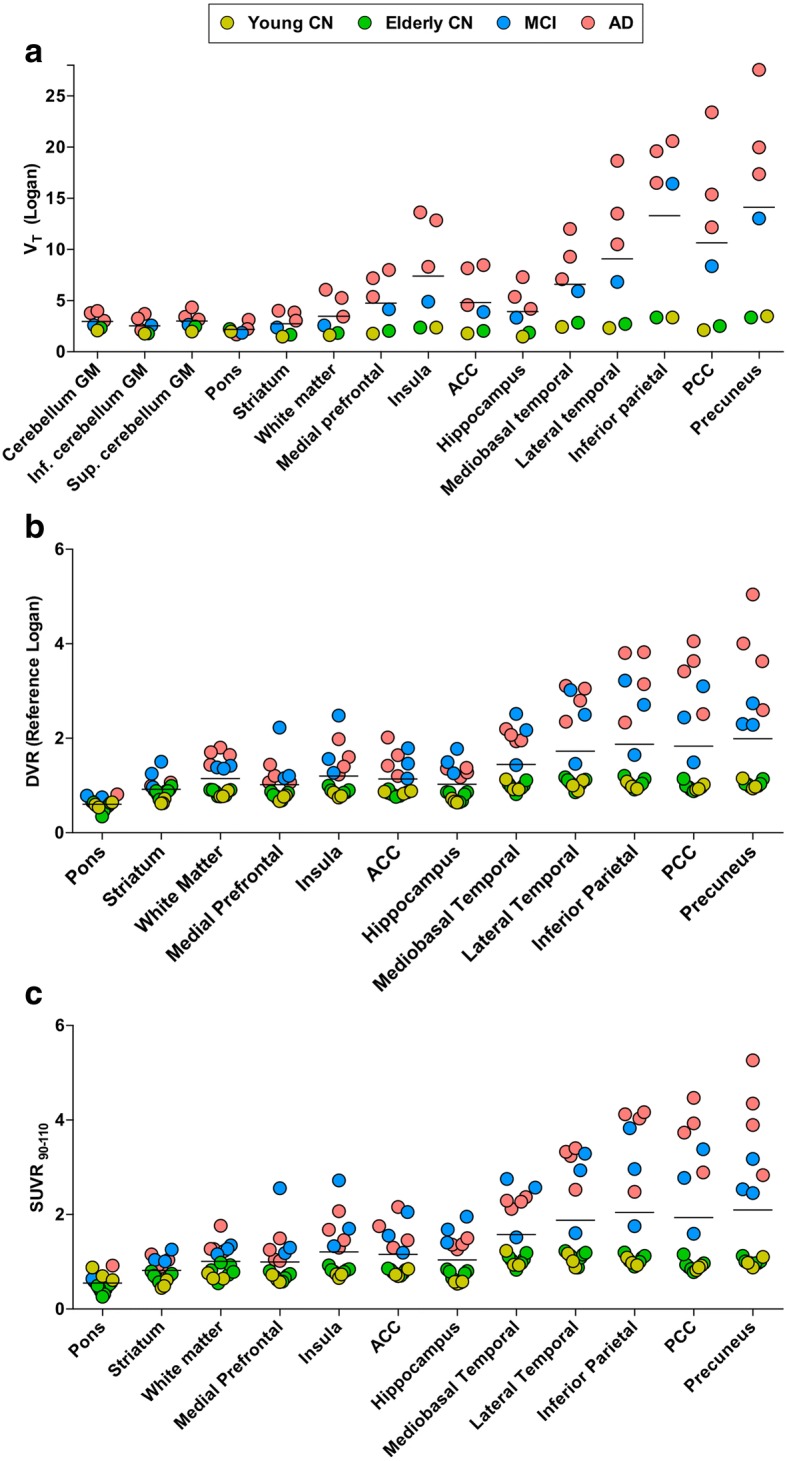
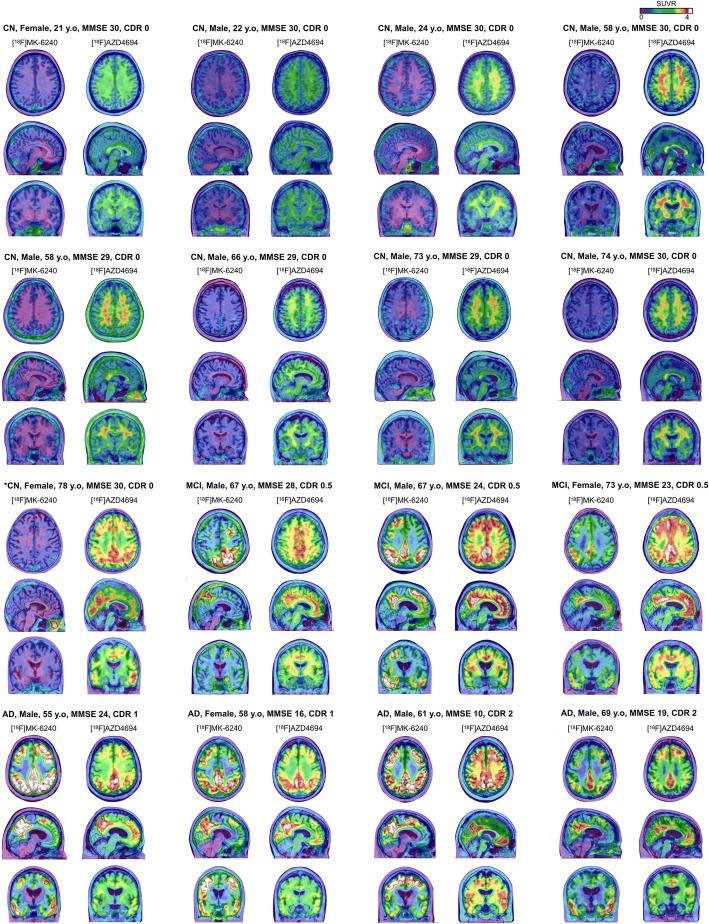
Results: In vitro [18F]MK-6240 uptake was higher in AD patients than in age-matched controls in brain regions expected to contain tangles such as the hippocampus, whereas no difference was found in the cerebellar gray matter. In vivo, [18F]MK-6240 displayed favorable kinetics with rapid brain delivery and washout. The cerebellar gray matter had low binding across individuals, showing potential for use as a reference region. A reversible two-tissue compartment model well described the time-activity curves across individuals and brain regions. Distribution volume ratios using the plasma input and standardized uptake value ratios (SUVRs) calculated after the binding approached equilibrium (90 min) were correlated and higher in mild cognitive impairment or AD dementia patients than in controls. Reliability analysis revealed robust SUVRs calculated from 90 to 110 min, while earlier time points provided inaccurate estimates.

Conclusions: This evaluation shows an [18F]MK-6240 distribution in concordance with postmortem studies and that simplified quantitative approaches such as the SUVR offer valid estimates of neurofibrillary tangle load 90 min post injection. [18F]MK-6240 is a promising tau tracer with the potential to be applied in the disease diagnosis and assessment of therapeutic interventions.

Keywords: Alzheimer’s disease; Neurofibrillary tangles; Tau positron emission tomography.


Conflict of interest statement

Ethics approval and consent to participate

This study was approved by the McGill institutional review boards, and informed written consent was obtained from all of the participants.

Consent for publication

Not applicable.

Competing interests

IB is a Merck & Co. employee. SG received honoraria for serving on the scientific advisory boards of Alzheon, Axovant, Lilly, Lundbeck, Novartis, Schwabe, and TauRx. The remaining authors declare that they have no competing interests.

Publisher’s Note

Springer Nature remains neutral with regard to jurisdictional claims in published maps and institutional affiliations.

Figures

Fig. 1
Fig. 1
[18F]MK-6240 autoradiographs of postmortem brain tissues of AD and CN individuals. In vitro autoradiography of postmortem brain tissue from prefrontal (PFC) and hippocampal (Hip) cortices as well as cerebellum and whole hemisphere of Alzheimer’s disease (AD) patients and cognitively healthy (CN) individuals. Similar total uptake was found in cerebellar gray matter (Cer GM) of CN and AD individuals (P = 0.2). AD patients had higher relative uptake (ratio with Cer GM) than CN individuals in PFC and Hip cortices (P < 0.001). Total uptake was measured as photostimulated luminescence units per mm2. NS not significant
Fig. 2
Fig. 2
Regional time–activity curves from selected brain regions for all participants. Regional standardized uptake value (SUV) time–activity curves of [18F]MK-6240 in pons (a), cerebellar gray matter (GM) (b), and posterior cingulate cortex (PCC) (c) for all participants. Green dots represent young and elderly cognitively healthy individuals, blue dots represent MCI and Alzheimer’s disease patients
Fig. 3
Fig. 3
Chromatography, model compartmentalization, and data fit of [18F]MK-6240. a Chromatogram showing parent compound and metabolite of [18F]MK-6240 in counts per minute (cpm) for representative AD participant. b Reversible two-tissue compartment model with four parameters (2T-CM4k) fit in time–activity curves from posterior cingulate (PCC), temporal, and anterior cingulate (ACC) cortices, as well as cerebellar gray matter (GM) of representative mild cognitive impairment (MCI) individual. c Logan graphical plot became linear approximately 80 min after injection in PCC of representative MCI individual
Fig. 4
Fig. 4
[18F]MK-6240 uptake reaches equilibrium during scan time. Curves show mean of specific (a) and total/nondisplaceable (ND) (c) binding across diagnostic groups over different scan acquisition time points and area between bars represents standard error of the mean. Variation (Δ) of specific (b) and total/ND (d) binding calculated as difference between averaged uptake value in a given time point to averaged uptake value in subsequent time point. Variation of specific and total/ND binding approached 0 in frames starting at 60 and 90 min for both mild cognitive impairment (MCI) and Alzheimer’s disease (AD) patients, respectively. Elderly and young cognitively healthy (CN) individuals reached aforementioned equilibria earlier. Target and ND regions assumed in curves were composite value from regions with highest ligand uptake (precuneus, posterior cingulate, inferior parietal, and lateral temporal cortices) and cerebellum gray matter, respectively
Fig. 5
Fig. 5
SUVRs measured from 90 to 110 min provide reliable [18F]MK-6240 estimates. a Dots and bars represent coefficient of variation (CV) and 95% confidence interval (CI), respectively, assessed for each individual’s regions of interest (ROIs) and averaged within groups using standardized uptake value ratios (SUVRs) measured with different durations after tracer reached equilibrium (90 min, see Fig. 4). b Dots and bars represent intraclass correlation coefficient (ICC) and 95% CI, respectively, performed between SUVRs calculated using progressively longer frames. 95% CI analyses suggested no differences in SUVR estimates measured using acquisitions equal to or longer than 20 min for [18F]MK-6240 scans starting 90 min post injection. CN cognitively healthy, MCI mild cognitive impairment, AD Alzheimer’s disease
Fig. 6
Fig. 6
SUVRs measured in later time frames had progressively more similar estimates than compartmental analysis. a Dots represent results of regressions between standardized uptake value ratios (SUVRs) obtained from different scan acquisition times and distribution volume ratio (DVR) obtained with reversible two-tissue comportment model (2T-CM4k) across subjects and brain regions. Association between SUVR and 2T-CM4k showed progressively better goodness of fit (R2) and these quantification methods showed progressively more similar estimates (slope closer to 1 and intercept closer to 0) when using progressively later time frames for SUVR calculation. Although strength of the relationship showed constant increase until end of experiment, it approached the asymptote of the curve at 90 min post injection. Scatter plots show association between 2T-CM4k DVRs and SUVRs calculated from (b) 50 to 70 min, (c) 70 to 90 min, (d) 90 to 110 min, and (e) 160 to 180 min. SUVRs calculated before 90 min post injection underestimated 2T-CM4k in regions with moderate and high binding, but not in low binding regions
Fig. 7
Fig. 7
Comparisons between different quantification methods for [18F]MK-6240. Scatter plots show regressions performed across individuals and brain regions between (a) Logan model vs reversible two-tissue comportment model with four parameters (2T-CM4k), (b) reference Logan model vs 2T-CM4k, (c) simplified reference tissue model (SRTM) vs 2T-CM4k, (d) SUVR90–110 vs reference Logan model, and (e) SUVR90–110 vs SRTM. (a–c) Individuals who underwent arterial blood sampling. (d, e) All participants. DVR distribution volume ratio
Fig. 8
Fig. 8
Quantification estimates across clinical diagnosis and brain regions. Horizontal bar represents mean. a Total volume of distribution (VT; ml/cm3) values obtained with Logan graphical method using plasma input function in individuals who underwent arterial blood sampling. b Distribution volume ratio (DVR) values obtained with reference Logan method and (c) standardized uptake value ratio values measured between 90 and 110 min (SUVR90–110) in all individuals, both using cerebellar gray matter (GM) as reference region. CN cognitively healthy, MCI mild cognitive impairment, AD Alzheimer’s disease, Inf. inferior, Sup. superior, ACC anterior cingulate cortex, PCC posterior cingulate cortex
Fig. 9
Fig. 9
[18F]MK-6240 SUVR parametric images of all participants. [18F]MK-6240 standardized uptake value ratio (SUVR) averaged between 90 and 110 min and [18F]AZD4694 SUVR maps, overlaid on the individuals’ structural MRI, of all individuals of the population. [18F]MK-6240 images show clear visual differentiation between symptomatic (mild cognitive impairment (MCI) and Alzheimer’s disease (AD)) and asymptomatic (cognitively healthy (CN) control) participants. All AD and MCI patients as well as one CN individual (*) were amyloid-β positive. CDR Clinical Dementia Rating, MMSE Mini-Mental State Examination, y.o years old

References

    1. Xia CF, Arteaga J, Chen G, Gangadharmath U, Gomez LF, Kasi D, Lam C, Liang Q, Liu C, Mocharla VP, et al. [(18)F]T807, a novel tau positron emission tomography imaging agent for Alzheimer's disease. Alzheimers Dement. 2013;9:666–676. doi: 10.1016/j.jalz.2012.11.008. - DOI - PubMed
    1. Chien DT, Bahri S, Szardenings AK, Walsh JC, Mu F, Su MY, Shankle WR, Elizarov A, Kolb HC. Early clinical PET imaging results with the novel PHF-tau radioligand [F-18]-T807. J Alzheimers Dis. 2013;34:457–468. doi: 10.3233/JAD-122059. - DOI - PubMed
    1. Harada R, Okamura N, Furumoto S, Furukawa K, Ishiki A, Tomita N, Hiraoka K, Watanuki S, Shidahara M, Miyake M, et al. [(18)F]THK-5117 PET for assessing neurofibrillary pathology in Alzheimer's disease. Eur J Nucl Med Mol Imaging. 2015;42:1052–1061. doi: 10.1007/s00259-015-3035-4. - DOI - PubMed
    1. Stepanov V, Svedberg M, Jia Z, Krasikova R, Lemoine L, Okamura N, Furumoto S, Mitsios N, Mulder J, Langstrom B, et al. Development of [11C]/[3H]THK-5351—a potential novel carbon-11 tau imaging PET radioligand. Nucl Med Biol. 2017;46:50–53. doi: 10.1016/j.nucmedbio.2016.12.004. - DOI - PubMed
    1. Hashimoto H, Kawamura K, Igarashi N, Takei M, Fujishiro T, Aihara Y, Shiomi S, Muto M, Ito T, Furutsuka K, et al. Radiosynthesis, photoisomerization, biodistribution, and metabolite analysis of 11C-PBB3 as a clinically useful PET probe for imaging of tau pathology. J Nucl Med. 2014;55:1532–1538. doi: 10.2967/jnumed.114.139550. - DOI - PubMed

Publication types

MeSH terms

Grants and funding