. 2018 Oct:179:266-297.
doi: 10.1016/j.cognition.2018.06.003. Epub 2018 Jul 2.

Successful structure learning from observational data

Affiliations

Successful structure learning from observational data

Anselm Rothe et al. Cognition. 2018 Oct.

Abstract

Previous work suggests that humans find it difficult to learn the structure of causal systems given observational data alone. We identify two conditions that enable successful structure learning from observational data: people succeed if the underlying causal system is deterministic, and if each pattern of observations has a single root cause. In four experiments, we show that either condition alone is sufficient to enable high levels of performance, but that performance is poor if neither condition applies. A fifth experiment suggests that neither determinism nor root sparsity takes priority over the other. Our data are broadly consistent with a Bayesian model that embodies a preference for structures that make the observed data not only possible but probable.

Keywords: Bayesian modeling; Causal reasoning; Causal structure learning.


Figures

Figure C.1:
Figure C.1:
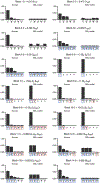
Model performances based on log-likelihoods. Larger log-likelihoods (i.e. likelihoods closer to 0) indicate better predictions about participants’ behavior. All predictions were out-of-sample predictions. The broken link and the LSL model were outperformed by the other models, supporting the findings based on correlations reported in the main text. For visual guidance, the models are ordered by their performance in Experiment 1 and the two process models (broken link and LSL) are colored in gray.
Figure D.1:
Figure D.1:
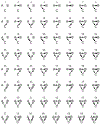
All possible directed graphs over three nodes.
Figure D.2:
Figure D.2:
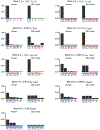
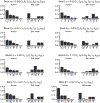
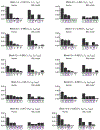
Model predictions and human judgments for additional blocks in Experiment 1.
Figure 1:
Figure 1:
Learning the causal structure of a power network given observations alone. (a) When voltage spikes are observed, either (i) stations A and B both have voltage spikes or (ii) B alone has voltage spikes. (b) These observations support the inference that station A sends power to station B.
Figure 2:
Figure 2:
Activation spreading over example networks from each class. In each case, panel (i) shows a start state and panel (iii) shows a stable end state. In our structure-learning task, the arrows were hidden and participants were asked to infer the structure of a network given a number of stable end states generated over that network.
Figure 3:
Figure 3:
Activation matrices of start states (S) and end states (T) for the four classes. For classes DN and PN only three of the 31 possible start states are shown. For classes PS and PN the end states depend on which links in the network are inactive: the end states shown here are for the case in Figure 2 for which two links are inactive.
Figure 4:
Figure 4:
A functional causal model that represents the PS network in Figure 2c. (a) The network includes exogenous variables such as UD, which determines whether node D is active in the start state, and UBD, which determines whether the link from B to D is active. Variables A through E have double boundaries, indicating that they are deterministic functions of their parents. (b) The conditional probability distribution for node D in the functional causal model. Node D is active if variable UD is active or if B and UBD are both active.
Figure 5:
Figure 5:
Experimental interface showing a presentation of Block 5 from Table 2. The observation panels at the top left show three observations provided during the observation phase. The learner is now asked to infer the structure of the underlying network, and has drawn a link from X to J that is duplicated in all three observation panels. The generating structure for this block includes a link from Z to J in addition to the link drawn by the learner.
Figure 6:
Figure 6:
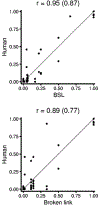
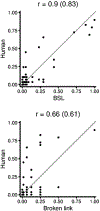
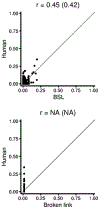
Comparison of the complete set of human responses with model predictions for Experiment 1. In each panel the first correlation is based on the complete set of responses, and the correlation in parentheses shows the average correlation across the individual blocks of the experiment.
Figure 7:
Figure 7:
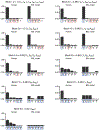
Model predictions and human judgments for Experiment 1. Five out of the full set of 64 structures are included in each plot, and these five structures always include the two structures chosen most frequently by humans and the two most probable structures according to the model. Networks enclosed in solid blue boxes are the generating structures from Table 2. Networks enclosed in dashed red boxes are invalid responses that cannot explain at least one observation in a given block. Unboxed networks can account for each individual observation in a given block, but have characteristic distributions that do not match the distribution for the block. Error bars show standard errors based on bootstrap simulations.
Figure 8:
Figure 8:
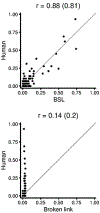
Comparison of the complete set of human responses with model predictions for Experiment 2. In each panel the first correlation is based on the complete set of responses, and the correlation in parentheses shows the average correlation across the individual blocks of the experiment.
Figure 9:
Figure 9:
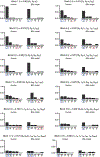
Model predictions and human judgments for Experiment 2.
Figure 10:
Figure 10:
Comparison of the complete set of human responses with model predictions for Experiment 3. In each panel the first correlation is based on the complete set of responses, and the correlation in parentheses shows the average correlation across the individual blocks of the experiment.
Figure 11:
Figure 11:
Model predictions and human judgments for Experiment 3.
Figure 12:
Figure 12:
Comparison of the complete set of human responses with model predictions for Experiment 4. In each panel the first correlation is based on the complete set of responses, and the correlation in parentheses shows the average correlation across the individual blocks of the experiment.
Figure 13:
Figure 13:
Model predictions and human judgments for Experiment 4.
Figure 14:
Figure 14:
Number of responses to Experiment 5 that preserved determinism, preserved root-sparsity, or were invalid. Counts are based on all blocks except block 5.
Figure 15:
Figure 15:
Experiment 5 data summarized by blocks.
Figure 16:
Figure 16:
Individual-level results for Experiment 5. Participants are ordered based on how consistently they preserve determinism. Counts are based on all blocks except block 5.
Figure 17:
Figure 17:
Comparison of the complete set of human responses with model predictions for Experiment 5. In each panel the first correlation is based on the complete set of responses, and the correlation in parentheses shows the average correlation across the individual blocks of the experiment.
Figure 18:
Figure 18:
Model predictions and human judgments for Experiment 5.
Figure 19:
Figure 19:
Correlation plots for all models. The last row shows data collapsed across experiments.
Figure 20:
Figure 20:
Selected blocks in which the symmetry model captures qualitative distinctions that are missed by the BSL.
Figure 21:
Figure 21:
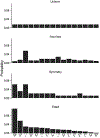
Four possible priors over graphs.

References

    1. Boddez Y, Houwer JD, & Beckers T (2017). The inferential reasoning theory of causal learning: Towards a multi-process propositional account In The Oxford Handbook of Causal Reasoning (p. 53). Oxford University Press.
    1. Bonawitz EB, & Lombrozo T (2012). Occam’s rattle: Children’s use of simplicity and probability to constrain inference. Developmental Psychology, 48, 1156–1164. - PubMed
    1. Bramley NR, Dayan P, Griffiths TL, & Lagnado DA (2017). Formalizing Neurath’s ship: Approximate algorithms for online causal learning. Psychological Review,. - PubMed
    1. Cheng PW (1997). From covariation to causation: a causal power theory. Psychological Review, 104, 367–405.
    1. Chi MTH, Roscoe RD, Slotta JD, Roy M, & Chase CC (2012). Misconceived causal explanations for emergent processes. Cognitive Science, 36, 1–61. - PubMed

Publication types

LinkOut - more resources