Review
. 2018 Jul 31;19(8):2234.
doi: 10.3390/ijms19082234.

Cardiomyopathies and Related Changes in Contractility of Human Heart Muscle

Affiliations
Review

Cardiomyopathies and Related Changes in Contractility of Human Heart Muscle

Petr G Vikhorev et al. Int J Mol Sci. .

Abstract

About half of hypertrophic and dilated cardiomyopathies cases have been recognized as genetic diseases with mutations in sarcomeric proteins. The sarcomeric proteins are involved in cardiomyocyte contractility and its regulation, and play a structural role. Mutations in non-sarcomeric proteins may induce changes in cell signaling pathways that modify contractile response of heart muscle. These facts strongly suggest that contractile dysfunction plays a central role in initiation and progression of cardiomyopathies. In fact, abnormalities in contractile mechanics of myofibrils have been discovered. However, it has not been revealed how these mutations increase risk for cardiomyopathy and cause the disease. Much research has been done and still much is being done to understand how the mechanism works. Here, we review the facts of cardiac myofilament contractility in patients with cardiomyopathy and heart failure.

Keywords: Ca2+-sensitivity; cardiomyopathy mutations; dilated cardiomyopathy; human heart muscle contractility; hypertrophic cardiomyopathy; length dependent activation; troponin phosphorylation.


Conflict of interest statement

The authors declare no conflict of interest.

Figures

Figure 1
Figure 1
Maximum force of contraction by different types of preparations: from hearts of patients with HCM (A) and DCM (C). As can be seen, the maximal force generated by cardiomyocytes as well as myofibrils is lower in the HCM samples. The force is not diminished in DCM samples. (B) Density of myofibrils in cells were measured in some HCM samples. Each data point represents a different experimental group where the symbols indicate genes where mutations were found. See also Table 1 and Table 2. All values are normalised to those of donor heart muscle (dashed line).
Figure 2
Figure 2
Contractile kinetics parameters. Parameters of activation (A,C) and relaxation (B,D) kinetics of HCM and DCM muscle samples. Each data point represents a different experimental group where the symbols indicate genes where mutations were found. All values are normalised to those of donor heart muscle. See also Table 1 and Table 2.
Figure 3
Figure 3
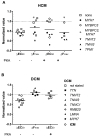
The concentration of Ca2+ required for half-maximal contraction (EC50) and total phosphorylation level of troponin I (pTnI) and MyBP-C (pMyBP-C) of heart tissue samples. The data are from Table 1 and Table 2. The values for HCM (A,B), DCM (C,D) are normalized to control donor hearts (dashed line). The effect of PKA treatment on Ca2+-sensitivity of heart muscles from HCM (B) and DCM (D) patients. The EC50 values are normalized to the EC50 of normal donor heart samples. PKA eliminates or at least lessens the difference between cardiomyopathic and donor hearts. Each data point represents a different experimental group where the symbols indicate genes where mutations were found.
Figure 4
Figure 4
An increase in EC50 after phosphorylation with protein kinase A (PKA) for HCM (A) and DCM (B) muscle samples. Each data point represents a different experimental group where the symbols indicate genes where mutations were found. See also Table 1 and Table 2.
Figure 5
Figure 5
Length dependent activation in cardiac muscle. An increase in sarcomere length decreases EC50 and increases Fmax. Each data point represents a different experimental group where the symbols indicate genes where mutations were found. The values for HCM (A) and DCM (B) are normalized to control donor hearts (dashed line). The data is from Table 1 and Table 2.
Figure 6
Figure 6
Passive stiffness. Passive stiffness was evaluated as a Young’s modulus or as a passive tension generated by muscle at stretch. Each data point represents a different experimental group where the symbols indicate genes where mutations were found. The values for HCM (A) and DCM (B) are normalized to control donor hearts (dashed line). The data is from Table 1 and Table 2.

References

    1. Gordan R., Gwathmey J.K., Xie L.H. Autonomic and endocrine control of cardiovascular function. World J. Cardiol. 2015;7:204–214. doi: 10.4330/wjc.v7.i4.204. - DOI - PMC - PubMed
    1. MacLeod K.T. Recent advances in understanding cardiac contractility in health and disease. F1000Research. 2016;5 doi: 10.12688/f1000research.8661.1. - DOI - PMC - PubMed
    1. Eisner D.A., Caldwell J.L., Kistamas K., Trafford A.W. Calcium and Excitation-Contraction Coupling in the Heart. Circ. Res. 2017;121:181–195. doi: 10.1161/CIRCRESAHA.117.310230. - DOI - PMC - PubMed
    1. Moore J.R., Campbell S.G., Lehman W. Structural determinants of muscle thin filament cooperativity. Arch. Biochem. Biophys. 2016;594:8–17. doi: 10.1016/j.abb.2016.02.016. - DOI - PMC - PubMed
    1. Risi C., Eisner J., Belknap B., Heeley D.H., White H.D., Schroder G.F., Galkin V.E. Ca(2+)-induced movement of tropomyosin on native cardiac thin filaments revealed by cryoelectron microscopy. Proc. Natl. Acad. Sci. USA. 2017;114:6782–6787. doi: 10.1073/pnas.1700868114. - DOI - PMC - PubMed

MeSH terms